Sugar-Based Excipients Market by Product (Actual Sugars, Sugar Alcohols, Artificial Sweeteners), Type (Powder/Granule, Crystal, Syrup), Functionality (Filler & Diluent, Tonicity Agents), Formulation (Oral, Topical, Parenteral) - Global Forecast to 2021


The global sugar excipients market is estimated to grow at a CAGR of 4.3% from 2016 to 2021 to reach USD 1,060.6 Million by 2021. Increasing use of co-processed excipients to improve the dissolution, bioavailability, and solubility of recently developed active pharmaceutical ingredients (APIs), rapid growth in the generics market due to the patent expiration of many blockbuster drugs, and increasing development of orally disintegrating tablets (ODTs) are expected to propel the growth of this market. However, stringent regulatory requirements leading to shortage of FDA-approved manufacturing sites can hinder their market growth to a certain extent.
In this report, the global sugar excipients market is segmented on the basis of product, type, functionality, formulation, and region. On the basis of product, the market is segmented into actual sugars, sugar alcohols, and artificial sweeteners. The actual sugars accounted for the largest share of the market in 2015, owing to its high utilization in oral formulations and pediatric formulations due to its non-toxicity and negligible reaction with drugs.
Based on the type, the market is segmented into powders/granules, direct compression sugars, crystals, and syrups. Similarly, on the basis of functionality, the market is segmented into fillers & diluents, flavoring agents, tonicity agents, and other functionalities. Based on formulation, this market is segmented into oral formulations, parenteral formulations, topical formulations, and other formulations.
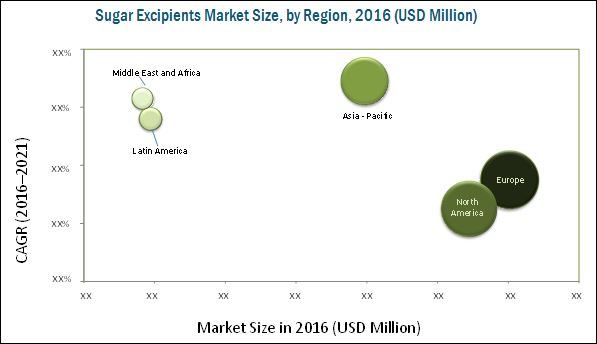
Geographically, the global sugar excipients market is segmented into North America, Europe, Asia-Pacific, and the Rest of the World. In 2015, Europe commanded a major share of the global market. Europe’s largest share is primarily attributed to the increasing investments in drug development, increasing production of generic drugs, and favorable government initiatives in the region. North America, represents the second largest market for sugar excipients. Factors such as presence of large number of global pharmaceutical companies, and increasing demand of generic drugs due to patent expiration of blockbuster drugs are majorly contributing to the growth of the market in this region. However, Asia-Pacific is expected to witness the highest growth rate during the forecast period. Growth in the Asia-Pacific market can be attributed to the significant growth in the regional healthcare market as well as the pharmaceutical industry, growing scientific base and capability, and favorable government policies, and low-cost manufacturing advantages in this region.
Some of the prominent players in the global sugar excipients market include Roquette Group (France), DFE Pharma (Germany), BASF SE (Germany), Ashland Inc. (U.S.), Archer Daniels Midland Company (U.S.), MEGGLE AG (Germany), Associated British Foods Plc (U.K.), Cargill, Inc. (U.S.), Colorcon, Inc. (U.S.), FMC Corporation (U.S.), and The Lubrizol Corporation (U.S.).
Target Audience:
- Pharmaceutical Excipient Manufacturers
- Sugar Excipient Manufacturers
- Distributor and Suppliers of Pharmaceutical Excipients
- Research and Development (R&D) Companies
- Drug Manufacturers
- Drug Suppliers and Distributors
- Pharmaceutical/Medical Associations
- Market Research and Consulting Firms
- Venture Capitalists and Investors
To know about the assumptions considered for the study, download the pdf brochure
Scope of the Report:
The research report categorizes the global sugar excipients market into the following segments:
Global Sugar Excipients Market, by Product
- Actual Sugars
- Sugar Alcohols
- Artificial Sweeteners
Global Sugar Excipients Market, by Type
- Powders/granules
- Direct Compression Sugars
- Crystals
- Syrups
Global Sugar Excipients Market, by Functionality
- Fillers & Diluents
- Flavoring Agents
- Tonicity Agents
- Other Functionalities
Global Sugar Excipients Market, by Functionality
- Oral Formulations
- Parenteral Formulations
- Topical Formulations
- Other Formulations
Global Sugar Excipients Market, by Region
-
Europe
- Switzerland
- Germany
- Italy
- U.K.
- France
- Spain
- Rest of Europe (RoE)
-
North America
- U.S.
- Canada
-
Asia-Pacific
- Japan
- China
- India
- Rest of Asia-Pacific (RoAPAC)
-
Rest of the World (RoW)
- Latin America
- Middle East and Africa
Available Customizations
With the given market data, MarketsandMarkets offers customizations as per the company’s specific needs. The following customization options are available for the report:
Product Analysis
- Product matrix, which gives a detailed comparison of the product portfolios of each company
Geographic Analysis
- Further breakdown of the Rest of Asia-Pacific market into South Korea, Australia, New Zealand, and others
- Further breakdown of the Rest of Latin America sugar excipients market into Brazil, Argentina, and Mexico
Company Information
- Detailed analysis and profiling of additional market players (Up to 5)
The global sugar excipients market is projected to reach USD 1,060.6 Million by 2021 from USD 860.6 Billion in 2016, at a CAGR of 4.3% from 2016 to 2021. The market is expected to witness significant growth in the coming years due to the increasing use of co-processed excipients, rapid growth in the generics market due to the patent expiration of many blockbuster drugs, and increasing development of orally disintegrating tablets (ODTs). Increased regulatory requirements leading to shortage of FDA-approved manufacturing sites is expected to hinder the growth of this market. Stringent quality control procedures and pricing pressure faced by key players are the major challenges for this industry.
The report analyzes the market by product, type, functionality, formulation, and region. On the basis of product, the global market is segmented into actual sugars, sugar alcohols, and artificial sweeteners. In 2015, the actual sugar segment accounted for the largest share of the market. The large share of this segment is primarily attributed to its high utilization in oral formulations and pediatric formulations due to its non-toxicity and negligible reaction with drugs. Based on type, the market is segmented into powders/granules, direct compression sugars, crystals, and syrups. The powders/granules segment accounted for the largest share of global sugar excipients market in 2015. The large share of the powders/granules segment is mainly attributed to its wide use in various types of formulations in the pharmaceutical industry. Based on functionality, the market is segmented into fillers & diluents, flavoring agents, tonicity agents, and other functionalities. Based on the formulation, the market is segmented into oral formulations, parenteral formulations, topical formulations, and other formulations. In 2015, oral formulations accounted for the largest share of global market.
In 2015, Europe dominated the sugar excipients market, followed by North America. The increasing investments in drug development, increasing production of generic drugs, and favorable government initiatives in the region are factors driving the growth of this market in Europe. On the other hand, the Asia-Pacific region is expected to witness the highest growth rate during the forecast period. The significant growth in the regional healthcare market as well as the pharmaceutical industry, growing scientific base and capability, favorable government policies, and low-cost manufacturing advantage are key market drivers in this region.
The global sugar excipients market is characterized by the presence of a large number of players. Amidst intense market competition, major players are continuously focusing on achieving higher market shares through expansions; agreements, alliances, and collaborations; mergers and acquisitions; new product launches; and intellectual property acquisitions. In 2015, the market was dominated by four major players, together accounting for a share of around 40%-45%. Roquette Group (France), DFE Pharma (Germany), BASF SE (Germany), Ashland Inc. (U.S.) led the market. Some of the other major players in this market include Archer Daniels Midland Company (U.S.), MEGGLE AG (Germany), Associated British Foods Plc (U.K.), Cargill, Inc. (U.S.), Colorcon, Inc. (U.S.), FMC Corporation (U.S.), and The Lubrizol Corporation (U.S.).
To speak to our analyst for a discussion on the above findings, click Speak to Analyst
 Exclusive indicates content/data unique to MarketsandMarkets and not available with any competitors.
Table of Contents
1 Introduction (Page No. - 16)
1.1 Objectives of the Study
1.2 Market Definition
1.3 Market Scope
1.3.1 Markets Covered
1.3.2 Years Considered for the Study
1.4 Currency
1.5 Limitations
1.6 Stakeholders
2 Research Methodology (Page No. - 19)
2.1 Research Approach
2.1.1 Secondary Sources
2.1.1.1 Key Data From Secondary Sources
2.1.2 Primary Sources
2.1.2.1 Key Data From Primary Sources
2.1.2.2 Key Industry Insights
2.2 Market Size Estimation
2.3 Market Breakdown and Data Triangulation
2.4 Market Share Estimation
2.5 Assumptions for the Study
3 Executive Summary (Page No. - 27)
4 Premium Insights (Page No. - 34)
4.1 Sugar Excipients: Market Overview
4.2 Asia-Pacific: Market, By Formulation
4.3 Market: Geographic Growth Opportunities
4.4 Market: Geographic Mix
4.5 Market: Developing vs Developed Countries/Regions
5 Market Overview (Page No. - 38)
5.1 Introduction
5.2 Market Dynamics
5.3 Key Market Drivers
5.3.1 Increasing Use of Co-Processed Excipients
5.3.2 Patent Cliffs Driving the Demand for Sugar Excipients in the Generics Market
5.3.3 Increasing Development of Orally Disintegrating Tablets (ODTS)
5.4 Key Market Restraints
5.4.1 Increased Regulatory Requirements Leading to Shortage of Fda-Approved Manufacturing Sites
5.5 Key Market Opportunities
5.5.1 Shifting Focus of Pharmaceutical Manufacturing to Emerging Countries
5.6 Key Challenges
5.6.1 Stringent Quality Control Procedures
5.6.2 Pricing Pressure Faced By Prominent Players
6 Industry Insights (Page No. - 47)
6.1 Key Industry Trends
6.1.1 Regulatory Transition Driven By the Rising Need of High-Quality Excipients
6.1.2 Rising Demand and Emphasis on Co-Processed Excipients for the Growing Need in Direct Compression
6.2 Product Benchmarking
6.3 Regulatory Analysis
6.3.1 North America
6.3.1.1 U.S.
6.3.1.2 Canada
6.3.2 Europe
6.3.3 APAC
6.3.3.1 Japan
6.3.3.2 China
6.3.3.3 India
7 Global Sugar Excipients Market, By Product (Page No. - 58)
7.1 Introduction
7.2 Actual Sugars
7.3 Sugar Alcohols
7.4 Artificial Sweeteners
8 Global Sugar Excipients Market, By Type (Page No. - 65)
8.1 Introduction
8.2 Powders/Granules
8.3 Direct Compression Sugars
8.4 Crystals
8.5 Syrups
9 Global Sugar Excipients Market, By Functionality (Page No. - 72)
9.1 Introduction
9.2 Fillers & Diluents
9.3 Flavoring Agents
9.4 Tonicity Agents
9.5 Other Functionalities
10 Global Sugar Excipients Market, By Formulation (Page No. - 79)
10.1 Introduction
10.2 Oral Formulations
10.3 Parenteral Formulations
10.4 Topical Formulations
10.5 Other Formulations
11 Global Sugar Excipients Market, By Region (Page No. - 87)
11.1 Introduction
11.2 Europe
11.2.1 Switzerland
11.2.2 Germany
11.2.3 Italy
11.2.4 U.K.
11.2.5 France
11.2.6 Spain
11.2.7 Rest of Europe (RoE)
11.3 North America
11.3.1 U.S.
11.3.2 Canada
11.4 Asia-Pacific (APAC)
11.4.1 Japan
11.4.2 China
11.4.3 India
11.4.4 Rest of Asia-Pacific
11.5 Rest of the World (RoW)
11.5.1 Latin America
11.5.2 Middle East and Africa
12 Competitive Landscape (Page No. - 145)
12.1 Overview
12.2 Market Share Analysis
12.3 Competitive Situations and Trends
12.3.1 Expansions
12.3.2 Agreements, Alliances, and Collaborations
12.3.3 Mergers and Acquisitions
12.3.4 Product Launches
12.3.5 Intellectual Property Acquisitions
13 Company Profiles (Page No. - 154)
(Overview, Products and Services, Financials, Strategy & Development)*
13.1 Introduction
13.2 Ashland Inc.
13.3 Archer Daniels Midland Company
13.4 BASF SE
13.5 DFE Pharma
13.6 Roquette Group
13.7 Associated British Foods PLC
13.8 Cargill, Inc.
13.9 Colorcon Inc.
13.10 FMC Corporation
13.11 The Lubrizol Corporation
13.12 Meggle AG
*Details on Overview, Products and Services, Financials, Strategy & Development Might Not Be Captured in Case of Unlisted Companies.
14 Appendix (Page No. - 175)
14.1 Insights of Industry Experts
14.2 Discussion Guide
14.3 Other Developments
14.4 Knowledge Store: Marketsandmarkets’ Subscription Portal
14.5 Introducing RT: Real-Time Market Intelligence
14.6 Available Customizations
14.7 Related Reports
14.8 Author Details
List of Tables (125 Tables)
Table 1 Directly Compressible Co-Processed Sugar Excipients
Table 2 Drugs Going Off-Patent From 2013 to 2017
Table 3 List of Commercially Available Orally Disintegrating Tablets (ODTS)
Table 4 List of Commercially Available ODTS With Co-Processed Sugar Excipients
Table 5 Increasing Use of Co-Processed Excipients to Drive Market Growth During the Forecast Period
Table 6 Increased Regulatory Requirements Leading to Shortage of Fda-Approved Manufacturing Sites to Restrain Market Growth
Table 7 Shifting Focus of Pharmaceutical Manufacturing to Emerging Nations Provides Major Opportunities for Market Growth
Table 8 Stringent Quality Control Procedures and Pricing Pressure Faced By Prominent Players are Major Challenges in the Market
Table 9 Product Portfolio Analysis: Sugar Excipients Market
Table 10 Global Market Size, By Product, 2014–2021 (USD Million)
Table 11 Global Market Size, By Country/Region, 2014–2021 (USD Million)
Table 12 Global Actual Sugars Market Size, By Country/Region, 2014–2021 (USD Million)
Table 13 Global Sugar Alcohols Market Size, By Country/Region, 2014–2021 (USD Million)
Table 14 Global Artificial Sweeteners Market Size, By Country/Region, 2014–2021 (USD Million)
Table 15 Global Market Size, By Type, 2014–2021 (USD Million)
Table 16 Global Market Size for Powders/Granules, By Country/Region, 2014–2021 (USD Million)
Table 17 Commercially Available Direct Compression Sugars
Table 18 Global Market Size for Direct Compression Sugars, By Country/Region, 2014–2021 (USD Million)
Table 19 Global Market Size for Crystals, By Country/Region, 2014–2021 (USD Million)
Table 20 Global Market Size for Syrups, By Country/Region, 2014–2021 (USD Million)
Table 21 Global Market Size, By Functionality, 2014–2021 (USD Million)
Table 22 Global Market Size for Fillers & Diluents, By Country/Region, 2014–2021 (USD Million)
Table 23 Global Market Size for Flavoring Agents, By Country/Region, 2014–2021 (USD Million)
Table 24 Global Market Size for Tonicity Agents, By Country/Region, 2014–2021 (USD Million)
Table 25 Global Market Size for Other Functionalities, By Country/Region, 2014–2021 (USD Million)
Table 26 Global Market Size, By Formulation, 2014–2021 (USD Million)
Table 27 Typical Composition of Tablets
Table 28 Use of Sugar Excipients in Oral Formulations
Table 29 Global Market Size for Oral Formulations, By Country/Region, 2014–2021 (USD Million)
Table 30 Typical Composition of Parenteral Formulations
Table 31 Global Market Size for Parenteral Formulations, By Country/Region, 2014–2021 (USD Million)
Table 32 Global Market Size for Topical Formulations, By Country/Region, 2014–2021 (USD Million)
Table 33 Global Market Size for Other Formulations, By Country/Region, 2014–2021 (USD Million)
Table 34 Global Market Size, By Region, 2014–2021 (USD Million)
Table 35 Europe: Pharmaceutical Trade Statistics, 2000-2015 (USD Million)
Table 36 Pharmaceutical Production in European Countries/Region, 2010–2014 (USD Million)
Table 37 Europe: Market Size, By Country/Region, 2014–2021 (USD Million)
Table 38 Europe: Market Size, By Product, 2014–2021 (USD Million)
Table 39 Europe: Market Size, By Type, 2014–2021 (USD Million)
Table 40 Europe: Market Size, By Functionality, 2014–2021 (USD Million)
Table 41 Europe: Market Size, By Formulation, 2014–2021 (USD Million)
Table 42 Switzerland: Pharmaceutical Production and R&D Expenditure (2010–2014)
Table 43 Switzerland: Market Size, By Product, 2014-2021 (USD Million)
Table 44 Switzerland: Market Size, By Type, 2014-2021 (USD Million)
Table 45 Switzerland: Market Size, By Functionality, 2014-2021 (USD Million)
Table 46 Switzerland: Market Size, By Formulation, 2014-2021 (USD Million)
Table 47 Germany: R&D Investment & Pharmaceutical Production (2010-2014)
Table 48 Germany: Market Size, By Product, 2014–2021 (USD Million)
Table 49 Germany: Market Size, By Type, 2014–2021 (USD Million)
Table 50 Germany: Market Size, By Functionality, 2014–2021 (USD Million)
Table 51 Germany: Market Size, By Formulation, 2014–2021 (USD Million)
Table 52 Italy: R&D Investment & Pharmaceutical Production (2010-2014)
Table 53 Italy: Market Size, By Product, 2014–2021 (USD Million)
Table 54 Italy: Market Size, By Type, 2014–2021 (USD Million)
Table 55 Italy: Market Size, By Functionality, 2014–2021 (USD Million)
Table 56 Italy: Market Size, By Formulation, 2014–2021 (USD Million)
Table 57 U.K.: Market Size, By Product, 2014–2021 (USD Million)
Table 58 U.K.: Market Size, By Type, 2014–2021 (USD Million)
Table 59 U.K.: Market Size, By Functionality, 2014–2021 (USD Million)
Table 60 U.K.: Market Size, By Formulation, 2014–2021 (USD Million)
Table 61 France: Market Size, By Product, 2014–2021 (USD Million)
Table 62 France: Market Size, By Type, 2014–2021 (USD Million)
Table 63 France: Market Size, By Functionality, 2014–2021 (USD Million)
Table 64 France: Market Size, By Formulation, 2014–2021 (USD Million)
Table 65 Spain: Market Size, By Product, 2014–2021 (USD Million)
Table 66 Spain: Market Size, By Type, 2014–2021 (USD Million)
Table 67 Spain: Market Size, By Functionality, 2014–2021 (USD Million)
Table 68 Spain: Market Size, By Formulation, 2014–2021 (USD Million)
Table 69 RoE: Market Size, By Product, 2014–2021 (USD Million)
Table 70 RoE: Market Size, By Type, 2014–2021 (USD Million)
Table 71 RoE: Market Size, By Functionality, 2014–2021 (USD Million)
Table 72 RoE: Market Size, By Formulation, 2014–2021 (USD Million)
Table 73 North America: Market Size, By Country, 2014–2021 (USD Million)
Table 74 North America: Market Size, By Product, 2014–2021 (USD Million)
Table 75 North America: Market Size, By Type, 2014–2021 (USD Million)
Table 76 North America: Market Size, By Functionality, 2014–2021 (USD Million)
Table 77 North America: Market Size, By Formulation, 2014–2021 (USD Million)
Table 78 U.S.: Market Size, By Product, 2014–2021 (USD Million)
Table 79 U.S.: Market Size, By Type, 2014–2021 (USD Million)
Table 80 U.S.: Market Size, By Functionality, 2014–2021 (USD Million)
Table 81 U.S.: Market Size, By Formulation, 2014–2021 (USD Million)
Table 82 Canada: Market Size, By Product, 2014–2021 (USD Million)
Table 83 Canada: Market Size, By Type, 2014–2021 (USD Million)
Table 84 Canada: Market Size, By Functionality, 2014–2021 (USD Million)
Table 85 Canada: Market Size, By Formulation, 2014–2021 (USD Million)
Table 86 Asia-Pacific: Market Size, By Country/Region, 2014–2021 (USD Million)
Table 87 Asia-Pacific: Sugar Excipients Market Size, By Product, 2014–2021 (USD Million)
Table 88 Asia-Pacific: Sugar Excipients Market Size, By Type, 2014–2021 (USD Million)
Table 89 Asia-Pacific: Sugar Excipients Market Size, By Functionality, 2014–2021 (USD Million)
Table 90 Asia-Pacific: Sugar Excipients Market Size, By Formulation, 2014–2021 (USD Million)
Table 91 Japan: Sugar Excipients Market Size, By Product, 2014–2021 (USD Million)
Table 92 Japan: Sugar Excipients Market Size, By Type, 2014–2021 (USD Million)
Table 93 Japan: Sugar Excipients Market Size, By Functionality, 2014–2021 (USD Million)
Table 94 Japan: Sugar Excipients Market Size, By Formulation, 2014–2021 (USD Million)
Table 95 China: Sugar Excipients Market Size, By Product, 2014–2021 (USD Million)
Table 96 China: Sugar Excipients Market Size, By Type, 2014–2021 (USD Million)
Table 97 China: Sugar Excipients Market Size, By Functionality, 2012–2021 (USD Million)
Table 98 China: Sugar Excipients Market Size, By Formulation, 2014–2021 (USD Million)
Table 99 India: Sugar Excipients Market Size, By Product, 2014–2021 (USD Million)
Table 100 India: Sugar Excipients Market Size, By Type, 2014–2021 (USD Million)
Table 101 India: Sugar Excipients Market Size, By Functionality, 2014–2021 (USD Million)
Table 102 India: Sugar Excipients Market Size, By Formulation, 2014–2021 (USD Million)
Table 103 Rest of Asia-Pacific: Sugar Excipients Market Size, By Product, 2014–2021 (USD Million)
Table 104 Rest of Asia-Pacific: Sugar Excipients Market Size, By Type, 2014–2021 (USD Million)
Table 105 Rest of Asia-Pacific: Sugar Excipients Market Size, By Functionality, 2014–2021 (USD Million)
Table 106 Rest of Asia-Pacific: Sugar Excipients Market Size, By Formulation, 2014–2021 (USD Million)
Table 107 RoW: Sugar Excipients Market Size, By Region, 2014–2021 (USD Million)
Table 108 RoW: Sugar Excipients Market Size, By Product, 2014–2021 (USD Million)
Table 109 RoW: Sugar Excipients Market Size, By Type, 2014–2021 (USD Million)
Table 110 RoW: Sugar Excipients Market Size, By Functionality, 2014–2021 (USD Million)
Table 111 RoW: Sugar Excipients Market Size, By Formulation, 2014–2021 (USD Million)
Table 112 Latin America: Sugar Excipients Market Size, By Product, 2014–2021 (USD Million)
Table 113 Latin America: Sugar Excipients Market Size, By Type, 2014–2021 (USD Million)
Table 114 Latin America: Sugar Excipients Market Size, By Functionality, 2014–2012 (USD Million)
Table 115 Latin America: Sugar Excipients Market Size, By Formulation, 2014–2021 (USD Million)
Table 116 Middle East and Africa: Sugar Excipients Market Size, By Product, 2014–2021 (USD Million)
Table 117 Middle East and Africa: Sugar Excipients Market Size, By Type, 2014–2021 (USD Million)
Table 118 Middle East and Africa: Sugar Excipients Market Size, By Functionality, 2014–2021 (USD Million)
Table 119 Middle East and Africa: Sugar Excipients Market Size, By Formulation, 2014–2021 (USD Million)
Table 120 Growth Strategy Matrix, 2013–2016
Table 121 Expansions, 2013–2016
Table 122 Agreements, Alliances, and Collaborations, 2013–2016
Table 123 Mergers and Acquisitions, 2013–2016
Table 124 Product Launches, 2013–2016
Table 125 Intellectual Property Acquisitions, 2013–2016
List of Figures (34 Figures)
Figure 1 Research Design
Figure 2 Breakdown of Primary Interviews: By Company Type, Designation, and Region
Figure 3 Bottom-Up Approach
Figure 4 Top-Down Approach
Figure 5 Data Triangulation Methodology
Figure 6 Drivers, Restraints, Opportunities, Challenges, and Trends in the Global Sugar Excipients Market
Figure 7 Global Sugar Excipients Market Size, By Product, 2016 vs 2021 (USD Million)
Figure 8 Global Sugar Excipients Market Size, By Type, 2016 vs 2021 (USD Million)
Figure 9 Global Sugar Excipients Market Size, By Functionality, 2016 vs 2021 (USD Million)
Figure 10 Global Sugar Excipients Market Size, By Formulation, 2016 vs 2021 (USD Million)
Figure 11 Geographic Snapshot of the Sugar Excipients Market, 2015
Figure 12 Growth Strategy Matrix of the Top 5 Players in the Global Sugar Excipients Market(2013-2016)
Figure 13 Increasing Use of Co-Processed Excipients and Growth of the Generics Market to Drive Market Growth During the Forecast Period
Figure 14 Oral Formulations Segment Commanded the Largest Share of the APAC Sugar Excipients Market in 2015
Figure 15 The U.S. Dominated the Global Sugar Excipients Market in 2015
Figure 16 APAC to Witness the Highest Growth Rate During the Forecast Period
Figure 17 China to Register the Highest Growth During the Forecast Period
Figure 18 Sugar Excipients Market: Drivers, Restraints, Opportunities, and Challenges
Figure 19 New International CGMP & CGDP Certifications for Excipients in North America and Europe is the Key Industry Trend in the Sugar Excipients Market
Figure 20 IPEC Total Excipient Control Process
Figure 21 Geographic Snapshot of the Sugar Excipients Market (2016-2021)
Figure 22 Europe: Sugar Excipients Market Snapshot
Figure 23 U.S.: Pharmaceutical R&D Expenditure (1990–2014)
Figure 24 Asia-Pacific Sugar Excipients Market Snapshot
Figure 25 Expansions–Key Growth Strategy Pursued By Market Players Between 2013 and 2016
Figure 26 Global Sugar Excipients Market Share, By Key Player, 2015
Figure 27 Battle for Market Share: Expansion Was the Key Strategy
Figure 28 Geographic Revenue Mix of Top 4 Players
Figure 29 Ashland Inc.: Company Snapshot
Figure 30 Archer Daniels Midland Company: Company Snapshot
Figure 31 BASF SE: Company Snapshot
Figure 32 Associated British Foods PLC: Company Snapshot
Figure 33 Cargill, Inc.: Company Snapshot
Figure 34 FMC Corporation: Company Snapshot

 Generating Response ...


Growth opportunities and latent adjacency in Sugar-Based Excipients Market