Sweeteners Market

Sweeteners Market by Product (Sucrose, High-fructose Corn Syrup, Natural Sweeteners, Artificial Sweeteners, Novel Sweeteners, and Polyols), Sales Channel (Direct and Indirect), Type, Form, Application and Region - Global Forecast to 2028

Report Code: FB 8903 Jan, 2024, by marketsandmarkets.com

[429 Pages Report] The global sweeteners market is projected to reach USD 125.1 billion by 2028 from USD 107.2 billion in 2023 at a CAGR of 3.1% during the forecast period, 2023-2028, in terms of value. The sweeteners market is experiencing growth, extending its influence beyond the food and beverage sector into the personal care and pharmaceutical industries. In personal care, sweeteners serve as ingredients in oral care products, chewing gums, and cosmetics, providing a sweet taste without the detrimental effects of sugar. For instance, xylitol, a sugar alcohol sweetener, is widely used in oral care products due to its ability to inhibit bacterial growth and promote dental health.

In the pharmaceutical industry, sweeteners are utilized to enhance the palatability of medications, especially those in liquid or chewable forms. Paediatric medications often incorporate sweeteners to improve taste and increase patient compliance. Sucralose, aspartame, and saccharin are some of the examples of sweeteners employed in pharmaceutical formulations. The growing recognition of the role sweeteners play in enhancing consumer experience and compliance in personal care and pharmaceutical products is a key driver in the expanding sweeteners market.

Sweeteners Market

To know about the assumptions considered for the study, Request for Free Sample Report

Sweeteners Market Opportunities

To know about the assumptions considered for the study, download the pdf brochure

Market Dynamics

Drivers:Rise in consumer inclination toward natural products

With the growing awareness of wellness, consumers are increasingly demanding greater transparency in the products they purchase. As a result, they want to know where their products come from and what ingredients are used. These lifestyle changes are having a major impact on the food and beverage industry as well as the personal care industry. Consumers are demanding non-GMO, organic, natural, and additive-free products. Furthermore, many are willing to pay a premium for natural products that are associated with health and nutrition. This growing trend of consumers being willing to pay higher prices for natural products is driving the demand for natural sweeteners.

Restraints: Health issues linked to excessive consumption of high-fructose corn syrup

High-fructose corn syrup (HFCS) has indeed encountered significant negative public perception, primarily due to its alleged association with health issues such as obesity and diabetes. HFCS introduces an unnatural and excessive amount of fructose to the diet, contributing to various health issues as the body metabolizes fructose differently than glucose. The high fructose content in HFCS has been linked to increased liver fat, potentially leading to fatty liver disease and type 2 diabetes. Long-term studies indicate a strong association between HFCS, obesity, and weight gain, with fructose promoting the accumulation of visceral fat, the most harmful type of body fat linked to diabetes and heart disease.

Opportunities: Research and development for diabetic-friendly sweeteners

The escalating global burden of diabetes, according to the International Diabetic Federation Atlas (2021), reporting 10.5% of adults (20–79 years) living with the condition and projecting a 46% increase to 783 million individuals by 2045, underscores a significant opportunity for the sweeteners market. Over 90% of those affected have type 2 diabetes, driven by urbanization, an aging population, declining physical activity, and rising overweight and obesity rates.

The prevalence of diabetes has increased substantially, leading to a growing demand for sweeteners that are safe for people with diabetes. Consumers are now more aware of the health impact of their diet, leading to research and development initiatives focused on creating sweeteners that have better taste profiles and minimal impact on blood sugar levels. The potential for these sweeteners is further amplified by regulatory support and the increasing consumer preference for healthier options. Companies that invest in and market diabetic-friendly sweeteners not only cater to a specific demographic but also contribute to product diversification, global market expansion, and potential collaborations within the food and beverage industry. In essence, the rise of diabetes presents a strategic opportunity for the sweeteners market to become a key driver of growth and differentiation.

Challenges: Product labeling and claims issues

International regulatory bodies are introducing more stringent regulations for food safety and quality. In addition to food testing and certification, these bodies are enforcing food labeling rules and regulations for manufacturers. Many governments worldwide are taking initiatives to implement food labeling laws within their respective countries.

Market Ecosystem

Top Companies in Sweeteners Market

Based on type, the high-intensity sweeteners segment is estimated to hold the largest market share during the forecast period of the sweeteners market.

High-intensity sweeteners claim the largest share in the sweeteners market due to their exceptional sweetness potency, offering a sweet taste without the associated caloric content. As consumers increasingly prioritize healthier lifestyles and seek alternatives to traditional sugars, high-intensity sweeteners, such as aspartame, sucralose, and steviol glycosides (from stevia), have gained widespread popularity. The ability of these sweeteners to provide sweetness at levels significantly higher than sucrose enables their usage in minimal quantities, appealing to those aiming to reduce calorie intake.

Moreover, high-intensity sweeteners address the growing prevalence of obesity and related health concerns, aligning with the global trend towards healthier dietary choices. Their versatility in various applications, including beverages, confectionery, and processed foods, further cements their market dominance. With ongoing innovations, research, and increasing consumer acceptance, high-intensity sweeteners are positioned as key contributors to the sweeteners market, meeting the demand for sweetness without compromising on health and wellness goals.

North America Is Projected To Be The Fastest-Growing Region In The  Sweeteners Market. 

North America is growing at a significant rate in the sweeteners market due to a confluence of factors driving demand and consumption patterns. The region's high prevalence of health-conscious consumers and their increasing awareness of the adverse effects of traditional sugars on health contribute significantly to the demand for sweeteners. With a robust food and beverage industry, North America is quick to adopt innovations in low-calorie and sugar-free alternatives, propelling the growth of the sweeteners market.

Moreover, stringent regulatory measures promoting healthier dietary choices and clearer labeling practices align with consumer preferences, further supporting the growth of the sweeteners market in North America. Canada, as part of North America, has implemented a thorough safety assessment process before approving new food additives, including sugar substitutes. This meticulous approach guarantees that only proven and safe sweeteners, such as acesulfame-potassium, polydextrose, sucralose, thaumatin, and various sugar alcohols, are permitted for use.

The diversity of approved sugar substitutes reflects North America's commitment to offering consumers a broad spectrum of sweetening options. Additionally, the prevalence of health-conscious consumers seeking alternatives to traditional sugars, driven by concerns about obesity and related health issues, further propels the demand for approved and safe sugar substitutes in the North American sweeteners market. This combination of regulatory rigor, consumer awareness, and a diverse range of approved sweeteners solidifies North America's growth in the global sweeteners industry.

North American Sweeteners Market Size, and Share

Key Market Players

The key players in this market include Cargill, Incorporated (US), ADM (US), International Flavors & Fragrances Inc. (US), Ingredion Incorporated (US), Tate & Lyle (UK), Associated British Foods (UK), Südzucker AG (Germany), and Ajinomoto Co., Inc. (Japan).

Get online access to the report on the World's First Market Intelligence Cloud

  • Easy to Download Historical Data & Forecast Numbers
  • Company Analysis Dashboard for high growth potential opportunities
  • Research Analyst Access for customization & queries
  • Competitor Analysis with Interactive dashboard
  • Latest News, Updates & Trend analysis
Request Sample

Scope of the Report

Report Metric

Details

Market size estimation

2023–2028

Base year considered

2022

Forecast period considered

2023–2028

Units considered

Value (USD Million), Volume (KT)

Segments Covered

By Type, Product, Form, Sales Channel, Application, and Region

Regions covered

North America, Europe, Asia Pacific, Latin America, and Middle East and Africa

Companies studied

  • Cargill, Incorporated (US)
  • ADM (US)
  • International Flavors & Fragrances Inc. (US)
  • Ingredion Incorporated (US)
  • Tate & Lyle (UK)
  • Associated British Foods PLC (UK)
  • Givaudan (Switzerland)
  • Firmenich SA (Switzerland)
  • Symrise (Germany)
  • Südzucker AG (Germany)
  • Ajinomoto Co., Inc. (Japan)
  • Zydus Wellness (India)
  • Tereos (France)
  • Roquette Frères (France)
  • MacAndrews & Forbes Holdings Incorporated (US)
  • Foodchem International Corporation (China)
  • JK Sucralose Inc.(China)
  • zuChem (US)
  • Mane SA (France)
  • Döhler GmbH (Germany)
  • Ecogreen Oleochemicals (Singapore)
  • Suminter India Organics (India)
  • Tag Ingredients India Pvt Ltd (India)
  • The Real Stevia Company AB (Sweden)
  • Sweetly SteviaUSA  (US)
  • Stevia Hub India (India)
  • Pyure Brands (US)
  • XILINAT (Mexico)
  • Fooditive Group (Netherlands)
  • SAGANA (Switzerland)

This research report categorizes the sweeteners market based on type, product, form, sales channel, application, and region

Target Audience

  • Sweeteners producers, suppliers, distributors, importers, and exporters
  • Related government authorities, commercial research & development (R&D) institutions, FDA, EFSA, USDA, FSANZ, government agencies, and other regulatory bodies
  • Consumers
  • Commercial research & development (R&D) institutions and financial institutions

Sweeteners Market:

By Product
  • Sucrose
  • High-Fructose Corn Syrup
  • Natural Sweeteners
    • Stevia
    • Monk Fruit Sugar
    • Palm Sugar
    • Coconut Sugar
    • Honey
    • Maple Syrup
    • Agave Syrup
    • Lucuma Fruit Sugar
    • Molasses
    • Other Natural Sweeteners (yacon syrup, date sugar, sorghum syrup, thaumatin, pentadin, and jaggery)
  • Artificial Sweeteners
    • Aspartame
    • Sucralose
    • Saccharin
    • Cyclamate
    • Ace-K
    • Other Artificial Sweeteners (Neotame and Advantame)
  • Novel Sweeteners
    • Allulose
    • D-Tagatose
  • Polyols
    • Sorbitol
    • Maltitol
    • Xylitol
    • Erythritol
    • Mannitol
    • Other Polyols (isomalt, starch hydrolysates, lactitol, and trehalose)
By Type
  • High-intensity Sweeteners
    • Natural
    • Artificial
  • Low-intensity Sweeteners
By Form
  • Liquid
  • Powder
  • Crystals
By Application
  • Food
    • Confectionery Products
    • Bakery Products
    • Dairy Products
    • Sweet Spreads
    • Plant-based Foods
    • Other Food Products
  • Beverages
    • Carbonated Drinks
    • Fruit Drinks and Juices
    • Powdered Drinks
    • Alcoholic Beverages
    • Flavored Alcoholic Beverages
    • Plant-Based Beverages
    • Other Beverages
  • Personal Care
  • Pharmaceuticals
  • Other applications
By Sales channel:
  • Direct
  • Indirect
    • Hypermarkets/Supermarkets
    • Specialty Retail Sotres
    • Online Retailers
    • Convenience Stores
    • Other Channels
By Region:
  • North America
  • Europe
  • Asia Pacific
  • Latin America
  • Middle East & Africa

Recent Developments

  • In March 2023, Tate & Lyle (UK) partnered with IMCD (Belgium) in Brazil, enhancing its distribution of sweeteners, fibers, starches, and stabilizing solutions. This expansion strengthened Tate & Lyle’s (UK) presence and accessibility in the Brazilian sweeteners market, fostering growth and market reach.
  • In August 2022, International Flavors & Fragrances Inc. (US) opened its new Nourish Innovation Lab in New Jersey, US, specifically for R&D in food & beverage market. This would help the company launch new products in various categories including sweeteners.
  • In March 2021, Cargill, Incorporated (US) and DSM (Netherlands) underwent a joint venture called Avansya for commercial-scale production of EverSweet stevia sugar substitutes. This assisted in catering to the growing demand for reduced-calorie food and beverages.

Frequently Asked Questions (FAQ):

To speak to our analyst for a discussion on the above findings, click Speak to Analyst

TABLE OF CONTENTS
 
1 INTRODUCTION (Page No. - 48)
    1.1 STUDY OBJECTIVES 
    1.2 MARKET DEFINITION 
    1.3 STUDY SCOPE 
           1.3.1 MARKET SEGMENTATION
           1.3.2 REGIONS COVERED
           1.3.3 INCLUSIONS & EXCLUSIONS
    1.4 YEARS CONSIDERED 
    1.5 CURRENCY/VALUE CONSIDERED 
           TABLE 1 USD EXCHANGE RATES, 2019–2022
    1.6 VOLUME UNIT CONSIDERED 
    1.7 STAKEHOLDERS 
    1.8 IMPACT OF RECESSION 
 
2 RESEARCH METHODOLOGY (Page No. - 54)
    2.1 RESEARCH DATA 
           FIGURE 1 SWEETENERS MARKET: RESEARCH DESIGN
           2.1.1 SECONDARY DATA
                    2.1.1.1 Key data from secondary sources
           2.1.2 PRIMARY DATA
                    2.1.2.1 Key data from primary sources
                    2.1.2.2 Breakdown of primary profiles
                               FIGURE 2 BREAKDOWN OF PRIMARY INTERVIEWS: BY COMPANY TYPE,  DESIGNATION, AND REGION
                    2.1.2.3 Key insights from industry experts
    2.2 MARKET SIZE ESTIMATION 
           2.2.1 BOTTOM-UP APPROACH (DEMAND SIDE)
                    FIGURE 3 MARKET SIZE ESTIMATION METHODOLOGY: BOTTOM-UP APPROACH
           2.2.2 TOP-DOWN APPROACH
                    FIGURE 4 MARKET SIZE ESTIMATION METHODOLOGY: TOP-DOWN APPROACH
           2.2.3 SUPPLY SIDE ANALYSIS
                    FIGURE 5 SWEETENERS MARKET SIZE CALCULATION: SUPPLY SIDE
    2.3 DATA TRIANGULATION AND MARKET BREAKUP 
           FIGURE 6 DATA TRIANGULATION
    2.4 RESEARCH ASSUMPTIONS 
    2.5 LIMITATIONS AND RISK ASSESSMENT 
    2.6 RECESSION IMPACT ANALYSIS 
           2.6.1 MACRO-INDICATORS OF RECESSION
                    FIGURE 7 SWEETENERS MARKET: MAJOR INDICATORS OF RECESSION
                    FIGURE 8 GLOBAL INFLATION RATE, 2011–2021
                    FIGURE 9 GLOBAL GROSS DOMESTIC PRODUCT, 2011–2021 (USD TRILLION)
                    FIGURE 10 RECESSION INDICATORS AND THEIR IMPACT ON SWEETENERS MARKET
                    FIGURE 11 GLOBAL SWEETENERS MARKET: EARLIER FORECAST VS. RECESSION FORECAST
 
3 EXECUTIVE SUMMARY (Page No. - 69)
    TABLE 2 SWEETENERS MARKET SNAPSHOT, 2023 VS. 2028 
    FIGURE 12 SWEETENERS MARKET, BY PRODUCT, 2023 VS. 2028 (USD MILLION) 
    FIGURE 13 SWEETENERS MARKET, BY TYPE, 2023 VS. 2028 (USD MILLION) 
    FIGURE 14 SWEETENERS MARKET, BY FORM, 2023 VS. 2028 (USD MILLION) 
    FIGURE 15 SWEETENERS MARKET, BY SALES CHANNEL, 2023 VS. 2028 (USD MILLION) 
    FIGURE 16 SWEETENERS MARKET, BY APPLICATION, 2023 VS. 2028 (USD MILLION) 
    FIGURE 17 SWEETENERS MARKET SHARE (VALUE), BY REGION, 2022 
 
4 PREMIUM INSIGHTS (Page No. - 74)
    4.1 ATTRACTIVE OPPORTUNITIES FOR PLAYERS IN SWEETENERS MARKET 
           FIGURE 18 INCREASED DEMAND DRIVEN BY CONSUMER PREFERENCE FOR HEALTHIER OPTIONS AND ONGOING INNOVATIONS IN FORMULATIONS TO DRIVE MARKET
    4.2 SWEETENERS MARKET: MAJOR REGIONAL SUBMARKETS 
           FIGURE 19 US AND INDIA TO BE LUCRATIVE MARKETS IN 2023
    4.3 ASIA PACIFIC: SWEETENERS MARKET, BY KEY COUNTRY  AND PRODUCT 
           FIGURE 20 SUCROSE SEGMENT AND INDIA TO ACCOUNT FOR SIGNIFICANT SHARE IN 2022
    4.4 SWEETENERS MARKET, BY PRODUCT 
           FIGURE 21 SUCROSE SEGMENT TO DOMINATE MARKET DURING FORECAST PERIOD
    4.5 SWEETENERS MARKET, BY TYPE 
           FIGURE 22 HIGH-INTENSITY SWEETENERS SEGMENT TO DOMINATE MARKET DURING FORECAST PERIOD
    4.6 SWEETENERS MARKET, BY FORM 
           FIGURE 23 POWDER SEGMENT TO DOMINATE MARKET DURING FORECAST PERIOD
    4.7 SWEETENERS MARKET, BY SALES CHANNEL 
           FIGURE 24 DIRECT (B2B) SEGMENT TO DOMINATE MARKET DURING FORECAST PERIOD
    4.8 SWEETENERS MARKET, BY APPLICATION 
           FIGURE 25 BEVERAGES SEGMENT TO DOMINATE MARKET DURING FORECAST PERIOD
 
5 MARKET OVERVIEW (Page No. - 79)
    5.1 INTRODUCTION 
    5.2 MACROECONOMIC INDICATORS 
           5.2.1 FLUCTUATIONS IN PRICES AND SUPPLY OF CONVENTIONAL SUGAR TO DRIVE DEMAND FOR SWEETENERS
                    FIGURE 26 FRP OF SUGARCANE PAYABLE BY SUGAR FACTORIES IN INDIA,  2010–2023 (INR/QUINTAL)
           5.2.2 RISING APPETITE FOR SWEETENERS WITH GLOBAL INCREASE IN POPULATION AND GDP
                    FIGURE 27 GLOBAL POPULATION GROWTH, 1950–2050 (BILLION)
                    FIGURE 28 GDP GROWTH, 2016–2022 (TRILLION)
    5.3 MARKET DYNAMICS 
           FIGURE 29 MARKET DYNAMICS
           5.3.1 DRIVERS
                    5.3.1.1 Growing awareness regarding health issues related to high sugar consumption
                    5.3.1.2 Rise in consumer inclination toward natural products
                    5.3.1.3 Partnerships established between sweetener manufacturers and food & beverage entities
                    5.3.1.4 Advances in technology leading to development of new and improved sweeteners
                    5.3.1.5 Reduced ingredient costs through HFCS usage
           5.3.2 RESTRAINTS
                    5.3.2.1 Consumer confusion around usage of natural sweeteners and their potential health risks
                    5.3.2.2 Health issues linked to excessive consumption of high-fructose corn syrup
                    5.3.2.3 Stringent international quality standards and regulations for sweeteners and sweetener-based products
           5.3.3 OPPORTUNITIES
                    5.3.3.1 Advancements in natural sweeteners gaining significant traction, especially in food & beverage industry
                    5.3.3.2 Research and development around diabetic-friendly sweeteners
           5.3.4 CHALLENGES
                    5.3.4.1 Product labeling and claims issues
                               TABLE 3 CANADIAN FOOD LABELING REGULATIONS
                    5.3.4.2 Balancing production costs and pricing of sweeteners to meet consumer expectations
    5.4 FLAVOR MODULATION 
           5.4.1 INTRODUCTION
           5.4.2 KEY TRENDS
                    5.4.2.1 Natural and clean-label flavors
                    5.4.2.2 Comfort food flavors
                    5.4.2.3 Global taste expansions
           5.4.3 IMPACT OF FLAVOR MODULATIONS ON SWEETENERS MARKET
                    5.4.3.1 Increased demand for natural sweeteners
                               FIGURE 30 VALUE OF HONEY PRODUCTION, 2019–2022 (THOUSAND DOLLARS)
                    5.4.3.2 Innovation in non-caloric sweeteners
 
6 INDUSTRY TRENDS (Page No. - 93)
    6.1 INTRODUCTION 
    6.2 SUPPLY CHAIN ANALYSIS 
           FIGURE 31 SWEETENERS MARKET: SUPPLY CHAIN ANALYSIS
    6.3 VALUE CHAIN ANALYSIS 
           FIGURE 32 SWEETENERS MARKET: VALUE CHAIN ANALYSIS
           6.3.1 RESEARCH & DEVELOPMENT
           6.3.2 RAW MATERIAL SOURCING
           6.3.3 PROCESSING & PRODUCTION
           6.3.4 DISTRIBUTION & LOGISTICS
           6.3.5 INCORPORATION OF SWEETENERS INTO PRODUCTS
           6.3.6 MARKETING & SALES
    6.4 TRADE ANALYSIS 
           TABLE 4 IMPORT VALUE OF SUCROSE FOR KEY COUNTRIES, 2022 (USD THOUSAND)
           TABLE 5 EXPORT VALUE OF SUCROSE FOR KEY COUNTRIES, 2022 (USD THOUSAND)
           TABLE 6 IMPORT VALUE OF FOOD PREPARATIONS CLOSEST TO HIGH-INTENSITY SWEETENERS FOR KEY COUNTRIES, 2022 (USD THOUSAND)
           TABLE 7 EXPORT VALUE OF FOOD PREPARATIONS CLOSEST TO HIGH-INTENSITY SWEETENERS FOR KEY COUNTRIES, 2022 (USD THOUSAND)
    6.5 TECHNOLOGY ANALYSIS 
           6.5.1 LIQUID-LIQUID EXTRACTION
           6.5.2 HPLC-DAD
    6.6 PRICING ANALYSIS 
           6.6.1 INDICATIVE AVERAGE SELLING PRICE TREND OF KEY PLAYERS,  BY PRODUCT
                    TABLE 8 AVERAGE SELLING PRICE TREND OF KEY PLAYERS, BY PRODUCT, 2022
           6.6.2 AVERAGE SELLING PRICE TREND, BY REGION
                    TABLE 9 AVERAGE SELLING PRICE TREND, BY REGION, 2019–2023 (USD/TON)
           6.6.3 AVERAGE SELLING PRICE TREND, BY PRODUCT
                    TABLE 10 AVERAGE SELLING PRICE TREND, BY PRODUCT, 2019–2023 (USD/TON)
    6.7 ECOSYSTEM/MARKET MAP 
           6.7.1 DEMAND SIDE
           6.7.2 SUPPLY SIDE
                    FIGURE 33 SWEETENERS MARKET: MARKET MAP
                    TABLE 11 ROLE OF PLAYERS IN MARKET ECOSYSTEM
    6.8 TRENDS/DISRUPTIONS IMPACTING CUSTOMERS’ BUSINESSES 
           FIGURE 34 TRENDS/DISRUPTIONS IMPACTING CUSTOMERS’ BUSINESSES
    6.9 PATENT ANALYSIS 
           TABLE 12 LIST OF MAJOR PATENTS PERTAINING TO SWEETENERS MARKET, 2013–2023
           FIGURE 35 NUMBER OF PATENTS GRANTED, 2013–2023
           FIGURE 36 REGIONAL ANALYSIS OF PATENTS GRANTED
    6.10 KEY CONFERENCES & EVENTS 
           TABLE 13 KEY CONFERENCES & EVENTS, 2023–2024
    6.11 TARIFF AND REGULATORY LANDSCAPE 
           6.11.1 REGULATORY BODIES, GOVERNMENT AGENCIES, AND OTHER ORGANIZATIONS
                    TABLE 14 LIST OF REGULATORY BODIES, GOVERNMENT AGENCIES, AND OTHER ORGANIZATIONS
           6.11.2 REGULATORY FRAMEWORK
                    6.11.2.1 North America
                               6.11.2.1.1 US
                               6.11.2.1.2 Canada
                    6.11.2.2 Europe
                    6.11.2.3 Asia Pacific
                               6.11.2.3.1 China
                               6.11.2.3.2 India
                               6.11.2.3.3 Japan
                               6.11.2.3.4 Australia & New Zealand
                    6.11.2.4 Latin America
                               6.11.2.4.1 Brazil
                               6.11.2.4.2 Argentina
                               6.11.2.4.3 Mexico
                    6.11.2.5 Middle East & Africa
    6.12 PORTER’S FIVE FORCES ANALYSIS 
                    TABLE 15 IMPACT OF PORTER’S FIVE FORCES ON SWEETENERS MARKET
           6.12.1 INTENSITY OF COMPETITIVE RIVALRY
           6.12.2 BARGAINING POWER OF SUPPLIERS
           6.12.3 BARGAINING POWER OF BUYERS
           6.12.4 THREAT OF SUBSTITUTES
           6.12.5 THREAT OF NEW ENTRANTS
    6.13 KEY STAKEHOLDERS AND BUYING CRITERIA 
           6.13.1 KEY STAKEHOLDERS IN BUYING PROCESS
                    FIGURE 37 INFLUENCE OF STAKEHOLDERS ON BUYING PROCESS FOR KEY APPLICATIONS
                    TABLE 16 INFLUENCE OF STAKEHOLDERS ON BUYING PROCESS FOR KEY APPLICATIONS
           6.13.2 BUYING CRITERIA
                    TABLE 17 KEY CRITERIA FOR SELECTING SUPPLIERS/VENDORS
                    FIGURE 38 KEY CRITERIA FOR SELECTING SUPPLIERS/VENDORS
    6.14 CASE STUDY ANALYSIS 
           6.14.1 INCREASE IN INITIATIVES FOR SUGAR REDUCTION
 
7 SWEETENERS MARKET, BY APPLICATION (Page No. - 131)
    7.1 INTRODUCTION 
           FIGURE 39 SWEETENERS MARKET, BY APPLICATION, 2023 VS. 2028 (USD MILLION)
           TABLE 18 SWEETENERS MARKET, BY APPLICATION, 2019–2022 (USD MILLION)
           TABLE 19 SWEETENERS MARKET, BY APPLICATION, 2023–2028 (USD MILLION)
    7.2 FOOD 
           TABLE 20 FOOD: SWEETENERS MARKET, BY SUBAPPLICATION, 2019–2022 (USD MILLION)
           TABLE 21 FOOD: SWEETENERS MARKET, BY SUBAPPLICATION, 2023–2028 (USD MILLION)
           TABLE 22 FOOD: SWEETENERS MARKET, BY REGION, 2019–2022 (USD MILLION)
           TABLE 23 FOOD: SWEETENERS MARKET, BY REGION, 2023–2028 (USD MILLION)
           7.2.1 CONFECTIONERY PRODUCTS
                    7.2.1.1 Soaring demand for sweeteners as caramelizing agents in confectionery industry to drive market
           7.2.2 BAKERY PRODUCTS
                    7.2.2.1 Increased demand for sugar-free baked items to drive market
           7.2.3 DAIRY PRODUCTS
                    7.2.3.1 Demand for low-sugar, vegan dairy products to drive market
           7.2.4 SWEET SPREADS
                    7.2.4.1 Surging demand for healthy sweet spreads to drive market growth
           7.2.5 PLANT-BASED FOODS
                    7.2.5.1 Surge in demand for flavorful, plant-based foods to enhance application of sweeteners
           7.2.6 OTHER FOOD PRODUCTS
    7.3 BEVERAGES 
           TABLE 24 BEVERAGES: SWEETENERS MARKET, BY SUBAPPLICATION, 2019–2022 (USD MILLION)
           TABLE 25 BEVERAGES: SWEETENERS MARKET, BY SUBAPPLICATION, 2023–2028 (USD MILLION)
           TABLE 26 BEVERAGES: SWEETENERS MARKET, BY REGION, 2019–2022 (USD MILLION)
           TABLE 27 BEVERAGES: SWEETENERS MARKET, BY REGION, 2023–2028 (USD MILLION)
           7.3.1 CARBONATED DRINKS
                    7.3.1.1 Need for innovative sweetener formulations in carbonated drinks to boost their popularity
           7.3.2 FRUIT DRINKS & JUICES
                    7.3.2.1 Demand for strategic and innovative sweeteners in fruit drinks and juices to catalyze market expansion
           7.3.3 POWDERED DRINKS
                    7.3.3.1 Demand for use of diverse sweeteners in powdered drinks to contribute to market growth
           7.3.4 ALCOHOLIC BEVERAGES
                    7.3.4.1 Changing consumer preferences and quest for innovative flavor profiles to boost market
           7.3.5 FLAVORED ALCOHOLIC BEVERAGES
                    7.3.5.1 Demand for refreshing fusion of real fruit juices and alcohol derived from cane sugar to propel growth
           7.3.6 PLANT-BASED BEVERAGES
                    7.3.6.1 Surge in consumption of natural, plant-based beverages to drive use of sweeteners
           7.3.7 OTHER BEVERAGES
    7.4 PERSONAL CARE 
           7.4.1 NATURAL SWEETENERS IMPROVE HEALTH-ENHANCING FEATURES OF PERSONAL PRODUCTS
                    TABLE 28 PERSONAL CARE: SWEETENERS MARKET, BY REGION, 2019–2022 (USD MILLION)
                    TABLE 29 PERSONAL CARE: SWEETENERS MARKET, BY REGION, 2023–2028 (USD MILLION)
    7.5 PHARMACEUTICALS 
           7.5.1 INVESTMENTS IN INNOVATIVE FORMULATIONS TO DRIVE GLOBAL ADOPTION OF SWEETENERS IN PHARMACEUTICALS
                    TABLE 30 PHARMACEUTICALS: SWEETENERS MARKET, BY REGION, 2019–2022 (USD MILLION)
                    TABLE 31 PHARMACEUTICALS: SWEETENERS MARKET, BY REGION, 2023–2028 (USD MILLION)
    7.6 OTHER APPLICATIONS 
                    TABLE 32 OTHER APPLICATIONS: SWEETENERS MARKET, BY REGION, 2019–2022 (USD MILLION)
                    TABLE 33 OTHER APPLICATIONS: SWEETENERS MARKET, BY REGION, 2023–2028 (USD MILLION)
 
8 SWEETENERS MARKET, BY PRODUCT (Page No. - 147)
    8.1 INTRODUCTION 
           FIGURE 40 SUCROSE SEGMENT TO DOMINATE MARKET BY 2028
           TABLE 34 SWEETENERS MARKET, BY PRODUCT, 2019–2022 (USD MILLION)
           TABLE 35 SWEETENERS MARKET, BY PRODUCT, 2023–2028 (USD MILLION)
           TABLE 36 SWEETENERS MARKET, BY PRODUCT, 2019–2022 (KT)
           TABLE 37 SWEETENERS MARKET, BY PRODUCT, 2023–2028 (KT)
    8.2 SUCROSE 
           8.2.1 INCREASING DEMAND FOR PROCESSED AND CONVENIENCE FOOD PRODUCTS TO DRIVE MARKET
                    TABLE 38 SUCROSE: SWEETENERS MARKET, BY REGION, 2019–2022 (USD MILLION)
                    TABLE 39 SUCROSE: SWEETENERS MARKET, BY REGION, 2023–2028 (USD MILLION)
                    TABLE 40 SUCROSE: SWEETENERS MARKET, BY REGION, 2019–2022 (KT)
                    TABLE 41 SUCROSE: SWEETENERS MARKET, BY REGION, 2023–2028 (KT)
    8.3 HIGH-FRUCTOSE CORN SYRUP 
           8.3.1 BLENDING PROPERTIES, COST-EFFECTIVENESS, AND INCREASED SHELF-LIFE OF HFCS TO PROPEL ITS GROWTH
                    TABLE 42 HIGH-FRUCTOSE CORN SYRUP: SWEETENERS MARKET, BY REGION,  2019–2022 (USD MILLION)
                    TABLE 43 HIGH-FRUCTOSE CORN SYRUP: SWEETENERS MARKET, BY REGION,  2023–2028 (USD MILLION)
                    TABLE 44 HIGH-FRUCTOSE CORN SYRUP: SWEETENERS MARKET, BY REGION, 2019–2022 (KT)
                    TABLE 45 HIGH-FRUCTOSE CORN SYRUP: SWEETENERS MARKET, BY REGION, 2023–2028 (KT)
    8.4 NATURAL SWEETENERS 
           TABLE 46 NATURAL: SWEETENERS MARKET, BY SUBTYPE, 2019–2022 (USD MILLION)
           TABLE 47 NATURAL: SWEETENERS MARKET, BY SUBTYPE, 2023–2028 (USD MILLION)
           TABLE 48 NATURAL: SWEETENERS MARKET, BY REGION, 2019–2022 (USD MILLION)
           TABLE 49 NATURAL: SWEETENERS MARKET, BY REGION, 2023–2028 (USD MILLION)
           TABLE 50 NATURAL: SWEETENERS MARKET, BY REGION, 2019–2022 (KT)
           TABLE 51 NATURAL: SWEETENERS MARKET, BY REGION, 2023–2028 (KT)
           8.4.1 STEVIA
                    8.4.1.1 Growing health-conscious consumer preferences to spur demand for stevia
           8.4.2 MONK FRUIT SUGAR
                    8.4.2.1 Rising demand for natural, non-nutritive sweeteners to drive market
           8.4.3 PALM SUGAR
                    8.4.3.1 Wide range of culinary applications of palm sugar to drive market
           8.4.4 COCONUT SUGAR
                    8.4.4.1 Diverse nutritional properties of coconut sugar to drive its consumption
           8.4.5 HONEY
                    8.4.5.1 Surging demand for artisanal honey varieties to drive market
           8.4.6 MAPLE SYRUP
                    8.4.6.1 Organic and sustainable nature of maple syrup to drive growth
           8.4.7 AGAVE SYRUP
                    8.4.7.1 Rising demand for low-glycemic sweeteners to drive market
           8.4.8 LUCUMA FRUIT SUGAR
                    8.4.8.1 Distinctive flavor and nutritional benefits of lucuma fruit sugar to encourage market growth
           8.4.9 MOLASSES
                    8.4.9.1 Unique taste profile of molasses to spur their consumption
           8.4.10 OTHER NATURAL SWEETENERS
    8.5 ARTIFICIAL SWEETENERS 
           TABLE 52 ARTIFICIAL: SWEETENERS MARKET, BY SUBTYPE, 2019–2022 (USD MILLION)
           TABLE 53 ARTIFICIAL: SWEETENERS MARKET, BY SUBTYPE, 2023–2028 (USD MILLION)
           TABLE 54 ARTIFICIAL: SWEETENERS MARKET, BY REGION, 2019–2022 (USD MILLION)
           TABLE 55 ARTIFICIAL: SWEETENERS MARKET, BY REGION, 2023–2028 (USD MILLION)
           TABLE 56 ARTIFICIAL: SWEETENERS MARKET, BY REGION, 2019–2022 (KT)
           TABLE 57 ARTIFICIAL: SWEETENERS MARKET, BY REGION, 2023–2028 (KT)
           8.5.1 ASPARTAME
                    8.5.1.1 Diverse application of aspartame in food and beverages to drive market growth
           8.5.2 SUCRALOSE
                    8.5.2.1 Stability, taste, and safety of sucralose to boost its demand and consumption
           8.5.3 SACCHARIN
                    8.5.3.1 Increasing use of saccharin in health and wellness products to propel demand
           8.5.4 CYCLAMATE
                    8.5.4.1 Heat stability and prolonged shelf life of cyclamate to propel market expansion
           8.5.5 ACE-K
                    8.5.5.1 Acesulfame K’s resilience and safety to boost market expansion amidst health-conscious trends
           8.5.6 OTHER ARTIFICIAL SWEETENERS
    8.6 NOVEL SWEETENERS 
           TABLE 58 NOVEL SWEETENERS MARKET, BY TYPE, 2019–2022 (USD MILLION)
           TABLE 59 NOVEL SWEETENERS MARKET, BY TYPE, 2023–2028 (USD MILLION)
           TABLE 60 NOVEL SWEETENERS MARKET, BY REGION, 2019–2022 (USD MILLION)
           TABLE 61 NOVEL SWEETENERS MARKET, BY REGION, 2023–2028 (USD MILLION)
           TABLE 62 NOVEL SWEETENERS MARKET, BY REGION, 2019–2022 (KT)
           TABLE 63 NOVEL SWEETENERS MARKET, BY REGION, 2023–2028 (KT)
           8.6.1 ALLULOSE
                    8.6.1.1 Global acceptance of allulose to drive market demand
           8.6.2 D-TAGATOSE
                    8.6.2.1 Versatility of d-tagatose in meeting evolving dietary preferences of consumers to boost growth
    8.7 POLYOLS 
           TABLE 64 POLYOLS: SWEETENERS MARKET, BY SUBTYPE, 2019–2022 (USD MILLION)
           TABLE 65 POLYOLS: SWEETENERS MARKET, BY SUBTYPE, 2023–2028 (USD MILLION)
           TABLE 66 POLYOLS: SWEETENERS MARKET, BY REGION, 2019–2022 (USD MILLION)
           TABLE 67 POLYOLS: SWEETENERS MARKET, BY REGION, 2023–2028 (USD MILLION)
           TABLE 68 POLYOLS: SWEETENERS MARKET, BY REGION, 2019–2022 (KT)
           TABLE 69 POLYOLS: SWEETENERS MARKET, BY REGION, 2023–2028 (KT)
           8.7.1 SORBITOL
                    8.7.1.1 Multifunctionality of sorbitol to encourage its adoption in food and beverages
           8.7.2 MALTITOL
                    8.7.2.1 Versatility of maltitol to drive market demand
           8.7.3 XYLITOL
                    8.7.3.1 Diverse medical applications to xylitol to drive its demand
           8.7.4 MANNITOL
                    8.7.4.1 Wide uses of mannitol in pharmaceutical and food industries to spur market
           8.7.5 ERYTHRITOL
                    8.7.5.1 Extensive adoption of erythritol as food ingredient across globe to boost market
           8.7.6 OTHER POLYOLS
 
9 SWEETENERS MARKET, BY TYPE (Page No. - 175)
    9.1 INTRODUCTION 
           FIGURE 41 HIGH-INTENSITY SWEETENERS SEGMENT TO DOMINATE SWEETENERS MARKET BY 2028
           TABLE 70 SWEETENERS MARKET, BY TYPE, 2019–2022 (USD MILLION)
           TABLE 71 SWEETENERS MARKET, BY TYPE, 2023–2028 (USD MILLION)
    9.2 HIGH-INTENSITY SWEETENERS 
           9.2.1 INCREASED APPLICATION OF HIGH-INTENSITY SWEETENERS AS FOOD ADDITIVES IN DESSERTS, SWEETS, DRINKS, AND CHEWING GUMS TO PROPEL MARKET
                    TABLE 72 HIGH-INTENSITY SWEETENERS MARKET, BY REGION, 2019–2022 (USD MILLION)
                    TABLE 73 HIGH-INTENSITY SWEETENERS MARKET, BY REGION, 2023–2028 (USD MILLION)
                    TABLE 74 HIGH-INTENSITY SWEETENERS MARKET, BY NATURE, 2019–2022 (USD MILLION)
                    TABLE 75 HIGH-INTENSITY SWEETENERS MARKET, BY NATURE, 2023–2028 (USD MILLION)
           9.2.2 NATURAL
                    TABLE 76 NATURAL HIGH-INTENSITY SWEETENERS MARKET, BY REGION,  2019–2022 (USD MILLION)
                    TABLE 77 NATURAL HIGH-INTENSITY SWEETENERS MARKET, BY REGION,  2023–2028 (USD MILLION)
           9.2.3 ARTIFICIAL
                    TABLE 78 ARTIFICIAL HIGH-INTENSITY SWEETENERS MARKET, BY REGION,  2019–2022 (USD MILLION)
                    TABLE 79 ARTIFICIAL HIGH-INTENSITY SWEETENERS MARKET, BY REGION,  2023–2028 (USD MILLION)
    9.3 LOW-INTENSITY SWEETENERS 
           9.3.1 SOARING NUMBER OF METABOLIC DISEASES TO PROMPT INCREASED APPLICATION OF LOW-INTENSITY SWEETENERS IN FOOD AND BEVERAGES
                    TABLE 80 LOW-INTENSITY SWEETENERS MARKET, BY REGION, 2019–2022 (USD MILLION)
                    TABLE 81 LOW-INTENSITY SWEETENERS MARKET, BY REGION, 2023–2028 (USD MILLION)
 
10 SWEETENERS MARKET, BY FORM (Page No. - 183)
     10.1 INTRODUCTION 
               FIGURE 42 POWDER SEGMENT TO ACCOUNT FOR LARGEST MARKET BY 2028
               TABLE 82 SWEETENERS MARKET, BY FORM, 2019–2022 (USD MILLION)
               TABLE 83 SWEETENERS MARKET, BY FORM, 2023–2028 (USD MILLION)
     10.2 POWDER 
             10.2.1 INCREASING CONSUMER DEMAND FOR CONVENIENT, LOW-CALORIE, AND PORTION-CONTROLLED SWEETENERS TO DRIVE GROWTH
                       TABLE 84 POWDER: SWEETENERS MARKET, BY REGION, 2019–2022 (USD MILLION)
                       TABLE 85 POWDER: SWEETENERS MARKET, BY REGION, 2023–2028 (USD MILLION)
     10.3 LIQUID 
             10.3.1 EXTENDED SHELF-LIFE AND EASY APPLICATION OF LIQUID SWEETENERS TO BOOST THEIR GROWTH
                       TABLE 86 LIQUID: SWEETENERS MARKET, BY REGION, 2019–2022 (USD MILLION)
                       TABLE 87 LIQUID: SWEETENERS MARKET, BY REGION, 2023–2028 (USD MILLION)
     10.4 CRYSTALS 
             10.4.1 ADVANCEMENTS IN FOOD TECHNOLOGY, RESULTING IN IMPROVED TASTE PROFILE AND SOLUBILITY OF CRYSTAL SWEETENERS, TO SPUR THEIR GROWTH
                       TABLE 88 CRYSTALS: SWEETENERS MARKET, BY REGION, 2019–2022 (USD MILLION)
                       TABLE 89 CRYSTALS: SWEETENERS MARKET, BY REGION, 2023–2028 (USD MILLION)
 
11 SWEETENERS MARKET, BY SALES CHANNEL (Page No. - 189)
     11.1 INTRODUCTION 
               FIGURE 43 SWEETENERS MARKET, BY SALES CHANNEL, 2023 VS. 2028 (USD MILLION)
               TABLE 90 SWEETENERS MARKET, BY SALES CHANNEL, 2019–2022 (USD MILLION)
               TABLE 91 SWEETENERS MARKET, BY SALES CHANNEL, 2023–2028 (USD MILLION)
     11.2 DIRECT (B2B) 
             11.2.1 NEED FOR PERSONALIZED AND STREAMLINED PROCESS OF OFFERING SWEETENERS TO BOOST THEIR SALES THROUGH DIRECT SALES CHANNELS
                       TABLE 92 DIRECT (B2B): SWEETENERS MARKET, BY REGION, 2019–2022 (USD MILLION)
                       TABLE 93 DIRECT (B2B): SWEETENERS MARKET, BY REGION, 2023–2028 (USD MILLION)
     11.3 INDIRECT (B2C) 
               TABLE 94 SWEETENERS MARKET, BY INDIRECT (B2C) SALES CHANNEL, 2019–2022 (USD MILLION)
               TABLE 95 SWEETENERS MARKET, BY INDIRECT (B2C) SALES CHANNEL, 2023–2028 (USD MILLION)
               TABLE 96 INDIRECT (B2C): SWEETENERS MARKET, BY REGION, 2019–2022 (USD MILLION)
               TABLE 97 INDIRECT (B2C): SWEETENERS MARKET, BY REGION, 2023–2028 (USD MILLION)
             11.3.1 HYPERMARKETS/SUPERMARKETS
                       11.3.1.1 Widespread product accessibility and consumer engagement to facilitate sales of sweeteners through hypermarkets
                                   TABLE 98 HYPERMARKETS/SUPERMARKETS: SWEETENERS MARKET, BY REGION,  2019–2022 (USD MILLION)
                                   TABLE 99 HYPERMARKETS/SUPERMARKETS: SWEETENERS MARKET, BY REGION,  2023–2028 (USD MILLION)
             11.3.2 CONVENIENCE STORES
                       11.3.2.1 Promotional strategies adopted by convenience stores to persuade people to purchases and, in turn, catalyze market expansion
                                   TABLE 100 CONVENIENCE STORES: SWEETENERS MARKET, BY REGION, 2019–2022 (USD MILLION)
                                   TABLE 101 CONVENIENCE STORES: SWEETENERS MARKET, BY REGION, 2023–2028 (USD MILLION)
             11.3.3 SPECIALTY RETAIL STORES
                       11.3.3.1 Specialty retail stores within global sweeteners market cater to niche consumer segments by offering curated selection of sweetener products
                                   TABLE 102 SPECIALTY RETAIL STORES: SWEETENERS MARKET, BY REGION, 2019–2022 (USD MILLION)
                                   TABLE 103 SPECIALTY RETAIL STORES: SWEETENERS MARKET, BY REGION,  2023–2028 (USD MILLION)
             11.3.4 ONLINE RETAILERS
                       11.3.4.1 Convenience of door-step delivery provided by online retailers to propel sweeteners market
                                   TABLE 104 ONLINE RETAILERS: SWEETENERS MARKET, BY REGION, 2019–2022 (USD MILLION)
                                   TABLE 105 ONLINE RETAILERS: SWEETENERS MARKET, BY REGION, 2023–2028 (USD MILLION)
             11.3.5 OTHER CHANNELS
                       TABLE 106 OTHER CHANNELS: SWEETENERS MARKET, BY REGION, 2019–2022 (USD MILLION)
                       TABLE 107 OTHER CHANNELS: SWEETENERS MARKET, BY REGION, 2023–2028 (USD MILLION)
 
12 SWEETENERS MARKET, BY REGION (Page No. - 200)
     12.1 INTRODUCTION 
               FIGURE 44 US AND CANADA TO ACHIEVE SIGNIFICANT GROWTH DURING FORECAST PERIOD
               TABLE 108 SWEETENERS MARKET, BY REGION, 2019–2022 (USD MILLION)
               TABLE 109 SWEETENERS MARKET, BY REGION, 2023–2028 (USD MILLION)
               TABLE 110 SWEETENERS MARKET, BY REGION, 2019–2022 (KT)
               TABLE 111 SWEETENERS MARKET, BY REGION, 2023–2028 (KT)
     12.2 NORTH AMERICA 
               FIGURE 45 NORTH AMERICA: SWEETENERS MARKET SNAPSHOT
             12.2.1 NORTH AMERICA: RECESSION IMPACT
                       FIGURE 46 NORTH AMERICA: RECESSION IMPACT ANALYSIS
                       TABLE 112 NORTH AMERICA: SWEETENERS MARKET, BY COUNTRY, 2019–2022 (USD MILLION)
                       TABLE 113 NORTH AMERICA: SWEETENERS MARKET, BY COUNTRY, 2023–2028 (USD MILLION)
                       TABLE 114 NORTH AMERICA: SWEETENERS MARKET, BY COUNTRY, 2019–2022 (KT)
                       TABLE 115 NORTH AMERICA: SWEETENERS MARKET, BY COUNTRY, 2023–2028 (KT)
                       TABLE 116 NORTH AMERICA: SWEETENERS MARKET, BY PRODUCT, 2019–2022 (USD MILLION)
                       TABLE 117 NORTH AMERICA: SWEETENERS MARKET, BY PRODUCT, 2023–2028 (USD MILLION)
                       TABLE 118 NORTH AMERICA: SWEETENERS MARKET, BY PRODUCT, 2019–2022 (KT)
                       TABLE 119 NORTH AMERICA: SWEETENERS MARKET, BY PRODUCT, 2023–2028 (KT)
                       TABLE 120 NORTH AMERICA: NATURAL SWEETENERS MARKET, BY SUBTYPE,  2019–2022 (USD MILLION)
                       TABLE 121 NORTH AMERICA: NATURAL SWEETENERS MARKET, BY SUBTYPE,  2023–2028 (USD MILLION)
                       TABLE 122 NORTH AMERICA: ARTIFICIAL SWEETENERS MARKET, BY SUBTYPE,  2019–2022 (USD MILLION)
                       TABLE 123 NORTH AMERICA: ARTIFICIAL SWEETENERS MARKET, BY SUBTYPE,  2023–2028 (USD MILLION)
                       TABLE 124 NORTH AMERICA: NOVEL SWEETENERS MARKET, BY SUBTYPE,  2019–2022 (USD MILLION)
                       TABLE 125 NORTH AMERICA: NOVEL SWEETENERS MARKET, BY SUBTYPE,  2023–2028 (USD MILLION)
                       TABLE 126 NORTH AMERICA: POLYOLS MARKET, BY SUBTYPE, 2019–2022 (USD MILLION)
                       TABLE 127 NORTH AMERICA: POLYOLS MARKET, BY SUBTYPE, 2023–2028 (USD MILLION)
                       TABLE 128 NORTH AMERICA: SWEETENERS MARKET, BY TYPE, 2019–2022 (USD MILLION)
                       TABLE 129 NORTH AMERICA: SWEETENERS MARKET, BY TYPE, 2023–2028 (USD MILLION)
                       TABLE 130 NORTH AMERICA: HIGH-INTENSITY SWEETENERS MARKET, BY NATURE,  2019–2022 (USD MILLION)
                       TABLE 131 NORTH AMERICA: HIGH-INTENSITY SWEETENERS MARKET, BY NATURE,  2023–2028 (USD MILLION)
                       TABLE 132 NORTH AMERICA: SWEETENERS MARKET, BY FORM, 2019–2022 (USD MILLION)
                       TABLE 133 NORTH AMERICA: SWEETENERS MARKET, BY FORM, 2023–2028 (USD MILLION)
                       TABLE 134 NORTH AMERICA: SWEETENERS MARKET, BY SALES CHANNEL,  2019–2022 (USD MILLION)
                       TABLE 135 NORTH AMERICA: SWEETENERS MARKET, BY SALES CHANNEL,  2023–2028 (USD MILLION)
                       TABLE 136 NORTH AMERICA: SWEETENERS MARKET, BY INDIRECT (B2C) CHANNEL,  2019–2022 (USD MILLION)
                       TABLE 137 NORTH AMERICA: SWEETENERS MARKET, BY INDIRECT (B2C) CHANNEL,  2023–2028 (USD MILLION)
                       TABLE 138 NORTH AMERICA: SWEETENERS MARKET, BY APPLICATION, 2019–2022 (USD MILLION)
                       TABLE 139 NORTH AMERICA: SWEETENERS MARKET, BY APPLICATION, 2023–2028 (USD MILLION)
                       TABLE 140 NORTH AMERICA: SWEETENERS MARKET, BY BEVERAGE APPLICATION,  2019–2022 (USD MILLION)
                       TABLE 141 NORTH AMERICA: SWEETENERS MARKET, BY BEVERAGE APPLICATION,  2023–2028 (USD MILLION)
                       TABLE 142 NORTH AMERICA: SWEETENERS MARKET, BY FOOD APPLICATION,  2019–2022 (USD MILLION)
                       TABLE 143 NORTH AMERICA: SWEETENERS MARKET, BY FOOD APPLICATION,  2023–2028 (USD MILLION)
             12.2.2 US
                       12.2.2.1 Rise in consumer awareness regarding detriments of high sugar intake
                                   TABLE 144 US: SWEETENERS MARKET, BY APPLICATION, 2019–2022 (USD MILLION)
                                   TABLE 145 US: SWEETENERS MARKET, BY APPLICATION, 2023–2028 (USD MILLION)
             12.2.3 CANADA
                       12.2.3.1 Government approval for several sugar alternatives
                                   TABLE 146 CANADA: SWEETENERS MARKET, BY APPLICATION, 2019–2022 (USD MILLION)
                                   TABLE 147 CANADA: SWEETENERS MARKET, BY APPLICATION, 2023–2028 (USD MILLION)
     12.3 EUROPE 
               FIGURE 47 EUROPE: SWEETENERS MARKET SNAPSHOT
             12.3.1 EUROPE: RECESSION IMPACT
                       FIGURE 48 EUROPE: RECESSION IMPACT ANALYSIS
                       TABLE 148 EUROPE: SWEETENERS MARKET, BY COUNTRY, 2019–2022 (USD MILLION)
                       TABLE 149 EUROPE: SWEETENERS MARKET, BY COUNTRY, 2023–2028 (USD MILLION)
                       TABLE 150 EUROPE: SWEETENERS MARKET, BY COUNTRY, 2019–2022 (KT)
                       TABLE 151 EUROPE: SWEETENERS MARKET, BY COUNTRY, 2023–2028 (KT)
                       TABLE 152 EUROPE: SWEETENERS MARKET, BY PRODUCT, 2019–2022 (USD MILLION)
                       TABLE 153 EUROPE: SWEETENERS MARKET, BY PRODUCT, 2023–2028 (USD MILLION)
                       TABLE 154 EUROPE: SWEETENERS MARKET, BY PRODUCT, 2019–2022 (KT)
                       TABLE 155 EUROPE: SWEETENERS MARKET, BY PRODUCT, 2023–2028 (KT)
                       TABLE 156 EUROPE: NATURAL SWEETENERS MARKET, BY SUBTYPE, 2019–2022 (USD MILLION)
                       TABLE 157 EUROPE: NATURAL SWEETENERS MARKET, BY SUBTYPE, 2023–2028 (USD MILLION)
                       TABLE 158 EUROPE: ARTIFICIAL SWEETENERS MARKET, BY SUBTYPE, 2019–2022 (USD MILLION)
                       TABLE 159 EUROPE: ARTIFICIAL SWEETENERS MARKET, BY SUBTYPE, 2023–2028 (USD MILLION)
                       TABLE 160 EUROPE: NOVEL SWEETENERS MARKET, BY SUBTYPE, 2019–2022 (USD MILLION)
                       TABLE 161 EUROPE: NOVEL SWEETENERS MARKET, BY SUBTYPE, 2023–2028 (USD MILLION)
                       TABLE 162 EUROPE: POLYOLS MARKET, BY SUBTYPE, 2019–2022 (USD MILLION)
                       TABLE 163 EUROPE: POLYOLS MARKET, BY SUBTYPE, 2023–2028 (USD MILLION)
                       TABLE 164 EUROPE: SWEETENERS MARKET, BY TYPE, 2019–2022 (USD MILLION)
                       TABLE 165 EUROPE: SWEETENERS MARKET, BY TYPE, 2023–2028 (USD MILLION)
                       TABLE 166 EUROPE: HIGH-INTENSITY SWEETENERS MARKET, BY NATURE,  2019–2022 (USD MILLION)
                       TABLE 167 EUROPE: HIGH-INTENSITY SWEETENERS MARKET, BY NATURE,  2023–2028 (USD MILLION)
                       TABLE 168 EUROPE: SWEETENERS MARKET, BY FORM, 2019–2022 (USD MILLION)
                       TABLE 169 EUROPE: SWEETENERS MARKET, BY FORM, 2023–2028 (USD MILLION)
                       TABLE 170 EUROPE: SWEETENERS MARKET, BY SALES CHANNEL, 2019–2022 (USD MILLION)
                       TABLE 171 EUROPE: SWEETENERS MARKET, BY SALES CHANNEL, 2023–2028 (USD MILLION)
                       TABLE 172 EUROPE: SWEETENERS MARKET, BY INDIRECT (B2C) CHANNEL,  2019–2022 (USD MILLION)
                       TABLE 173 EUROPE: SWEETENERS MARKET, BY INDIRECT (B2C) CHANNEL,  2023–2028 (USD MILLION)
                       TABLE 174 EUROPE: SWEETENERS MARKET, BY APPLICATION, 2019–2022 (USD MILLION)
                       TABLE 175 EUROPE: SWEETENERS MARKET, BY APPLICATION, 2023–2028 (USD MILLION)
                       TABLE 176 EUROPE: SWEETENERS MARKET, BY BEVERAGE APPLICATION,  2019–2022 (USD MILLION)
                       TABLE 177 EUROPE: SWEETENERS MARKET, BY BEVERAGE APPLICATION,  2023–2028 (USD MILLION)
                       TABLE 178 EUROPE: SWEETENERS MARKET, BY FOOD APPLICATION, 2019–2022 (USD MILLION)
                       TABLE 179 EUROPE: SWEETENERS MARKET, BY FOOD APPLICATION, 2023–2028 (USD MILLION)
             12.3.2 GERMANY
                       12.3.2.1 Increase in consumer inclination toward maintaining balanced lifestyles
                                   TABLE 180 GERMANY: SWEETENERS MARKET, BY APPLICATION, 2019–2022 (USD MILLION)
                                   TABLE 181 GERMANY: SWEETENERS MARKET, BY APPLICATION, 2023–2028 (USD MILLION)
             12.3.3 UK
                       12.3.3.1 Greater preference for products with additional functional benefits
                                   TABLE 182 UK: SWEETENERS MARKET, BY APPLICATION, 2019–2022 (USD MILLION)
                                   TABLE 183 UK: SWEETENERS MARKET, BY APPLICATION, 2023–2028 (USD MILLION)
             12.3.4 FRANCE
                       12.3.4.1 Increase in investor-friendly policies and free-trade agreements
                                   TABLE 184 FRANCE: SWEETENERS MARKET, BY APPLICATION, 2019–2022 (USD MILLION)
                                   TABLE 185 FRANCE: SWEETENERS MARKET, BY APPLICATION, 2023–2028 (USD MILLION)
             12.3.5 ITALY
                       12.3.5.1 Rise in demand for health-enriching beverages with growth of chronic illnesses
                                   TABLE 186 ITALY: SWEETENERS MARKET, BY APPLICATION, 2019–2022 (USD MILLION)
                                   TABLE 187 ITALY: SWEETENERS MARKET, BY APPLICATION, 2023–2028 (USD MILLION)
             12.3.6 SPAIN
                       12.3.6.1 Increase in popularity of healthy food and beverages
                                   TABLE 188 SPAIN: SWEETENERS MARKET, BY APPLICATION, 2019–2022 (USD MILLION)
                                   TABLE 189 SPAIN: SWEETENERS MARKET, BY APPLICATION, 2023–2028 (USD MILLION)
             12.3.7 RUSSIA
                       12.3.7.1 Surge in production of sugar and confections
                                   TABLE 190 RUSSIA: SWEETENERS MARKET, BY APPLICATION, 2019–2022 (USD MILLION)
                                   TABLE 191 RUSSIA: SWEETENERS MARKET, BY APPLICATION, 2023–2028 (USD MILLION)
             12.3.8 POLAND
                       12.3.8.1 Robust sugar industry
                                   TABLE 192 POLAND: SWEETENERS MARKET, BY APPLICATION, 2019–2022 (USD MILLION)
                                   TABLE 193 POLAND: SWEETENERS MARKET, BY APPLICATION, 2023–2028 (USD MILLION)
             12.3.9 REST OF EUROPE
                       TABLE 194 REST OF EUROPE: SWEETENERS MARKET, BY APPLICATION, 2019–2022 (USD MILLION)
                       TABLE 195 REST OF EUROPE: SWEETENERS MARKET, BY APPLICATION, 2023–2028 (USD MILLION)
     12.4 ASIA PACIFIC 
               FIGURE 49 ASIA PACIFIC: SWEETENERS MARKET SNAPSHOT
             12.4.1 ASIA PACIFIC: RECESSION IMPACT
                       FIGURE 50 ASIA PACIFIC: RECESSION IMPACT ANALYSIS
                       TABLE 196 ASIA PACIFIC: SWEETENERS MARKET, BY COUNTRY, 2019–2022 (USD MILLION)
                       TABLE 197 ASIA PACIFIC: SWEETENERS MARKET, BY COUNTRY, 2023–2028 (USD MILLION)
                       TABLE 198 ASIA PACIFIC: SWEETENERS MARKET, BY COUNTRY, 2019–2022 (KT)
                       TABLE 199 ASIA PACIFIC: SWEETENERS MARKET, BY COUNTRY, 2023–2028 (KT)
                       TABLE 200 ASIA PACIFIC: SWEETENERS MARKET, BY PRODUCT, 2019–2022 (USD MILLION)
                       TABLE 201 ASIA PACIFIC: SWEETENERS MARKET, BY PRODUCT, 2023–2028 (USD MILLION)
                       TABLE 202 ASIA PACIFIC: SWEETENERS MARKET, BY PRODUCT, 2019–2022 (KT)
                       TABLE 203 ASIA PACIFIC: SWEETENERS MARKET, BY PRODUCT, 2023–2028 (KT)
                       TABLE 204 ASIA PACIFIC: NATURAL SWEETENERS MARKET, BY SUBTYPE,  2019–2022 (USD MILLION)
                       TABLE 205 ASIA PACIFIC: NATURAL SWEETENERS MARKET, BY SUBTYPE,  2023–2028 (USD MILLION)
                       TABLE 206 ASIA PACIFIC: ARTIFICIAL SWEETENERS MARKET, BY SUBTYPE,  2019–2022 (USD MILLION)
                       TABLE 207 ASIA PACIFIC: ARTIFICIAL SWEETENERS MARKET, BY SUBTYPE,  2023–2028 (USD MILLION)
                       TABLE 208 ASIA PACIFIC: NOVEL SWEETENERS MARKET, BY SUBTYPE, 2019–2022 (USD MILLION)
                       TABLE 209 ASIA PACIFIC: NOVEL SWEETENERS MARKET, BY SUBTYPE, 2023–2028 (USD MILLION)
                       TABLE 210 ASIA PACIFIC: POLYOLS MARKET, BY SUBTYPE, 2019–2022 (USD MILLION)
                       TABLE 211 ASIA PACIFIC: POLYOLS MARKET, BY SUBTYPE, 2023–2028 (USD MILLION)
                       TABLE 212 ASIA PACIFIC: SWEETENERS MARKET, BY TYPE, 2019–2022 (USD MILLION)
                       TABLE 213 ASIA PACIFIC: SWEETENERS MARKET, BY TYPE, 2023–2028 (USD MILLION)
                       TABLE 214 ASIA PACIFIC: HIGH-INTENSITY SWEETENERS MARKET, BY NATURE,  2019–2022 (USD MILLION)
                       TABLE 215 ASIA PACIFIC: HIGH-INTENSITY SWEETENERS MARKET, BY NATURE, 2023–2028 (USD MILLION)
                       TABLE 216 ASIA PACIFIC: SWEETENERS MARKET, BY FORM, 2019–2022 (USD MILLION)
                       TABLE 217 ASIA PACIFIC: SWEETENERS MARKET, BY FORM, 2023–2028 (USD MILLION)
                       TABLE 218 ASIA PACIFIC: SWEETENERS MARKET, BY SALES CHANNEL, 2019–2022 (USD MILLION)
                       TABLE 219 ASIA PACIFIC: SWEETENERS MARKET, BY SALES CHANNEL, 2023–2028 (USD MILLION)
                       TABLE 220 ASIA PACIFIC: SWEETENERS MARKET, BY INDIRECT (B2C) CHANNEL,  2019–2022 (USD MILLION)
                       TABLE 221 ASIA PACIFIC: SWEETENERS MARKET, BY INDIRECT (B2C) CHANNEL,  2023–2028 (USD MILLION)
                       TABLE 222 ASIA PACIFIC: SWEETENERS MARKET, BY APPLICATION, 2019–2022 (USD MILLION)
                       TABLE 223 ASIA PACIFIC: SWEETENERS MARKET, BY APPLICATION, 2023–2028 (USD MILLION)
                       TABLE 224 ASIA PACIFIC: SWEETENERS MARKET, BY BEVERAGE APPLICATION,  2019–2022 (USD MILLION)
                       TABLE 225 ASIA PACIFIC: SWEETENERS MARKET, BY BEVERAGE APPLICATION,  2023–2028 (USD MILLION)
                       TABLE 226 ASIA PACIFIC: SWEETENERS MARKET, BY FOOD APPLICATION,  2019–2022 (USD MILLION)
                       TABLE 227 ASIA PACIFIC: SWEETENERS MARKET, BY FOOD APPLICATION,  2023–2028 (USD MILLION)
             12.4.2 CHINA
                       12.4.2.1 Increase in awareness regarding risks pertaining to excessive consumption of sugar
                                   TABLE 228 CHINA: SWEETENERS MARKET, BY APPLICATION, 2019–2022 (USD MILLION)
                                   TABLE 229 CHINA: SWEETENERS MARKET, BY APPLICATION, 2023–2028 (USD MILLION)
             12.4.3 INDIA
                       12.4.3.1 Rise in cases of diabetes and encouragement toward intake of natural sweeteners
                                   TABLE 230 INDIA: SWEETENERS MARKET, BY APPLICATION, 2019–2022 (USD MILLION)
                                   TABLE 231 INDIA: SWEETENERS MARKET, BY APPLICATION, 2023–2028 (USD MILLION)
             12.4.4 JAPAN
                       12.4.4.1 Growth in government initiatives to promote healthy living
                                   TABLE 232 JAPAN: SWEETENERS MARKET, BY APPLICATION, 2019–2022 (USD MILLION)
                                   TABLE 233 JAPAN: SWEETENERS MARKET, BY APPLICATION, 2023–2028 (USD MILLION)
             12.4.5 AUSTRALIA & NEW ZEALAND
                       12.4.5.1 High adoption of low-calorie and sugar-free products
                                   TABLE 234 AUSTRALIA & NEW ZEALAND: SWEETENERS MARKET, BY APPLICATION,  2019–2022 (USD MILLION)
                                   TABLE 235 AUSTRALIA & NEW ZEALAND: SWEETENERS MARKET, BY APPLICATION,  2023–2028 (USD MILLION)
             12.4.6 SOUTH KOREA
                       12.4.6.1 Zero-calorie programs launched by food processing industries
                                   TABLE 236 SOUTH KOREA: SWEETENERS MARKET, BY APPLICATION, 2019–2022 (USD MILLION)
                                   TABLE 237 SOUTH KOREA: SWEETENERS MARKET, BY APPLICATION, 2023–2028 (USD MILLION)
             12.4.7 INDONESIA
                       12.4.7.1 Introduction of self-sufficiency plans, including expansion of cane cultivation
                                   TABLE 238 INDONESIA: SWEETENERS MARKET, BY APPLICATION, 2019–2022 (USD MILLION)
                                   TABLE 239 INDONESIA: SWEETENERS MARKET, BY APPLICATION, 2023–2028 (USD MILLION)
             12.4.8 THAILAND
                       12.4.8.1 Dependence of economy on sugar production and export
                                   TABLE 240 THAILAND: SWEETENERS MARKET, BY APPLICATION, 2019–2022 (USD MILLION)
                                   TABLE 241 THAILAND: SWEETENERS MARKET, BY APPLICATION, 2023–2028 (USD MILLION)
             12.4.9 MALAYSIA
                       12.4.9.1 Robust raw sugar trade dynamics with growth in exports
                                   TABLE 242 MALAYSIA: SWEETENERS MARKET, BY APPLICATION, 2019–2022 (USD MILLION)
                                   TABLE 243 MALAYSIA: SWEETENERS MARKET, BY APPLICATION, 2023–2028 (USD MILLION)
               12.4.10 REST OF ASIA PACIFIC
                                   TABLE 244 REST OF ASIA PACIFIC: SWEETENERS MARKET, BY APPLICATION,  2019–2022 (USD MILLION)
                                   TABLE 245 REST OF ASIA PACIFIC: SWEETENERS MARKET, BY APPLICATION,  2023–2028 (USD MILLION)
     12.5 LATIN AMERICA 
             12.5.1 LATIN AMERICA: RECESSION IMPACT
                       FIGURE 51 LATIN AMERICA: RECESSION IMPACT ANALYSIS
                       TABLE 246 LATIN AMERICA: SWEETENERS MARKET, BY COUNTRY, 2019–2022 (USD MILLION)
                       TABLE 247 LATIN AMERICA: SWEETENERS MARKET, BY COUNTRY, 2023–2028 (USD MILLION)
                       TABLE 248 LATIN AMERICA: SWEETENERS MARKET, BY COUNTRY, 2019–2022 (KT)
                       TABLE 249 LATIN AMERICA: SWEETENERS MARKET, BY COUNTRY, 2023–2028 (KT)
                       TABLE 250 LATIN AMERICA: SWEETENERS MARKET, BY PRODUCT, 2019–2022 (USD MILLION)
                       TABLE 251 LATIN AMERICA: SWEETENERS MARKET, BY PRODUCT, 2023–2028 (USD MILLION)
                       TABLE 252 LATIN AMERICA: SWEETENERS MARKET, BY PRODUCT, 2019–2022 (KT)
                       TABLE 253 LATIN AMERICA: SWEETENERS MARKET, BY PRODUCT, 2023–2028 (KT)
                       TABLE 254 LATIN AMERICA: NATURAL SWEETENERS MARKET, BY SUBTYPE,  2019–2022 (USD MILLION)
                       TABLE 255 LATIN AMERICA: NATURAL SWEETENERS MARKET, BY SUBTYPE,  2023–2028 (USD MILLION)
                       TABLE 256 LATIN AMERICA: ARTIFICIAL SWEETENERS MARKET, BY SUBTYPE,  2019–2022 (USD MILLION)
                       TABLE 257 LATIN AMERICA: ARTIFICIAL SWEETENERS MARKET, BY SUBTYPE,  2023–2028 (USD MILLION)
                       TABLE 258 LATIN AMERICA: NOVEL SWEETENERS MARKET, BY SUBTYPE,  2019–2022 (USD MILLION)
                       TABLE 259 LATIN AMERICA: NOVEL SWEETENERS MARKET, BY SUBTYPE,  2023–2028 (USD MILLION)
                       TABLE 260 LATIN AMERICA: POLYOLS MARKET, BY SUBTYPE, 2019–2022 (USD MILLION)
                       TABLE 261 LATIN AMERICA: POLYOLS MARKET, BY SUBTYPE, 2023–2028 (USD MILLION)
                       TABLE 262 LATIN AMERICA: SWEETENERS MARKET, BY TYPE, 2019–2022 (USD MILLION)
                       TABLE 263 LATIN AMERICA: SWEETENERS MARKET, BY TYPE, 2023–2028 (USD MILLION)
                       TABLE 264 LATIN AMERICA: HIGH-INTENSITY SWEETENERS MARKET, BY NATURE,  2019–2022 (USD MILLION)
                       TABLE 265 LATIN AMERICA: HIGH-INTENSITY SWEETENERS MARKET, BY NATURE,  2023–2028 (USD MILLION)
                       TABLE 266 LATIN AMERICA: SWEETENERS MARKET, BY FORM, 2019–2022 (USD MILLION)
                       TABLE 267 LATIN AMERICA: SWEETENERS MARKET, BY FORM, 2023–2028 (USD MILLION)
                       TABLE 268 LATIN AMERICA: SWEETENERS MARKET, BY SALES CHANNEL, 2019–2022 (USD MILLION)
                       TABLE 269 LATIN AMERICA: SWEETENERS MARKET, BY SALES CHANNEL, 2023–2028 (USD MILLION)
                       TABLE 270 LATIN AMERICA: SWEETENERS MARKET, BY INDIRECT (B2C) CHANNEL,  2019–2022 (USD MILLION)
                       TABLE 271 LATIN AMERICA: SWEETENERS MARKET, BY INDIRECT (B2C) CHANNEL,  2023–2028 (USD MILLION)
                       TABLE 272 LATIN AMERICA: SWEETENERS MARKET, BY APPLICATION, 2019–2022 (USD MILLION)
                       TABLE 273 LATIN AMERICA: SWEETENERS MARKET, BY APPLICATION, 2023–2028 (USD MILLION)
                       TABLE 274 LATIN AMERICA: SWEETENERS MARKET, BY BEVERAGE APPLICATION,  2019–2022 (USD MILLION)
                       TABLE 275 LATIN AMERICA: SWEETENERS MARKET, BY BEVERAGE APPLICATION,  2023–2028 (USD MILLION)
                       TABLE 276 LATIN AMERICA: SWEETENERS MARKET, BY FOOD APPLICATION,  2019–2022 (USD MILLION)
                       TABLE 277 LATIN AMERICA: SWEETENERS MARKET, BY FOOD APPLICATION,  2023–2028 (USD MILLION)
             12.5.2 MEXICO
                       12.5.2.1 Surge in national campaigns to create health awareness
                                   TABLE 278 MEXICO: SWEETENERS MARKET, BY APPLICATION, 2019–2022 (USD MILLION)
                                   TABLE 279 MEXICO: SWEETENERS MARKET, BY APPLICATION, 2023–2028 (USD MILLION)
             12.5.3 BRAZIL
                       12.5.3.1 Brazil’s dominance in sugar industry and climate-resilient strategies
                                   TABLE 280 BRAZIL: SWEETENERS MARKET, BY APPLICATION, 2019–2022 (USD MILLION)
                                   TABLE 281 BRAZIL: SWEETENERS MARKET, BY APPLICATION, 2023–2028 (USD MILLION)
             12.5.4 ARGENTINA
                       12.5.4.1 Argentina’s expanding raw sugar exports to signal growth surge
                                   TABLE 282 ARGENTINA: SWEETENERS MARKET, BY APPLICATION, 2019–2022 (USD MILLION)
                                   TABLE 283 ARGENTINA: SWEETENERS MARKET, BY APPLICATION, 2023–2028 (USD MILLION)
             12.5.5 REST OF LATIN AMERICA
                       TABLE 284 REST OF LATIN AMERICA: SWEETENERS MARKET, BY APPLICATION,  2019–2022 (USD MILLION)
                       TABLE 285 REST OF LATIN AMERICA: SWEETENERS MARKET, BY APPLICATION,  2023–2028 (USD MILLION)
     12.6 REST OF THE WORLD (ROW) 
             12.6.1 ROW: RECESSION IMPACT
                       FIGURE 52 ROW: RECESSION IMPACT ANALYSIS
                       TABLE 286 ROW: SWEETENERS MARKET, BY COUNTRY/REGION, 2019–2022 (USD MILLION)
                       TABLE 287 ROW: SWEETENERS MARKET, BY COUNTRY/REGION, 2023–2028 (USD MILLION)
                       TABLE 288 ROW: SWEETENERS MARKET, BY COUNTRY/REGION, 2019–2022 (KT)
                       TABLE 289 ROW: SWEETENERS MARKET, BY COUNTRY/REGION, 2023–2028 (KT)
                       TABLE 290 ROW: SWEETENERS MARKET, BY PRODUCT, 2019–2022 (USD MILLION)
                       TABLE 291 ROW: SWEETENERS MARKET, BY PRODUCT, 2023–2028 (USD MILLION)
                       TABLE 292 ROW: SWEETENERS MARKET, BY PRODUCT, 2019–2022 (KT)
                       TABLE 293 ROW: SWEETENERS MARKET, BY PRODUCT, 2023–2028 (KT)
                       TABLE 294 ROW: NATURAL SWEETENERS MARKET, BY SUBTYPE, 2019–2022 (USD MILLION)
                       TABLE 295 ROW: NATURAL SWEETENERS MARKET, BY SUBTYPE, 2023–2028 (USD MILLION)
                       TABLE 296 ROW: ARTIFICIAL SWEETENERS MARKET, BY SUBTYPE, 2019–2022 (USD MILLION)
                       TABLE 297 ROW: ARTIFICIAL SWEETENERS MARKET, BY SUBTYPE, 2023–2028 (USD MILLION)
                       TABLE 298 ROW: NOVEL SWEETENERS MARKET, BY SUBTYPE, 2019–2022 (USD MILLION)
                       TABLE 299 ROW: NOVEL SWEETENERS MARKET, BY SUBTYPE, 2023–2028 (USD MILLION)
                       TABLE 300 ROW: POLYOLS MARKET, BY SUBTYPE, 2019–2022 (USD MILLION)
                       TABLE 301 ROW: POLYOLS MARKET, BY SUBTYPE, 2023–2028 (USD MILLION)
                       TABLE 302 ROW: SWEETENERS MARKET, BY TYPE, 2019–2022 (USD MILLION)
                       TABLE 303 ROW: SWEETENERS MARKET, BY TYPE, 2023–2028 (USD MILLION)
                       TABLE 304 ROW: HIGH-INTENSITY SWEETENERS MARKET, BY NATURE, 2019–2022 (USD MILLION)
                       TABLE 305 ROW: HIGH-INTENSITY SWEETENERS MARKET, BY NATURE, 2023–2028 (USD MILLION)
                       TABLE 306 ROW: SWEETENERS MARKET, BY FORM, 2019–2022 (USD MILLION)
                       TABLE 307 ROW: SWEETENERS MARKET, BY FORM, 2023–2028 (USD MILLION)
                       TABLE 308 ROW: SWEETENERS MARKET, BY SALES CHANNEL, 2019–2022 (USD MILLION)
                       TABLE 309 ROW: SWEETENERS MARKET, BY SALES CHANNEL, 2023–2028 (USD MILLION)
                       TABLE 310 ROW: SWEETENERS MARKET, BY INDIRECT (B2C) CHANNEL, 2019–2022 (USD MILLION)
                       TABLE 311 ROW: SWEETENERS MARKET, BY INDIRECT (B2C) CHANNEL, 2023–2028 (USD MILLION)
                       TABLE 312 ROW: SWEETENERS MARKET, BY APPLICATION, 2019–2022 (USD MILLION)
                       TABLE 313 ROW: SWEETENERS MARKET, BY APPLICATION, 2023–2028 (USD MILLION)
                       TABLE 314 ROW: SWEETENERS MARKET, BY BEVERAGE APPLICATION, 2019–2022 (USD MILLION)
                       TABLE 315 ROW: SWEETENERS MARKET, BY BEVERAGE APPLICATION, 2023–2028 (USD MILLION)
                       TABLE 316 ROW: SWEETENERS MARKET, BY FOOD APPLICATION, 2019–2022 (USD MILLION)
                       TABLE 317 ROW: SWEETENERS MARKET, BY FOOD APPLICATION, 2023–2028 (USD MILLION)
             12.6.2 SOUTH AFRICA
                       12.6.2.1 Consumer spending on premium food and beverage products
                                   TABLE 318 SOUTH AFRICA: SWEETENERS MARKET, BY APPLICATION, 2019–2022 (USD MILLION)
                                   TABLE 319 SOUTH AFRICA: SWEETENERS MARKET, BY APPLICATION, 2023–2028 (USD MILLION)
                                   12.6.3 SAUDI ARABIA
                       12.6.3.1 Growing awareness regarding sugar-related health concerns such as diabetes
                                   TABLE 320 SAUDI ARABIA: SWEETENERS MARKET, BY APPLICATION, 2019–2022 (USD MILLION)
                                   TABLE 321 SAUDI ARABIA: SWEETENERS MARKET, BY APPLICATION, 2023–2028 (USD MILLION)
             12.6.4 REST OF AFRICA
                       TABLE 322 REST OF AFRICA: SWEETENERS MARKET, BY APPLICATION, 2019–2022 (USD MILLION)
                       TABLE 323 REST OF AFRICA: SWEETENERS MARKET, BY APPLICATION, 2023–2028 (USD MILLION)
             12.6.5 REST OF MIDDLE EAST
                       TABLE 324 REST OF MIDDLE EAST: SWEETENERS MARKET, BY APPLICATION,  2019–2022 (USD MILLION)
                       TABLE 325 REST OF MIDDLE EAST: SWEETENERS MARKET, BY APPLICATION,  2023–2028 (USD MILLION)
 
13 COMPETITIVE LANDSCAPE (Page No. - 301)
     13.1 OVERVIEW 
     13.2 MARKET SHARE ANALYSIS 
               TABLE 326 SUCROSE MARKET: INTENSITY OF COMPETITIVE RIVALRY, 2022
               TABLE 327 SUGAR SUBSTITUTE MARKET: INTENSITY OF COMPETITIVE RIVALRY, 2022
     13.3 KEY PLAYER STRATEGIES/RIGHT TO WIN 
               TABLE 328 STRATEGIES ADOPTED BY KEY PLAYERS IN SWEETENERS MARKET
     13.4 REVENUE ANALYSIS 
               FIGURE 53 ANNUAL REVENUE ANALYSIS OF KEY MARKET PLAYERS,  2018–2022 (USD BILLION)
     13.5 KEY PLAYERS’ ANNUAL REVENUE VS. GROWTH 
               FIGURE 54 ANNUAL REVENUE, 2022 (USD BILLION) VS. REVENUE GROWTH, 2020–2022
     13.6 KEY PLAYERS’ EBITDA 
               FIGURE 55 EBITDA, 2022 (USD BILLION)
     13.7 GLOBAL SNAPSHOT OF KEY MARKET PARTICIPANTS 
               FIGURE 56 SWEETENERS MARKET: GLOBAL SNAPSHOT OF KEY PARTICIPANTS, 2022
     13.8 COMPANY EVALUATION MATRIX 
             13.8.1 STARS
             13.8.2 EMERGING LEADERS
             13.8.3 PERVASIVE PLAYERS
             13.8.4 PARTICIPANTS
                       FIGURE 57 COMPANY EVALUATION MATRIX FOR KEY PLAYERS, 2022
             13.8.5 COMPANY FOOTPRINT
                       TABLE 329 COMPANY FOOTPRINT, BY PRODUCT
                       TABLE 330 COMPANY FOOTPRINT, BY APPLICATION
                       TABLE 331 COMPANY FOOTPRINT, BY REGION
                       TABLE 332 OVERALL COMPANY FOOTPRINT
     13.9 STARTUP/SME EVALUATION MATRIX 
             13.9.1 PROGRESSIVE COMPANIES
             13.9.2 RESPONSIVE COMPANIES
             13.9.3 DYNAMIC COMPANIES
             13.9.4 STARTING BLOCKS
                       FIGURE 58 COMPANY EVALUATION MATRIX FOR STARTUPS/SMES, 2022
             13.9.5 COMPETITIVE BENCHMARKING
                       TABLE 333 SWEETENERS MARKET: DETAILED LIST OF KEY STARTUPS/SMES
                       TABLE 334 SWEETENERS MARKET: COMPETITIVE BENCHMARKING OF STARTUPS/SMES
     13.10 COMPETITIVE SCENARIO AND TRENDS 
               13.10.1 PRODUCT LAUNCHES
                                   TABLE 335 SWEETENERS MARKET: PRODUCT LAUNCHES, 2019–2023
               13.10.2 DEALS
                                   TABLE 336 SWEETENERS MARKET: DEALS, 2019–2023
               13.10.3 OTHERS
                                   TABLE 337 SWEETENERS MARKET: OTHERS, 2019–2023
 
14 COMPANY PROFILES (Page No. - 325)
(Business overview, Products/Services/Solutions offered, Recent Developments, MNM view)*
     14.1 KEY COMPANIES 
             14.1.1 CARGILL, INCORPORATED
                       TABLE 338 CARGILL, INCORPORATED: BUSINESS OVERVIEW
                       FIGURE 59 CARGILL, INCORPORATED: COMPANY SNAPSHOT
                       TABLE 339 CARGILL, INCORPORATED: PRODUCTS/SERVICES/SOLUTIONS OFFERED
                       TABLE 340 CARGILL, INCORPORATED: PRODUCT LAUNCHES
                       TABLE 341 CARGILL, INCORPORATED: DEALS
                       TABLE 342 CARGILL, INCORPORATED: OTHERS
             14.1.2 ADM
                       TABLE 343 ADM: BUSINESS OVERVIEW
                       FIGURE 60 ADM: COMPANY SNAPSHOT
                       TABLE 344 ADM: PRODUCTS/SERVICES/SOLUTIONS OFFERED
                       TABLE 345 ADM: DEALS
                       TABLE 346 ADM: OTHERS
             14.1.3 INTERNATIONAL FLAVORS & FRAGRANCES INC.
                       TABLE 347 INTERNATIONAL FLAVORS & FRAGRANCES INC.: BUSINESS OVERVIEW
                       FIGURE 61 INTERNATIONAL FLAVORS & FRAGRANCES INC.: COMPANY SNAPSHOT
                       TABLE 348 INTERNATIONAL FLAVORS & FRAGRANCES INC.: PRODUCTS/SERVICES/SOLUTIONS OFFERED
                       TABLE 349 INTERNATIONAL FLAVORS & FRAGRANCES INC.: DEALS
                       TABLE 350 INTERNATIONAL FLAVORS & FRAGRANCES INC.: OTHERS
             14.1.4 INGREDION INCORPORATED
                       TABLE 351 INGREDION INCORPORATED: BUSINESS OVERVIEW
                       FIGURE 62 INGREDION INCORPORATED: COMPANY SNAPSHOT
                       TABLE 352 INGREDION INCORPORATED: PRODUCTS/SERVICES/SOLUTIONS OFFERED
                       TABLE 353 INGREDION INCORPORATED: PRODUCT LAUNCHES
                       TABLE 354 INGREDION INCORPORATED: DEALS
                       TABLE 355 INGREDION INCORPORATED: OTHERS
             14.1.5 TATE & LYLE
                       TABLE 356 TATE & LYLE: BUSINESS OVERVIEW
                       FIGURE 63 TATE & LYLE: COMPANY SNAPSHOT
                       TABLE 357 TATE & LYLE: PRODUCTS/SERVICES/SOLUTIONS OFFERED
                       TABLE 358 TATE & LYLE: PRODUCT LAUNCHES
                       TABLE 359 TATE & LYLE: DEALS
                       TABLE 360 TATE & LYLE: OTHERS
             14.1.6 ASSOCIATED BRITISH FOODS PLC
                       TABLE 361 ASSOCIATED BRITISH FOODS PLC: BUSINESS OVERVIEW
                       FIGURE 64 ASSOCIATED BRITISH FOODS PLC: COMPANY SNAPSHOT
                       TABLE 362 ASSOCIATED BRITISH FOODS PLC: PRODUCTS/SERVICES/SOLUTIONS OFFERED
             14.1.7 GIVAUDAN
                       TABLE 363 GIVAUDAN: BUSINESS OVERVIEW
                       FIGURE 65 GIVAUDAN: COMPANY SNAPSHOT
                       TABLE 364 GIVAUDAN: PRODUCTS/SERVICES/SOLUTIONS OFFERED
                       TABLE 365 GIVAUDAN: DEALS
             14.1.8 FIRMENICH SA
                       TABLE 366 FIRMENICH SA: BUSINESS OVERVIEW
                       FIGURE 66 FIRMENICH SA: COMPANY SNAPSHOT
                       TABLE 367 FIRMENICH SA: PRODUCTS/SERVICES/SOLUTIONS OFFERED
                       TABLE 368 FIRMENICH SA: DEALS
             14.1.9 SYMRISE
                       TABLE 369 SYMRISE: BUSINESS OVERVIEW
                       FIGURE 67 SYMRISE: COMPANY SNAPSHOT
                       TABLE 370 SYMRISE: PRODUCTS/SERVICES/SOLUTIONS OFFERED
                       TABLE 371 SYMRISE: DEALS
             14.1.10 SÜDZUCKER AG
                                   TABLE 372 SÜDZUCKER AG: BUSINESS OVERVIEW
                                   FIGURE 68 SÜDZUCKER AG: COMPANY SNAPSHOT
                                   TABLE 373 SÜDZUCKER AG: PRODUCTS/SERVICES/SOLUTIONS OFFERED
             14.1.11 AJINOMOTO CO., INC.
                                   TABLE 374 AJINOMOTO CO., INC.: BUSINESS OVERVIEW
                                   FIGURE 69 AJINOMOTO CO., INC.: COMPANY SNAPSHOT
                                   TABLE 375 AJINOMOTO CO., INC.: PRODUCTS/SERVICES/SOLUTIONS OFFERED
             14.1.12 ZYDUS WELLNESS
                                   TABLE 376 ZYDUS WELLNESS: BUSINESS OVERVIEW
                                   FIGURE 70 ZYDUS WELLNESS: COMPANY SNAPSHOT
                                   TABLE 377 ZYDUS WELLNESS: PRODUCTS/SERVICES/SOLUTIONS OFFERED
                                   TABLE 378 ZYDUS WELLNESS: OTHERS
             14.1.13 TEREOS
                                   TABLE 379 TEREOS: BUSINESS OVERVIEW
                                   FIGURE 71 TEREOS: COMPANY SNAPSHOT
                                   TABLE 380 TEREOS: PRODUCTS/SERVICES/SOLUTIONS OFFERED
                                   TABLE 381 TEREOS: DEALS
             14.1.14 ROQUETTE FRÈRES
                                   TABLE 382 ROQUETTE FRÈRES: BUSINESS OVERVIEW
                                   TABLE 383 ROQUETTE FRÈRES: PRODUCTS/SERVICES/SOLUTIONS OFFERED
                                   TABLE 384 ROQUETTE FRÈRES: PRODUCT LAUNCHES
                                   TABLE 385 ROQUETTE FRÈRES: DEALS
             14.1.15 MACANDREWS & FORBES HOLDINGS INCORPORATED
                                   TABLE 386 MACANDREWS & FORBES HOLDINGS INCORPORATED: BUSINESS OVERVIEW
                                   TABLE 387 MACANDREWS & FORBES HOLDINGS INCORPORATED: PRODUCTS OFFERED
                                   TABLE 388 MACANDREWS & FORBES HOLDINGS INCORPORATED: DEALS
             14.1.16 FOODCHEM INTERNATIONAL CORPORATION
                                   TABLE 389 FOODCHEM INTERNATIONAL CORPORATION: BUSINESS OVERVIEW
                                   TABLE 390 FOODCHEM INTERNATIONAL CORPORATION: PRODUCTS OFFERED
             14.1.17 JK SUCRALOSE INC.
                                   TABLE 391 JK SUCRALOSE INC.: BUSINESS OVERVIEW
                                   TABLE 392 JK SUCRALOSE INC.: PRODUCTS OFFERED
             14.1.18 ZUCHEM
                                   TABLE 393 ZUCHEM: BUSINESS OVERVIEW
                                   TABLE 394 ZUCHEM: PRODUCTS/SERVICES/SOLUTIONS OFFERED
             14.1.19 MANE SA
                                   TABLE 395 MANE SA: BUSINESS OVERVIEW
                                   TABLE 396 MANE SA: PRODUCTS/SERVICES/SOLUTIONS OFFERED
             14.1.20 DÖHLER GMBH
                                   TABLE 397 DÖHLER GMBH: BUSINESS OVERVIEW
                                   TABLE 398 DÖHLER GMBH: PRODUCTS/SERVICES/SOLUTIONS OFFERED
                                   TABLE 399 DÖHLER GMBH: DEALS
     14.2 OTHER PLAYERS 
             14.2.1 ECOGREEN OLEOCHEMICALS
                       TABLE 400 ECOGREEN OLEOCHEMICALS: BUSINESS OVERVIEW
                       TABLE 401 ECOGREEN OLEOCHEMICALS: PRODUCTS OFFERED
             14.2.2 SUMINTER INDIA ORGANICS
                       TABLE 402 SUMINTER INDIA ORGANICS: BUSINESS OVERVIEW
                       TABLE 403 SUMINTER INDIA ORGANICS: PRODUCTS OFFERED
             14.2.3 TAG INGREDIENTS INDIA PVT. LTD.
                       TABLE 404 TAG INGREDIENTS INDIA PVT. LTD.: BUSINESS OVERVIEW
                       TABLE 405 TAG INGREDIENTS INDIA PVT. LTD: PRODUCTS OFFERED
             14.2.4 THE REAL STEVIA COMPANY AB
                       TABLE 406 THE REAL STEVIA COMPANY AB: BUSINESS OVERVIEW
                       TABLE 407 THE REAL STEVIA COMPANY AB: PRODUCTS OFFERED
             14.2.5 SWEETLY STEVIAUSA
                       TABLE 408 SWEETLY STEVIAUSA: BUSINESS OVERVIEW
                       TABLE 409 SWEETLY STEVIAUSA: PRODUCTS OFFERED
             14.2.6 STEVIA HUB INDIA
                       TABLE 410 STEVIA HUB INDIA: COMPANY OVERVIEW
             14.2.7 PYURE BRANDS
                       TABLE 411 PYURE BRANDS: COMPANY OVERVIEW
             14.2.8 XILINAT
                       TABLE 412 XILINAT: COMPANY OVERVIEW
             14.2.9 FOODITIVE GROUP
                       TABLE 413 FOODITIVE GROUP: COMPANY OVERVIEW
             14.2.10 SAGANA
                                   TABLE 414 SAGANA: COMPANY OVERVIEW
*Details on Business overview, Products/Services/Solutions offered, Recent Developments, MNM view might not be captured in case of unlisted companies.
 
15 ADJACENT AND RELATED MARKETS (Page No. - 415)
     15.1 INTRODUCTION 
               TABLE 415 MARKETS ADJACENT TO SWEETENERS MARKET
     15.2 LIMITATIONS 
     15.3 SUGAR SUBSTITUTES MARKET 
             15.3.1 MARKET DEFINITION
             15.3.2 MARKET OVERVIEW
                       TABLE 416 SUGAR SUBSTITUTES MARKET, BY TYPE, 2019–2022 (USD MILLION)
                       TABLE 417 SUGAR SUBSTITUTES MARKET, BY TYPE, 2023–2028 (USD MILLION)
     15.4 POLYOL SWEETENERS MARKET 
             15.4.1 MARKET DEFINITION
             15.4.2 MARKET OVERVIEW
                       TABLE 418 POLYOL SWEETENERS MARKET, BY TYPE, 2015–2022 (USD MILLION)
 
16 APPENDIX (Page No. - 419)
     16.1 DISCUSSION GUIDE 
     16.2 KNOWLEDGESTORE: MARKETSANDMARKETS’ SUBSCRIPTION PORTAL 
     16.3 CUSTOMIZATION OPTIONS 
     16.4 RELATED REPORTS 
     16.5 AUTHOR DETAILS 

The study involved four major activities in estimating the current size of the sweeteners market. Exhaustive secondary research was done to collect information on the market, peer, and parent markets. The next step was to validate these findings, assumptions, and sizing with industry experts across the value chain through primary research. Both top-down and bottom-up approaches were employed to estimate the complete market size. After that, market breakdown and data triangulation were used to estimate the market size of segments and subsegments.

Secondary Research

This research study involved the extensive use of secondary sources—directories and databases such as Bloomberg Businessweek and Factiva—to identify and collect information useful for a technical, market-oriented, and commercial study of the sweeteners market.

In the secondary research process, various sources, such as the International Sugar Organization (ISO), Food and Agriculture Organization (FAO), Food and Drug Administration (FDA), United States Department of Agriculture (USDA), European Food Safety Agency (EFSA), Food Safety and Standards Authority of India (FSSAI), and academic references pertaining to sweeteners were referred to identify and collect information for this study. The secondary sources also include food journals, press releases, investor presentations of companies, white papers, certified publications, articles by recognized authors and regulatory bodies, trade directories, and paid databases.

Secondary research was mainly conducted to obtain critical information about the industry’s supply chain, the total pool of key players, and market classification and segmentation according to the industry trends to the bottom-most level and geographical markets. It was also used to obtain information about the key developments from a market-oriented perspective.

Primary Research

Extensive primary research was conducted after obtaining information regarding the sweeteners market scenario through secondary research. Several primary interviews were conducted with market experts from both the demand and supply sides across major countries of North America, Europe, Asia Pacific, South America, and the Rest of the World. Primary data was collected through questionnaires, emails, and telephonic interviews. The primary sources from the supply side included various industry experts, such as Chief X Officers (CXOs), Vice Presidents (VPs), Directors, from business development, marketing, research, and development teams, and related key executives from distributors, and key opinion leaders. Primary interviews were conducted to gather insights such as market statistics, data on revenue collected from the products and services, market breakdowns, market size estimations, market forecasting, and data triangulation. Primary research also helped in understanding the various trends related to types of sweeteners, products, forms, sales channels, applications, and regions. Stakeholders from the demand side, such as food and beverage companies and health and personal care companies who are using sweeteners were interviewed to understand the buyer’s perspective on the suppliers, products, and their current usage of sweeteners and the outlook of their business which will affect the overall market.

Sweeteners  Market Size, and Share

To know about the assumptions considered for the study, download the pdf brochure

Market Size Estimation

Both the top-down and bottom-up approaches were used to estimate and validate the total size of the sweeteners market. These approaches were also used extensively to determine the size of various subsegments in the market for the base year in terms of value. The research methodology used to estimate the market size includes the following details:

  • The key players in the industry and the overall markets were identified through extensive secondary research.
  • The revenues of the major players were determined through primary and secondary research, which were used as the basis for market sizing and estimation.
  • All percentage shares, splits, and breakdowns were determined using secondary sources and verified through primary sources.
  • All macroeconomic and microeconomic factors affecting the growth of the sweeteners market were considered while estimating the market size.
  • All possible parameters that affect the market covered in this research study were accounted for, viewed in extensive detail, verified through primary research, and analyzed to obtain final quantitative and qualitative data.

Bottom-up Approach (Demand Side):

Through the bottom-up approach, the data extracted from secondary research was utilized to validate the market segment sizes obtained. The approach was employed to arrive at the overall size of the sweeteners market in particular regions, and its share in the market was validated through primary interviews conducted with sweetener manufacturers, suppliers, dealers, and distributors. With the data triangulation procedure and data validation through primary, the overall size of the parent market and each segmental market were determined.

Sweeteners  Market Bottom Up Approach

To know about the assumptions considered for the study, Request for Free Sample Report

Top-down Approach:

Sweeteners  Market Top Down Approach

Market Size Estimation (Supply Side):

supply-side analysis was conducted to triangulate the market for sweeteners. The market for sweeteners was analyzed for each product.

  • Going at a granular level, the share of sweetener products was analyzed among key players operating in the sweeteners market.
  • The other factors considered include the demand for natural sweeteners, adoptions, increase in innovations, new product launches, consumer awareness, pricing trends, the adoption rate, patents registered, and organic & inorganic growth attempts.

Sweeteners  Market Supply Side

The top-down procedure has been employed to determine the overall size of the sweeteners market from the revenues of key players (companies) and their product share.

  • The market share was then estimated for each company to verify the revenue share used earlier in the bottom-up procedure. With the data triangulation procedure and data validation through primaries, the exact values of the overall parent and each individual market have been determined and confirmed in this study.

Data Triangulation

After arriving at the overall market size from the above estimation process, the total market was split into several segments and subsegments. Where applicable, data triangulation and market breakdown procedures were employed to estimate the overall sweetener market and arrive at the exact statistics for all segments and subsegments. The data was triangulated by studying various factors and trends from the demand and supply sides. The market size was also validated using the top-down and bottom-up approaches.

Market Definition

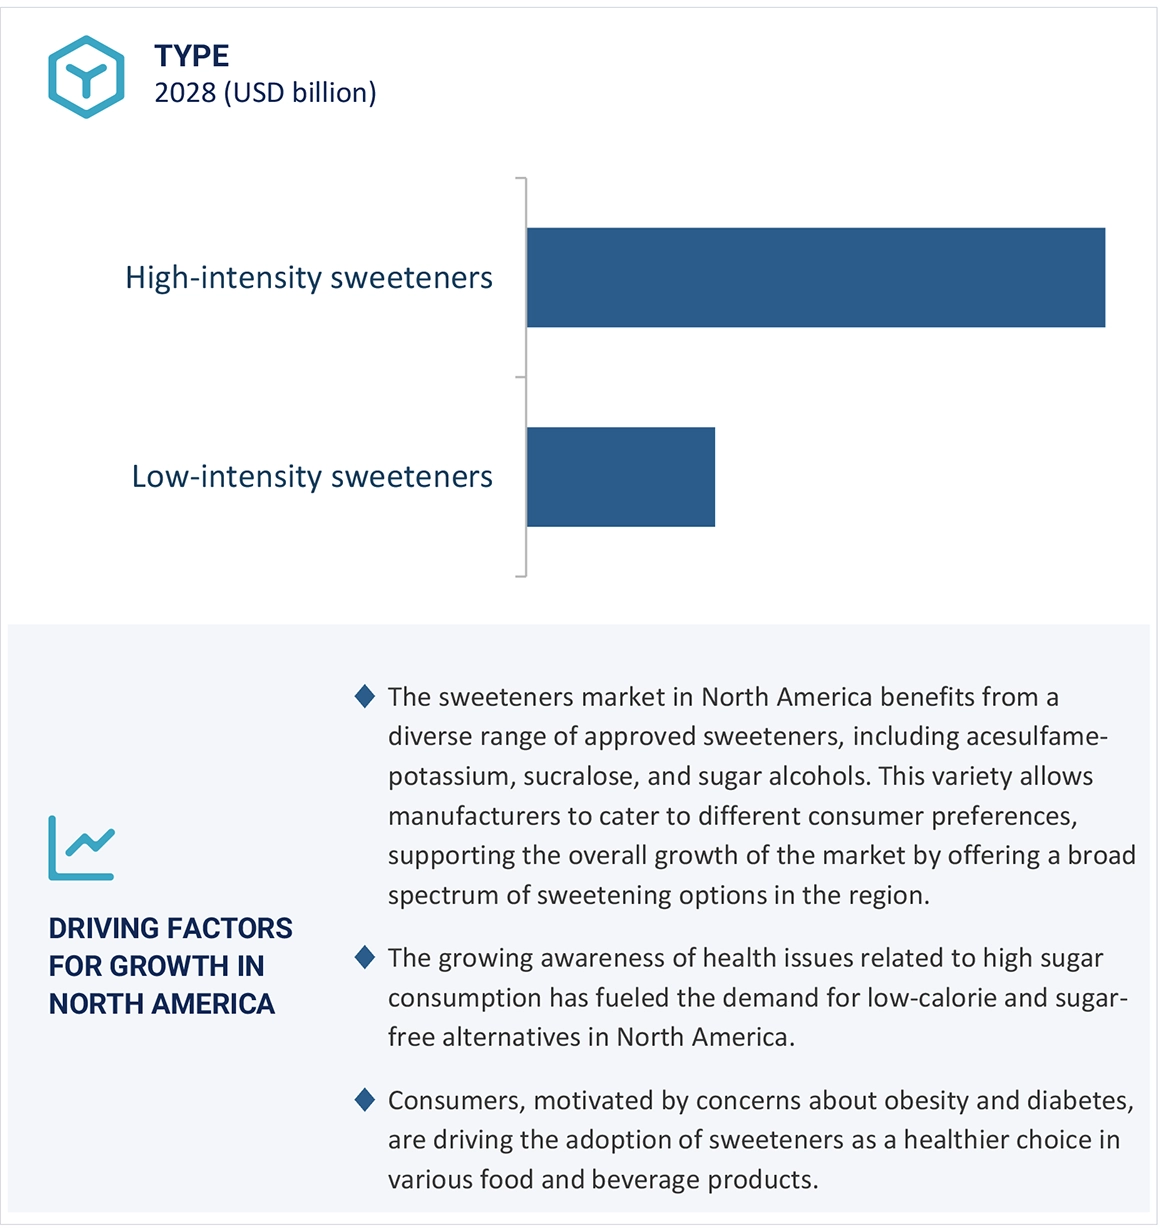
As per the European Food Safety Authority (EFSA), Sweeteners are food additives that are used to impart a sweet taste to foodstuffs. It is an artificial substance that tastes sweet. It is a low-calorie synthetic product used instead of sugar.

Sweeteners are substances employed to add a sweet taste to food, beverages, or other items. They serve as alternatives to natural sugars, providing sweetness without the caloric content associated with conventional sugars. Sweeteners can be categorized into two primary groups: natural sweeteners, sourced from plants or natural origins, and artificial sweeteners, which are chemically manufactured.
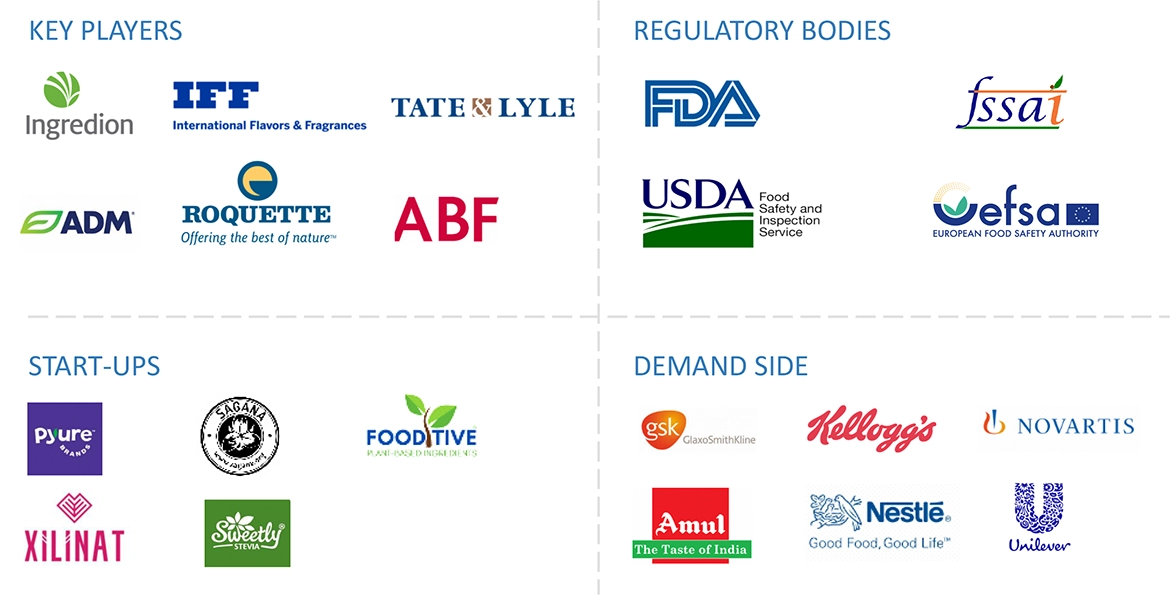
Key Stakeholders

  • Raw material suppliers
  • Regulatory bodies that include the following:
  • Food safety agencies, such as the Food and Drug Administration (FDA), European Food Safety Authority (EFSA), US Department of Agriculture (USDA), Food Standards Australia New Zealand (FSANZ), Health Canada – Food Directorate, China National Center for Food Safety Risk Assessment (CFSA), and World Health Organization (WHO)
  • Government agencies and NGOs
  • End users include the following:
  • Food & beverage manufacturers/suppliers
  • Health & personal care product manufacturers/suppliers
  • Retailers
  • Commercial Research & Development (R&D) institutions and financial institutions
  • Importers and exporters of sugar substitutes
  • Traders, distributors, and suppliers
  • Research organizations
  • Trade associations and industry bodies

Report Objectives

  • To determine and project the size of the sweeteners market, concerning type, product, form, sales channel, application, and region, over five years, ranging from 2023 to 2028
  • To identify the attractive opportunities in the market by determining the largest and fastest-growing segments across regions
  • To provide detailed information about the key factors influencing the growth of the market (drivers, restraints, opportunities, and industry-specific challenges)
  • To analyze the micro-markets concerning individual growth trends, prospects, and their contribution to the total market
  • Identifying and profiling the key players in the sweeteners market
  • Providing a comparative analysis of market leaders based on the following:
    • Product offerings
    • Business strategies
    • Strengths and weakness
    • Key financials
  • Understanding the competitive landscape and identifying the major growth strategies players adopt across the key regions
  • Analyzing the value chain and products across key regions and their impact on prominent market players
  • Providing insights on key product innovations and investments in the sweeteners market

Available Customizations:

With the given market data, MarketsandMarkets offers customizations according to company-specific scientific needs.

The following customization options are available for the report:

Product Analysis

  • Product Matrix, which gives a detailed comparison of the product portfolio of each company.

Geographic Analysis

With the given market data, MarketsandMarkets offers customizations according to company-specific scientific needs.

  • Further breakdown of the Rest of Europe into Sweden, Belgium, Switzerland, Ukraine, and other EU and non-EU countries.
  • Further breakdown of the Rest of Asia Pacific sweeteners market into key countries
  • Further breakdown of the Rest of European sweeteners market into key countries.

Company Information

  • Detailed analyses and profiling of additional market players (up to five)
Custom Market Research Services

We will customize the research for you, in case the report listed above does not meet with your exact requirements. Our custom research will comprehensively cover the business information you require to help you arrive at strategic and profitable business decisions.

Request Customization
Report Code
FB 8903
Published ON
Jan, 2024
Choose License Type
BUY NOW
  • SHARE
X
Request Customization
Speak to Analyst
Speak to Analyst
OR FACE-TO-FACE MEETING
PERSONALIZE THIS RESEARCH
  • Triangulate with your Own Data
  • Get Data as per your Format and Definition
  • Gain a Deeper Dive on a Specific Application, Geography, Customer or Competitor
  • Any level of Personalization
REQUEST A FREE CUSTOMIZATION
LET US HELP YOU!
  • What are the Known and Unknown Adjacencies Impacting the Sweeteners Market
  • What will your New Revenue Sources be?
  • Who will be your Top Customer; what will make them switch?
  • Defend your Market Share or Win Competitors
  • Get a Scorecard for Target Partners
CUSTOMIZED WORKSHOP REQUEST
+1-888-600-6441
  • Call Us
  • +1-888-600-6441 (Corporate office hours)
  • +1-888-600-6441 (US/Can toll free)
  • +44-800-368-9399 (UK office hours)
CONNECT WITH US
ABOUT TRUST ONLINE
©2024 MarketsandMarkets Research Private Ltd. All rights reserved
DMCA.com Protection Status Website Feedback