Talc Market by Deposit Type (Talc Carbonate, Talc Chlorite), End-use Industry (Plastics, Pulp & Paper, Ceramics, Paints & Coatings, Cosmetics & Personal Care, Pharmaceuticals, Food), and Region (Asia Pacific, North America) - Global Forecast to 2023


To get the latest information, inquire now!
[164 Pages Report] Talc Market was valued at USD 2.57 billion in 2017 and is projected to reach USD 3.35 billion by 2023, at a CAGR of 4.6% during the forecast period.
Objectives of this study are:
- To analyze and forecast the size of the talc market, in terms of value and volume
- To define, segment, and estimate the talc market based on deposit type and end-use industry
- To forecast the size of market segments, in terms of value, with respect to 5 main regions, namely, Asia Pacific, North America, Europe, the Middle East & Africa, and South America
- To provide detailed information regarding key factors (drivers, restraints, opportunities, and industry-specific challenges) influencing the growth of the talc market
- To strategically analyze micromarkets with respect to individual growth trends, prospects, and contribution to the total market
- To analyze opportunities in the talc market for stakeholders and provide a competitive landscape of the market
- To track and analyze competitive developments, such as new product developments/launches, acquisitions, expansions, partnerships, and collaborations in the talc market
- To strategically profile key players and comprehensively analyze their market shares and core competencies
The years considered for the study are:
- Base Year – 2017
- Estimated Year – 2018
- Projected Year – 2023
- Forecast Period – 2018 to 2023
For company profiles in the report, 2017 has been considered the base year. In cases wherein information is unavailable for the base year, the years prior to it have been considered.
Research Methodology
The research methodology used to estimate and forecast the global talc market began with capturing data on key vendor revenues through secondary sources, such as Hoovers, Bloomberg, Chemical Weekly, Factiva, and various other government and private websites. Vendor offerings have also been taken into consideration to determine market segmentation. After arriving at the overall market size, the total market was split into several segments and subsegments, which were later verified through primary research by conducting extensive interviews with key personnel, such as CEOs, VPs, directors, and executives. Data triangulation and market breakdown procedures were employed to complete the overall market engineering process and arrive at the exact statistics for all the segments and subsegments of the market. The breakdown of profiles of primaries is depicted in the figure below.
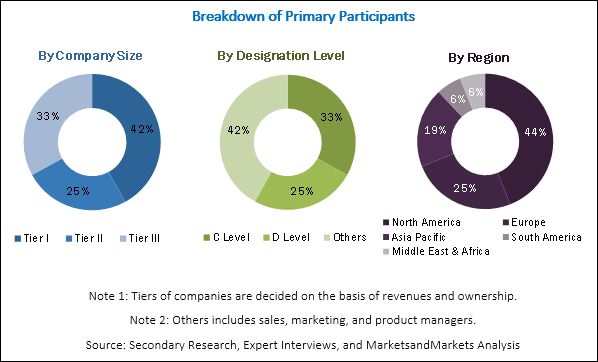
To know about the assumptions considered for the study, download the pdf brochure
The talc market has a diversified ecosystem of upstream players, including raw material suppliers, along with downstream stakeholders, vendors, and government organizations. Companies operating in the talc market include Imerys (France), Mondo Minerals (Netherlands), Minerals Technologies (US), IMI Fabi (Italy), and Golcha Minerals (India), among others.
Target Audience
- Manufacturers, Dealers, and Suppliers of Talc
- End Users of Talc
- Government and Research Organizations
- Companies Operational in Material R&D
- Associations and Industrial Bodies
- Investment Banks
- Consulting Companies/Consultants in Chemical and Material Sectors
“This study answers several questions for stakeholders, primarily the market segments, which they need to focus upon during the next 2 to 5 years so that they may prioritize their efforts and investments accordingly.”
Scope of the Report:
This research report categorizes the talc market based on coating type, application, and region, and forecasts revenues as well as analyzes trends in each of the submarkets.
On the Basis of Deposit Type:
- Talc Carbonate
- Talc Chlorite
- Others
On the Basis of End-use Industry:
- Pulp & Paper
- Plastic Industry
- Ceramics
- Paints & Coatings
- Cosmetics & Personal Care
- Pharmaceuticals
- Food
- Others
On the Basis of Region:
- Asia Pacific
- North America
- Europe
- South America
- Middle East & Africa
Drivers
Increased demand for talc from the automotive industry
Continuous advancements in technologies used in automobiles and increased demand for lightweight automobile parts have led manufacturers of vehicles to replace metal components in automobiles with plastic and composite parts. The use of lightweight plastic and composite parts reduces the overall weight of vehicles, thereby increasing their fuel efficiency. These lightweight plastic parts are made from talc-reinforced polypropylene, which enhances their performance and durability. Talc also offers resistance against abrasion and corrosion. In addition, the growing automotive refinish market and flourishing OEM components market for the automotive industry are also expected to drive the growth of the talc market across the globe during the forecast period.
Rapid industrialization and increased disposable income of the middle-class population of emerging economies
Rapid industrialization in emerging economies such as Thailand, Malaysia, Mexico, Brazil, Argentina, Russia, South Africa, China, and India is driving the growth of the talc market as talc is used in various end-use industries for a number of applications. The growing population and increasing disposable income of the middle-class population of emerging economies have led to the increased demand for various types of consumer products, such as cosmetics, ceramics, automotive plastic parts, and pharmaceuticals, which is, in turn, driving the growth of the talc market. The expanding manufacturing and services sectors in emerging economies are other factors fueling the growth of the talc market.
Restraints
Guidelines regulating the production and use of talc
Guidelines by different environment protection agencies across the globe to regulate the production and use of talc in various end-use industries are expected to hamper the growth of the talc market. These environment protection agencies have implemented various regulations across the globe to reduce the harmful impact of talc mines and processing plants on the environment. There are a number of Food and Drug Administration (FDA) regulations to monitor the use of talc as an anti-caking agent in the food industry. These FDA regulations only permit the use of asbestos-free talc in the food industry. According to the International Journal of Gynecological Cancer, it has also been proved that the frequent use of talcum powder by women can cause ovarian cancer in them. Moreover, talcum powder is associated with the respiratory issues in infants, and long-term exposure to it can cause pneumonia and asthma symptoms.
Slow growth of the pulp & paper industry due to digitization
The pulp & paper industry has been growing at a slow pace across the globe due to digitization, which has reduced the demand for graphic papers. The growth of the pulp & paper industry has been slower in North American and European countries as compared to countries in the Asia Pacific region, which is expected to restrain the growth of the talc market. Moreover, talc is being replaced by biotechnological solutions in applications such as pitch control in the pulp & paper industry. These biotechnological solutions use enzymes or fungi for pitch control. Hence, the use of talc in the pulp & paper industry has declined, thereby leading to the decreased demand for talc from this industry.
The following customization options are available for the report:
Along with the given market data, MarketsandMarkets offers customizations as per the company’s specific needs. The following customization options are available for the report:
Product Analysis
- Product matrix, which provides a detailed comparison of the product portfolio of each company
Geographic Analysis
- Further breakdown of the Rest of Asia Pacific, Rest of the Middle East & Africa, Rest of Europe, and Rest of South America talc markets
Company Information
- Detailed analysis and profiles of additional market players (up to 5 companies)
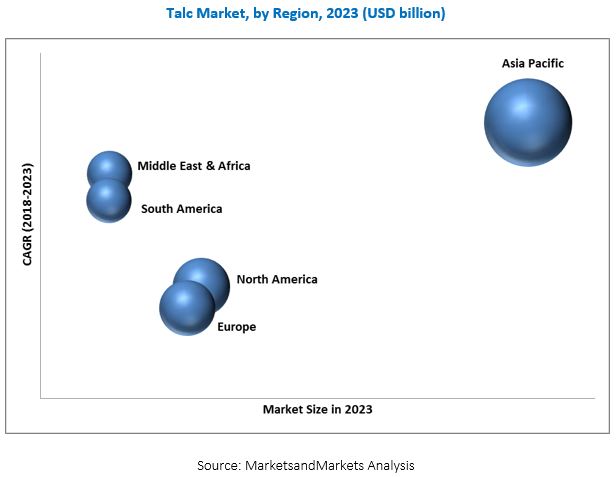
The global talc market is projected to grow from an estimated USD 2.68 billion in 2018 to USD 3.35 billion by 2023, at a CAGR of 4.6% from 2018 to 2023. Talc is also used as a coating agent in rotogravure and offset papers, wherein it improves the runnability of offset papers and the quality of finished papers. It is also used to improve the quality and productivity of certain specialty papers, such as colored papers and labels. Among regions, Asia Pacific is projected to lead the talc market in terms of value. The growth of the Asia Pacific talc market can be attributed to rapid industrialization, growth of the automotive sector, and increasing demand for talc from the cosmetics & personal, ceramics, paints & coatings, and pharmaceuticals end-use industries in the region.
The talc carbonate segment is projected to be the largest deposit type segment of the talc market from 2018 to 2023. Talc carbonate ores are processed to remove associated minerals to produce pure talc concentrate. Talc carbonate ores are generally found in metamorphic ultramafic rocks.
The plastics segment is estimated to be the largest end-use industry segment of the talc market in 2018. Talc is used as an anti-blocking agent in polyethylene and helps restore mechanical properties of recycled plastics. Talc is also used as a nucleating agent in biopolymers and semi-crystalline polymers. In the automotive industry, the use of talc in polymer compounds helps stabilize fenders and develop dashboards that are highly scratch-resistant. Talc also increases the modulus of elasticity, impact resistance, dimensional stability, color consistency, scratch resistance, creep strength, and low abrasion in plastic components.
The Asia Pacific is expected to be the fastest-growing market for talc during the forecast period. The growing middle-class populations with high disposable incomes and increasing demand for consumer goods and consumer durables are major factors contributing to the growth of the talc market in this region.
Slow growth of the pulp & paper industry, and lawsuits filed against the production and use of talc are the key restraints in the talc market.
Key players operating in the talc market include Imerys (France), Mondo Minerals (Netherlands), Minerals Technologies (US), IMI Fabi (Italy), Golcha Minerals (India), and Nippon Talc (Japan), among others. These companies focus on enhancing their product portfolios to grow in the talc market.
Opportunities
R&D activities for the development of new grades of talc
The potential applications of talc are virtually infinite, and continuous R&D activities in the talc industry are expected to help in discovering new applications. R&D activities are being carried out in the talc industry for the development of new grades of talc for use in barrier coatings in paperboard food packaging for the food industry. Extensive research is being carried out to develop coating talc to improve the printability of rotogravure papers; low abrasion talc to carry out polypropylene pipe extrusions; and double-classified talc to develop low Volatile Organic Compound (VOC) coatings, among others. Hence, there is high scope for the development of innovative grades of talc for use in the pulp & paper and food industries.
Increased demand for talc from the Asia Pacific region
The Asia Pacific region is a potential market for talc due to the increased demand for talc from the emerging economies of China and India in the region. The Asia Pacific region is a favorable destination for foreign investments due to the easy availability of raw materials and low-cost labor. China and India are among the top producers of talc globally. The Asia Pacific region is a major producer and exporter of talc across the globe. The growth of the pulp & paper, automotive, plastics, paints & coatings, cosmetics & personal care, ceramics, agriculture, and food industries, which are the major consumers of talc in the Asia Pacific region, is expected to offer opportunities for the growth of the talc market.
Challenges
Lawsuits filed against the production and use of talc
Thousands of lawsuits have been filed across the globe against the use of talc in cosmetic products by people suffering from ovarian cancer or mesothelioma after using these products. By late 2017, different juries across the globe awarded penalties of over USD 700 million in verdicts against the manufacturers of talc-based cosmetic products, such as baby powder, and the companies supplying talc to end-use companies manufacturing these cosmetic products. Thus, lawsuits against the use and production of talc have created the image of talc being an unsafe product, especially in the cosmetics industry. The producers of talc and their end-use companies, however, have denied the charges against the carcinogenic nature of talc. Hence, lawsuits filed against the production and use of talc act as challenges for the growth of the talc market across the globe.
New Product Launches
|
Date |
Company Name |
Description |
|
April 2016 |
Mondo Minerals |
The company launched a new grade of Mondana. Mondana is a 100% natural, pure, and ultra-fine talc. It is colorless and unperfumed. This launch has helped the company in expanding its talc product portfolio for cosmetic applications. |
|
February 2016 |
Imerys |
The company launched a new product, Nicron 674C talc, for the plastic compounding industry. This launch has helped the company expand its talc portfolio for Polypropylene (PP) and Thermoplastic Olefin (TPO) polymer compounds. |
Acquisitions
|
Date |
Company Name |
Description |
|
March 2017 |
IMI Fabi |
IMI Fabi acquired Sibelco’s talc operations located in Uikhoven, Belgium. The acquisition is expected to help IMI Fabi improve its product portfolio of talc products. |
|
July 2016 |
IMI Fabi |
IMI Fabi acquired the talc business of RHI Magnesita located in Bahia, Brazil. This helped the company enhance its presence in Latin America. |
Agreements
|
Date |
Company Name |
Description |
|
June 2015 |
IMI Fabi |
IMI Fabi appointed Omya as the distributor for talc for paints, coatings, adhesives, sealants, construction, and paper applications. This helped the company enhance its presence in Europe. |
|
May 2013 |
IMI Fabi |
The company signed an agreement with MONACHEM Additives Pvt. Ltd., a company headquartered in Vadodara, India to sell and distribute IMI Fabi talc products throughout India to the petrochemical, plastics, paints, and agriculture markets. This agreement helped the company expand its business in India. |
Expansions
|
Date |
Company Name |
Description |
|
July 2016 |
Liaoning Aihai Talc |
Liaoning Aihai Talc formed AIHAI Minerals Europe GmbH, based in Kammern, Austria. The company is expected to be responsible for Liaoning Aihai Talc’s sales activities in the European region. This is expected to help the company service its existing customers and gain new customers in Europe. |
Source: Company Website and Press Releases
To speak to our analyst for a discussion on the above findings, click Speak to Analyst
 Exclusive indicates content/data unique to MarketsandMarkets and not available with any competitors.
Table of Contents
1 Introduction (Page No. - 14)
1.1 Objectives of The Study
1.2 Market Definition
1.3 Scope of The Study
1.3.1 Regional Scope
1.3.2 Markets Covered
1.3.3 Regional Scope
1.3.4 Years Considered in The Report
1.4 Currency & Pricing
1.5 Limitations
1.6 Package Size
1.7 Stakeholders
2 Research Methodology (Page No. - 17)
2.1 Research Data
2.1.1 Secondary Data
2.1.2 Primary Data
2.1.3 Key Data From Secondary Sources
2.1.4 Key Data From Primary Sources
2.1.5 Key Industry Insights
2.2 Market Size Estimation
2.3 Market Breakdown & Data Triangulation
2.4 Market Share Estimation
2.5 Assumptions
2.6 Limitations
3 Executive Summary (Page No. - 25)
3.1 Talc Market, By Deposit Type
3.2 Talc Market, By End-Use Industry
3.3 Talc Market, By Region
4 Premium Insights (Page No. - 28)
4.1 Attractive Opportunities in Talc Market
4.2 Talc Market, By Region
4.3 Asia Pacific Talc Market, By End-Use Industry & Country
4.4 Talc Market, By Deposit Type & Region
4.5 Top Countries in Talc Market
5 Market Overview (Page No. - 31)
5.1 Introduction
5.2 Market Dynamics
5.2.1 Drivers
5.2.1.1 Increased Demand for Talc From The Automotive Industry
5.2.1.2 Rapid Industrialization and Increased Disposable Income of The Middle-Class Population of Emerging Economies
5.2.2 Restraints
5.2.2.1 Guidelines Regulating The Production and Use of Talc
5.2.2.2 Slow Growth of The Pulp & Paper Industry Due to Digitization
5.2.2.3 Easy Availability of Substitutes
5.2.3 Opportunities
5.2.3.1 R&D Activities for The Development of New Grades of Talc
5.2.3.2 Increased Demand for Talc From The Asia Pacific Region
5.2.4 Challenges
5.2.4.1 Lawsuits Filed Against The Production and Use of Talc
5.3 Porter’s Five Forces Analysis
5.3.1 Bargaining Power of Suppliers
5.3.2 Threat of New Entrants
5.3.3 Threat of Substitutes
5.3.4 Bargaining Power of Buyers
5.3.5 Intensity of Competitive Rivalry
5.4 Macroeconomic Indicators
5.4.1 Annual GDP Growth Rate of Major Economies
5.4.2 Automotive Industry
6 Talc Market, By Deposit Type (Page No. - 38)
6.1 Introduction
6.2 Talc Carbonate
6.3 Talc Chlorite
6.4 Other Talc Deposits
7 Talc Market, By End-Use Industry (Page No. - 42)
7.1 Introduction
7.2 Plastics
7.3 Pulp & Paper
7.4 Ceramics
7.5 Paints & Coatings
7.6 Cosmetics & Personal Care
7.7 Pharmaceuticals
7.8 Food
7.9 Others
8 Regional Analysis (Page No. - 52)
8.1 Introduction
8.2 Asia Pacific
8.2.1 China
8.2.2 India
8.2.3 Japan
8.2.4 South Korea
8.2.5 Thailand
8.2.6 Australia
8.2.7 Rest of Asia Pacific
8.3 Europe
8.3.1 Germany
8.3.2 UK
8.3.3 France
8.3.4 Italy
8.3.5 Spain
8.3.6 Rest of Europe
8.4 North America
8.4.1 US
8.4.2 Canada
8.4.3 Mexico
8.5 South America
8.5.1 Brazil
8.5.2 Argentina
8.5.3 Peru
8.5.4 Rest of South America
8.6 Middle East & Africa
8.6.1 Saudi Arabia
8.6.2 Qatar
8.6.3 Iran
8.6.4 Turkey
8.6.5 Rest of The Middle East & Africa
9 Competitive Landscape (Page No. - 104)
9.1 Overview
9.2 Market Ranking Analysis
9.3 Competitive Situations & Trends
9.3.1 New Product Launches/Developments
9.3.2 Acquisitions
9.3.3 Agreements
9.3.4 Expansions
10 Company Profiles (Page No. - 109)
(Business Overview, Products Offered, Recent Developments, SWOT Analysis, MnM View)*
10.1 Imerys
10.2 Mondo Minerals
10.3 Minerals Technologies
10.4 IMI Fabi
10.5 Golcha Minerals
10.6 Nippon Talc
10.7 Liaoning Aihai Talc
10.8 Guangxi Guilin Longsheng Huamei Talc Development Company
10.9 Sibelco
10.10 Xilolite
10.11 Other Leading Players
10.11.1 Laizhou Talc Industry Corp
10.11.2 Laizhou Yudong Talcum Powder
10.11.3 Haichen Minchem Co
10.11.4 Superior Materials
10.11.5 Shandong Province Pingdu Talc Mining
10.11.6 Haicheng Xinda Mining Industry
10.11.7 Liaoning Qianhe Talc Group
10.11.8 Arihant Minchem
10.11.9 Sun Minerals
10.11.10 Jai Vardhman Khaniz
10.11.11 Omar Group
10.11.12 Mazhar Minerals
10.11.13 Sekyung Corporation
10.11.14 Hayashi Kasei
10.11.15 Gohar Syndicate
*Details on Business Overview, Products Offered, Recent Developments, SWOT Analysis, MnM View Might Not Be Captured in Case of Unlisted Companies.
11 Appendix (Page No. - 136)
11.1 Discussion Guide
11.2 Knowledge Store: Marketsandmarkets’ Subscription Portal
11.3 Available Customizations
11.4 Related Reports
11.5 Author Details
List of Tables (135 Tables)
Table 1 Annual GDP Growth Rate of Major Economies, 2012-2016
Table 2 Motor Vehicle Production, By Country, 2015 & 2016
Table 3 Talc Market, By Deposit Type, 2016–2023 (USD Million)
Table 4 Talc Market, By Deposit Type, 2016–2023 (Kilotons)
Table 5 Talc Carbonate Deposit Type Market, By Region, 2016–2023 (Kilotons)
Table 6 Talc Chlorite Deposit Type Market, By Region, 2016–2023 (Kilotons)
Table 7 Other Talc Deposits Market, By Region, 2016–2023 (Kilotons)
Table 8 Talc Market, By End-Use Industry, 2016–2023 (USD Million)
Table 9 Talc Market, By End-Use Industry, 2016–2023 (Kilotons)
Table 10 Talc Market in Plastics End-Use Industry, By Region, 2016–2023 (USD Million)
Table 11 Talc Market in Plastics End-Use Industry, By Region, 2016–2023 (Kilotons)
Table 12 Talc Market in Pulp & Paper End-Use Industry, By Region, 2016–2023 (USD Million)
Table 13 Talc Market in Pulp & Paper End-Use Industry, By Region, 2016–2023 (Kilotons)
Table 14 Talc Market in Ceramics End-Use Industry, By Region, 2016–2023 (USD Million)
Table 15 Talc Market in Ceramics End-Use Industry, By Region, 2016–2023 (Kilotons)
Table 16 Talc Market in Paints & Coatings End-Use Industry, By Region, 2016–2023 (USD Million)
Table 17 Talc Market in Paints & Coatings End-Use Industry, By Region, 2016–2023 (Kilotons)
Table 18 Talc Market in Cosmetics & Personal Care End-Use Industry, By Region, 2016–2023 (USD Million)
Table 19 Talc Market in Cosmetics & Personal Care End-Use Industry, By Region, 2016–2023 (Kilotons)
Table 20 Talc Market in Pharmaceuticals End-Use Industry, By Region, 2016–2023 (USD Million)
Table 21 Talc Market in Pharmaceuticals End-Use Industry, By Region, 2016–2023 (Kilotons)
Table 22 Talc Market in Food End-Use Industry, By Region, 2016–2023 (USD Million)
Table 23 Talc Market in Food End-Use Industry, By Region, 2016–2023 (Kilotons)
Table 24 Talc Market in Other End-Use Industries, By Region, 2016–2023 (USD Million)
Table 25 Talc Market in Other End-Use Industries, By Region, 2016–2023 (Kilotons)
Table 26 Talc Market, By Region, 2016–2023 (USD Million)
Table 27 Talc Market, By Region, 2016-2023 (Kilotons)
Table 28 Talc Market, By Deposit Type, 2016-2023 (USD Million)
Table 29 Talc Market, By Deposit Type, 2016-2023 (Kilotons)
Table 30 Talc Market, By End-Use Industry, 2016-2023 (USD Million)
Table 31 Talc Market, By End-Use Industry, 2016-2023 (Kilotons)
Table 32 Asia Pacific Talc Market, By Country, 2016-2023 (USD Million)
Table 33 Asia Pacific Talc Market, By Country, 2016-2023 (Kilotons)
Table 34 Asia Pacific Talc Market, By Deposit Type, 2016-2023 (Kilotons)
Table 35 Asia Pacific Talc Market, By End-Use Industry, 2016-2023 (USD Million)
Table 36 Asia Pacific Talc Market, By End-Use Industry, 2016-2023 (Kilotons)
Table 37 China Talc Market, By End-Use Industry, 2016-2023 (USD Million)
Table 38 China Talc Market, By End-Use Industry, 2016-2023 (Kilotons)
Table 39 China Talc Market, By Deposit Type, 2016-2023 (Kilotons)
Table 40 India Talc Market, By End-Use Industry, 2016-2023 (USD Million)
Table 41 India Talc Market, By End-Use Industry, 2016-2023 (Kilotons)
Table 42 India Talc Market, By Deposit Type, 2016-2023 (Kilotons)
Table 43 Japan Talc Market, By End-Use Industry, 2016-2023 (USD Million)
Table 44 Japan Talc Market, By End-Use Industry, 2016-2023 (Kilotons)
Table 45 Japan Talc Market, By Deposit Type, 2016-2023 (Kilotons)
Table 46 South Korea Talc Market, By End-Use Industry, 2016-2023 (USD Million)
Table 47 South Korea Talc Market, By End-Use Industry, 2016-2023 (Kilotons)
Table 48 South Korea Talc Market, By Deposit Type, 2016-2023 (Kilotons)
Table 49 Thailand Talc Market, By End-Use Industry, 2016-2023 (USD Million)
Table 50 Thailand Talc Market, By End-Use Industry, 2016-2023 (Kilotons)
Table 51 Thailand Talc Market, By Deposit Type, 2016-2023 (Kilotons)
Table 52 Australia Talc Market, By End-Use Industry, 2016-2023 (USD Million)
Table 53 Australia Talc Market, By End-Use Industry, 2016-2023 (Kilotons)
Table 54 Australia Talc Market, By Deposit Type, 2016-2023 (Kilotons)
Table 55 Rest of Asia Pacific Talc Market, By End-Use Industry, 2016-2023 (USD Million)
Table 56 Rest of Asia Pacific Talc Market, By End-Use Industry, 2016-2023 (Kilotons)
Table 57 Rest of Asia Pacific Talc Market, By Deposit Type, 2016-2023 (Kilotons)
Table 58 Europe Talc Market, By Country, 2016-2023 (USD Million)
Table 59 Europe Talc Market, By Country, 2016-2023 (Kilotons)
Table 60 Europe Talc Market, By Deposit Type, 2016-2023 (Kilotons)
Table 61 Europe Talc Market, By End-Use Industry, 2016-2023 (USD Million)
Table 62 Europe Talc Market, By End-Use Industry, 2016-2023 (Kilotons)
Table 63 Germany Talc Market, By End-Use Industry, 2016-2023 (USD Million)
Table 64 Germany Talc Market, By End-Use Industry, 2016-2023 (Kilotons)
Table 65 Germany Talc Market, By Deposit Type, 2016-2023 (Kilotons)
Table 66 UK Talc Market, By End-Use Industry, 2016-2023 (USD Million)
Table 67 UK Talc Market, By End-Use Industry, 2016-2023 (Kilotons)
Table 68 UK Talc Market, By Deposit Type, 2016-2023 (Kilotons)
Table 69 France Talc Market, By End-Use Industry, 2016-2023 (USD Million)
Table 70 France Talc Market, By End-Use Industry, 2016-2023 (Kilotons)
Table 71 France Talc Market, By Deposit Type, 2016-2023 (Kilotons)
Table 72 Italy Talc Market, By End-Use Industry, 2016-2023 (USD Million)
Table 73 Italy Talc Market, By End-Use Industry, 2016-2023 (Kilotons)
Table 74 Italy Talc Market, By Deposit Type, 2016-2023 (Kilotons)
Table 75 Spain Talc Market, By End-Use Industry, 2016-2023 (USD Million)
Table 76 Spain Talc Market, By End-Use Industry, 2016-2023 (Kilotons)
Table 77 Spain Talc Market, By Deposit Type, 2016-2023 (Kilotons)
Table 78 Rest of Europe Talc Market, By End-Use Industry, 2016-2023 (USD Million)
Table 79 Rest of Europe Talc Market, By End-Use Industry, 2016-2023 (Kilotons)
Table 80 Rest of Europe Talc Market, By Deposit Type, 2016-2023 (Kilotons)
Table 81 North America Talc Market, By Country, 2016-2023 (USD Million)
Table 82 North America Talc Market, By Country, 2016-2023 (Kilotons)
Table 83 North America Talc Market, By Deposit Type, 2016-2023 (Kilotons)
Table 84 North America Talc Market, By End-Use Industry, 2016-2023 (USD Million)
Table 85 North America Talc Market, By End-Use Industry, 2016-2023 (Kilotons)
Table 86 US Talc Market, By End-Use Industry, 2016-2023 (USD Million)
Table 87 US Talc Market, By End-Use Industry, 2016-2023 (Kilotons)
Table 88 US Talc Market, By Deposit Type, 2016-2023 (Kilotons)
Table 89 Canada Talc Market, By End-Use Industry, 2016-2023 (USD Million)
Table 90 Canada Talc Market, By End-Use Industry, 2016-2023 (Kilotons)
Table 91 Canada Talc Market, By Deposit Type, 2016-2023 (Kilotons)
Table 92 Mexico Talc Market, By End-Use Industry, 2016-2023 (USD Million)
Table 93 Mexico Talc Market, By End-Use Industry, 2016-2023 (Kilotons)
Table 94 Mexico Talc Market, By Deposit Type, 2016-2023 (Kilotons)
Table 95 South America Talc Market, By Country, 2016-2023 (USD Million)
Table 96 South America Talc Market, By Country, 2016-2023 (Kilotons)
Table 97 South America Talc Market, By Deposit Type, 2016-2023 (Kilotons)
Table 98 South America Talc Market, By End-Use Industry, 2016-2023 (USD Million)
Table 99 South America Talc Market, By End-Use Industry, 2016-2023 (Kilotons)
Table 100 Brazil Talc Market, By End-Use Industry, 2016-2023 (USD Million)
Table 101 Brazil Talc Market, By End-Use Industry, 2016-2023 (Kilotons)
Table 102 Brazil Talc Market, By Deposit Type, 2016-2023 (Kilotons)
Table 103 Argentina Talc Market, By End-Use Industry, 2016-2023 (USD Million)
Table 104 Argentina Talc Market, By End-Use Industry, 2016-2023 (Kilotons)
Table 105 Argentina Talc Market, By Deposit Type, 2016-2023 (Kilotons)
Table 106 Peru Talc Market, By End-Use Industry, 2016-2023 (USD Million)
Table 107 Peru Talc Market, By End-Use Industry, 2016-2023 (Kilotons)
Table 108 Peru Talc Market, By Deposit Type, 2016-2023 (Kilotons)
Table 109 Rest of South America Talc Market, By End-Use Industry, 2016-2023 (USD Million)
Table 110 Rest of South America Talc Market, By End-Use Industry, 2016-2023 (Kilotons)
Table 111 Rest of South America Talc Market, By Deposit Type, 2016-2023 (Kilotons)
Table 112 Middle East & Africa Talc Market, By Country, 2016-2023 (USD Million)
Table 113 Middle East & Africa Talc Market, By Country, 2016-2023 (Kilotons)
Table 114 Middle East & Africa Talc Market, By Deposit Type, 2016-2023 (Kilotons)
Table 115 Middle East & Africa Talc Market, By End-Use Industry, 2016-2023 (USD Million)
Table 116 Middle East & Africa Talc Market, By End-Use Industry, 2016-2023 (Kilotons)
Table 117 Saudi Arabia Talc Market, By End-Use Industry, 2016-2023 (USD Million)
Table 118 Saudi Arabia Talc Market, By End-Use Industry, 2016-2023 (Kilotons)
Table 119 Saudi Arabia Talc Market, By Deposit Type, 2016-2023 (Kilotons)
Table 120 Qatar Talc Market, By End-Use Industry, 2016-2023 (USD Million)
Table 121 Qatar Talc Market, By End-Use Industry, 2016-2023 (Kilotons)
Table 122 Qatar Talc Market, By Deposit Type, 2016-2023 (Kilotons)
Table 123 Iran Talc Market, By End-Use Industry, 2016-2023 (USD Million)
Table 124 Iran Talc Market, By End-Use Industry, 2016-2023 (Kilotons)
Table 125 Iran Talc Market, By Deposit Type, 2016-2023 (Kilotons)
Table 126 Turkey Talc Market, By End-Use Industry, 2016-2023 (USD Million)
Table 127 Turkey Talc Market, By End-Use Industry, 2016-2023 (Kilotons)
Table 128 Turkey Talc Market, By Deposit Type, 2016-2023 (Kilotons)
Table 129 Rest of the Middle East & Africa Talc Market, By End-Use Industry, 2016-2023 (USD Million)
Table 130 Rest of the Middle East & Africa Talc Market, By End-Use Industry, 2016-2023 (Kilotons)
Table 131 Rest of the Middle East & Africa Talc Market, By Deposit Type, 2016-2023 (Kilotons)
Table 132 New Product Launches, 2012-2016
Table 133 Acquisitions, 2016-2017
Table 134 Agreements, 2013-2015
Table 135 Expansions, 2016
List of Figures (28 Figures)
Figure 1 Talc Market : Market Segmentation
Figure 2 Talc Market: Research Design
Figure 3 Breakdown of Primary Interviews
Figure 4 Bottom-Up Approach
Figure 5 Top-Down Approach
Figure 6 Talc Market: Data Triangulation
Figure 7 Talc Carbonate Segment Projected to Lead Talc Market Between 2018 and 2023
Figure 8 Plastics Segment Projected to Lead Talc Market From 2018 to 2023
Figure 9 Asia Pacific Region Expected to Lead Talc Market in 2018
Figure 10 Increasing Use of Talc in the Plastics and Ceramics End-Use Industries Expected to Drive the Growth of the Talc Market From 2018 to 202328
Figure 11 Asia Pacific Talc Market Projected to Grow at the Highest Cagr From 2018 to 2023
Figure 12 Pulp & Paper End-Use Industry Segment and China Projected to Lead Asia Pacific Talc Market in 2018
Figure 13 Talc Carbonate Deposit Type Segment Expected to Lead Talc Market in All Regions in 2018
Figure 14 China Projected to Lead Talc Market Between 2018 and 2023
Figure 15 Drivers, Restraints, Opportunities, and Challenges
Figure 16 Talc Market: Porter’s Five Forces Analysis
Figure 17 Talc Market, By Deposit Type, 2018 & 2023 (USD Million)
Figure 18 Plastics End-Use Industry Segment Projected to Lead Talc Market During Forecast Period
Figure 19 Regional Snapshot
Figure 20 Asia Pacific Talc Market Snapshot
Figure 21 Europe Talc Market Snapshot
Figure 22 North America Talc Market Snapshot
Figure 23 South America Talc Market Snapshot
Figure 24 Middle East & Africa Talc Market Snapshot
Figure 25 Organic Growth Strategy Majorly Adopted By Key Companies in Talc Market Between 2013 and 2018
Figure 26 Talc Market Ranking, By Company, 2018
Figure 27 Imerys: Company Snapshot
Figure 28 Minerals Technologies: Company Snapshot


Growth opportunities and latent adjacency in Talc Market
Talc Market