Technical Illustration Software Market by Type, Technology, Component (Solution, Services), Organization Size, End-User (Automotive & Machinery, Aerospace & Defense, High-Tech & Telecommunications), and Region - Global Forecast to 2024


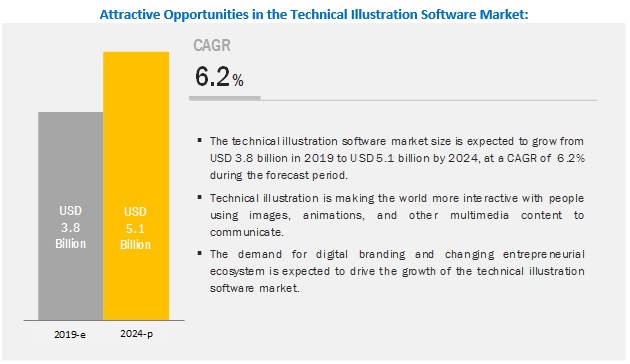
[134 Pages Report] The global technical illustration software market size is expected to grow from USD 3.8 billion in 2019 to USD 5.1 billion by 2024, at a Compound Annual Growth Rate (CAGR) of 6.2% during the forecast period. Changing entrepreneurial ecosystem of various verticals, and the increasing demand for more realistic games with rich graphics and animation is driving big gaming companies to develop new games with enhanced graphics and features. This, in turn, is playing a critical role in augmenting the technical illustration software industry.
Based on the component, the solution segment to hold the largest market size during the forecast period
Technical illustrations include technical drawings and scientific & medical illustrations. Previously, technical illustrators learned and used traditional illustration methods, without the aid of computers. However, technologies have rapidly entered the traditional illustration field and changed the education, work environment, skills, and roles of technical illustrators. Technical illustration software provides users with many features needed to design perfect technical illustrations for their products. The technical illustrators typically use the same software as graphic designers. The two categories of illustration software are raster and vector. Raster-based programs are used primarily for digital painting. These programs enable users to paint or draw as they would with traditional materials.
Managed services to grow with the highest CAGR during the forecast period
Managed services play a significant role, as they are client-specific and help streamline clients� business processes. Managed Service Providers (MSPs) take care of all hardware and software functions, while organizations are only responsible for updating and installing business applications. All the pre- and post-deployment questions and needs of clients are taken care of by managed services. Organizations mostly outsource such services, so that they can focus on their core business functions and increase their efficiency.
Large Enterprises to hold the largest market size during the forecast period
Large Enterprises are the early adopters of the technical illustration software technology, as they have a large number of vendors and service providers in the market, and possess strong budget capabilities. In addition to this, large enterprises use various technical illustration software to design manufacturing parts with proper details. These details help designers and artists test every possible change in the initial phase and make the necessary changes that are required. This is done with the help of digital prototyping, 3D visualization, and simulation. Today, businesses are ready to offer what customers want and create more innovative designs that customers will readily accept. Due to this, technical illustration software is gaining traction. As a result, the technical illustration software market is growing steadily.
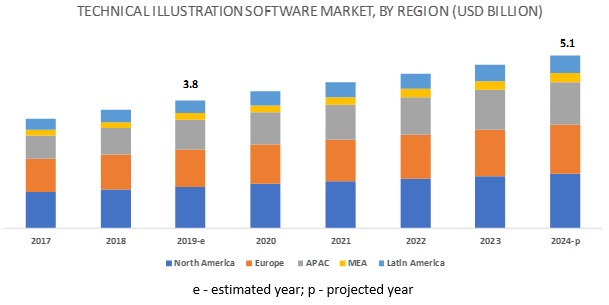
North America to hold the largest market size during the forecast period
North America leads in the adoption of the technical illustration software and provides excellent opportunities for growth of the technical illustrations software market. North America has always been an early adopter of new technology or software, and the North American market grows at a faster rate initially as compared to any other region.
The booming digitalization across industries is driving the demand for technical illustration software in North America along with surging demand for graphics software by businesses. The manufacturing industry in North America is also a great consumer of the Computer-Aided Design/Computer-Aided Engineering (CAD/CAE) software for designing composite styles, optimizing production line, and manufacturing complex parts and associated ancillaries. North America constitutes of developed economies, such as the US and Canada.
Key Market Players
Major vendors in the technical illustration software market include Adobe (US), PTC (US), Lattice Technology (Japan), QuadriSpace (US), Corel (Canada), Canvas GFX, (US), Cyient (India), Ignite Technologies (US), Dassault Syst�mes (France), Autodesk (US), Siemens (Germany), and SAP (Germany).
Scope of the report:
|
Report Metrics |
Details |
|
Market size available for years |
2017�2024 |
|
Base year considered |
2018 |
|
Forecast period |
2019�2024 |
|
Forecast units |
Value (USD) |
|
Segments covered |
Component (Solution and Services), Organization Size (Large Enterprises and SMEs), End User (Automotive & Machinery, Aerospace & Defense, Architecture, Engineering & Construction, High-Tech & Telecommunications, Energy, Oil & Gas, and Others (Medical Technologies and Healthcare, Academic and Education, and Advertising and Entertainment) |
|
Geographies covered |
North America, APAC, Europe, MEA, and Latin America |
|
Companies covered |
Adobe (US), PTC (US), Lattice Technology (Japan), QuadriSpace (US), Corel (Canada), Canvas GFX, (US), Cyient (India), Ignite Technologies (US), Dassault Syst�mes (France), Autodesk (US), Siemens (Germany), and SAP (Germany) |
This research report categorizes the technical illustration software market based on the type, application, organization size, vertical, and region.
By Component:
- Solution
- Services
By Organization Size:
- Large Enterprises
- Small and Medium-Sized Enterprises (SMEs)
By Vertical:
- Automotive & Machinery
- Aerospace & Defense
- Architecture, Engineering & Construction
- High-Tech & Telecommunications
- Energy, Oil & Gas
- Others (Medical Technologies and Healthcare, Academic and Education, and Advertising and Entertainment
By Region:
- North America
- Europe
- APAC
- MEA
- Latin America
Recent Developments:
- In May 2019, Canvas GFX partnered with Spatial, a subsidiary of Dassault Syst�mes. The integration between Canvas and Spatial streamlines converting CAD files from the top CAD software providers into compelling illustrations and visualizations for service documentation.
- In May 2019, Cyient partnered with OneStrand Inc., to offer interactive technical publication solutions. This partnership combines Cyient�s global reach in authoring, illustrating, designing, and converting technical publications with OneStrand�s world-leading S1000D software and technical services. With this partnership, Cyient delivers technical data to global customers in aerospace, defense, and transport industries in a variety of formats based on client needs, whether print or electronic delivery. Also, clients leverage the new services across the product life cycle and better manage engineering technical data from initial creation to archiving.
- In March 2018, PTC launched Creo 5.0, the latest release of its Creo Computer-aided Design (CAD) software, which enables users to go from concept to manufacturing in one design environment. Creo enables companies to accelerate product innovation and build better products faster by reusing the best designs and replacing assumptions with facts.
Key Questions Addressed by the Report:
- Where would all these developments take the industry in the mid to long term?
- What are the upcoming industry solutions for the technical illustration software market?
- Which are the major factors expected to drive the market?
- Which region would offer high growth for vendors in the market?
- Which service would gain the highest market share in the technical illustration software market?
Frequently Asked Questions (FAQ):
What is technical illustration software?
Technical illustration is a field of graphic design that uses and dynamic images to explain the nature of technical relationships; it is used for design and illustration purposes. Technical illustration is a graphical or image representation of a product, which is used in a variety of documents throughout the manufacturing process. It provides a more simplified view and is used in part lists instructional diagram.
What is the projected market value of the global technical illustration software market?
The technical illustration software market is expected to grow from USD 3.8 billion in 2019 to USD 5.1 billion by 2024.
What is the estimated growth rate of the global technical illustration software market?
The global technical illustration software market is projected to register a moderate 6.2% CAGR in the forecast period.
Which segment of the global technical illustration software market expected to witness the highest growth?
Solution segment is expected to grow as the fastest-growing segment during the forecast period.
Who are the key players operative in the global market?
Adobe, PTC, Lattice Technology, QuadriSpace, Corel, Canvas GFX, Cyient, Ignite Technologies, Dassault Syst�mes, Autodesk, Siemens, and SAP. .
To speak to our analyst for a discussion on the above findings, click Speak to Analyst
 Exclusive indicates content/data unique to MarketsandMarkets and not available with any competitors.
Table of Contents
1 Introduction (Page No. - 16)
1.1 Objectives of the Study
1.2 Market Definition
1.2.1 Inclusion and Exclusion
1.3 Market Scope
1.3.1 Market Segmentation
1.4 Years Considered for the Study
1.5 Currency Considered
1.6 Stakeholders
2 Research Methodology (Page No. - 20)
2.1 Research Data
2.1.1 Secondary Data
2.1.2 Primary Data
2.1.2.1 Breakup of Primary Profiles
2.1.2.2 Key Industry Insights
2.2 Market Breakup and Data Triangulation
2.3 Market Size Estimation
2.3.1 Top-Down Approach
2.3.2 Bottom-Up Approach
2.4 Market Forecast
2.5 Competitive Leadership Mapping Methodology
2.6 Assumptions for the Study
2.7 Limitations of the Study
3 Executive Summary (Page No. - 27)
4 Premium Insights (Page No. - 29)
4.1 Attractive Opportunities in the Technical Illustration Software Market
4.2 Global Market: Market Share of Components and Top 2 Regions
4.3 Technical Illustration Software Market, By Region
4.4 Market: Investment Scenario
5 Market Overview and Industry Trends (Page No. - 31)
5.1 Introduction
5.2 Market Dynamics
5.2.1 Drivers
5.2.1.1 Changing Entrepreneurial Ecosystem of Various Verticals
5.2.1.2 Booming Entertainment Vertical
5.2.2 Restraints
5.2.2.1 Increasing Competition in the Technical Illustration Software Marketspace
5.2.3 Opportunities
5.2.3.1 Emerging Opportunities Within Medical and Fashion Verticals
5.2.4 Challenges
5.2.4.1 Lack of Skilled Professionals for Technical Illustration Software
5.3 Use Cases
5.3.1 Use Case: Adobe
5.3.2 Use Case: Adobe
5.3.3 Use Case: CorelDraw
5.4 Impact of Disruptive Technologies
5.4.1 Artificial Intelligence
5.4.2 Internet of Things
6 Technical Illustration Software Market, By Type (Page No. - 36)
6.1 Introduction
6.2 Bitmap/Raster
6.3 Vector
7 Technical Illustration Software Market, By Technology (Page No. - 37)
7.1 Introduction
7.2 2D Technology
7.3 3D Technology
8 Technical Illustration Software Market, By Component (Page No. - 38)
8.1 Introduction
8.2 Solution
8.2.1 Technical Illustration Software Enables Enterprises to Design Perfect Technical Illustrations for Products
8.3 Services
8.3.1 Professional Services
8.3.1.1 From Advisory and Process Consulting to Implementation and Support, Professional Service Experts Ensure Users Get Superior Value for Technology Investments
8.3.2 Managed Services
8.3.2.1 Managed Services Focus on Improving Business Operations and Reducing Unnecessary Expenses and Overheads
9 Technical Illustration Software Market, By Organization Size (Page No. - 44)
9.1 Introduction
9.2 Large Enterprises
9.2.1 Increasing Adoption of Technical Illustration Software and Associated Services Among Large Enterprises to Drive the Market Growth
9.3 Small and Medium-Sized Enterprises
9.3.1 Adaptability of New Technologies to Drive the Deployment of Technical Illustration Software Among Small and Medium-Sized Enterprises
10 Technical Illustration Software Market, By End User (Page No. - 48)
10.1 Introduction
10.2 High-Tech and Telecommunications
10.2.1 Technical Illustration Software Being Used Worldwide By High-Tech and Telecommunications Enterprises to Create Effective Technical Illustrations
10.3 Aerospace and Defense
10.3.1 Increasing Cgi Content, 3D Graphics, and Animation in Military, Aerospace, and Naval Forces to Drive the Adoption of Technical Illustration Software
10.4 Automotive and Machinery
10.4.1 Increasing Need to Significantly Reduce the Production Time and Enhance the Overall Manufacturing Efficiency to Drive the Technical Illustration Software Demand in Automotive and Machinery Industry
10.5 Architecture, Engineering and Construction
10.5.1 Technical Illustration Software Offers the Ability to Clearly Communicate and Create Standard Planning Diagrams for Architects and Build Clear Picture of Projection Phase
10.6 Energy, Oil and Gas
10.6.1 Growing Need for Creating Innovative and Precise Designs to Drive the Adoption of Technical Illustration Software Among Energy, Oil and Gas Companies
10.7 Others
11 Technical Illustration Software Market, By Region (Page No. - 56)
11.1 Introduction
11.2 North America
11.2.1 United States
11.2.1.1 Need for High Quality Products and Growth in Operational Efficiency Leads to Maximum Adoption of Technical Illustration Software in the US
11.2.2 Canada
11.2.2.1 Enterprises in Canada are Adopting High-End Software Owing to Benefits of Cutting-Edge Technologies for Enhancing and Optimizing Production
11.3 Europe
11.3.1 United Kingdom
11.3.1.1 Need for Improving the Efficiency of Machines to Drive the Adoption of Market in the UK
11.3.2 Germany
11.3.2.1 Increasing Investments of German Government in Industrial Automation to Drive the Market
11.3.3 Rest of Europe
11.4 Asia Pacific
11.4.1 China
11.4.1.1 Adoption of Industrial Automation in China is Increasing the Growth of Technical Illustration Software Market
11.4.2 Japan
11.4.2.1 Japanese Government Initiatives to Explore Advanced Technology for Maintaining Competitive Edge in the Market to Drive the Market
11.4.3 Rest of Asia Pacific
11.5 Middle East and Africa
11.5.1 Kingdom of Saudi Arabia
11.5.1.1 Rise in the Popularity of Film Festivals and a Growth in the Number of Animation Studios is Driving Market
11.5.2 Rest of Middle East and Africa
11.6 Latin America
11.6.1 Brazil
11.6.1.1 Significant Growth in 3D Animations for Television to Drive the Market in Brazil
11.6.2 Rest of Latin America
12 Competitive Landscape (Page No. - 97)
12.1 Overview
12.2 Competitive Leadership Mapping
12.2.1 Visionary Leaders
12.2.2 Dynamic Differentiators
12.2.3 Innovators
12.2.4 Emerging Companies
12.3 Competitive Scenario
12.4 Ranking of Key Players
12.5 Competitive Situation and Trends
12.5.1 New Product Launches
12.5.2 Partnerships
12.5.3 Acquisitions
13 Company Profiles (Page No. - 104)
13.1 Introduction
(Business Overview, Products Offered, Recent Developments, SWOT Analysis, and MnM View)*
13.2 Lattice Technology
13.3 QuadriSpace
13.4 PTC
13.5 Adobe Systems
13.6 Corel
13.7 Canvas GFX
13.8 Cyient
13.9 Ignite
13.10 Dassault Syst�mes
13.11 Autodesk
13.12 Siemens
13.13 SAP
13.14 Quark
13.15 Harita Techserv
13.16 The Technical Drawing Company
13.17 Oneil
13.18 Maxam Design
13.19 MAA Illustrations
13.20 Illustration Limited
13.21 Nbg Drafting & Design
*Details on Business Overview, Products Offered, Recent Developments, SWOT Analysis, and MnM View Might Not be Captured in Case of Unlisted Companies.
14 Appendix (Page No. - 129)
14.1 Discussion Guide
14.2 Knowledge Store: MarketsandMarkets Subscription Portal
14.3 Available Customizations
14.4 Related Reports
14.5 Author Details
List of Tables (107 Tables)
Table 1 United States Dollar Exchange Rate, 2016�2018
Table 2 Factor Analysis
Table 3 Technical Illustration Software Market Size and Growth Rate, 2017�2024 (USD Million, Y-O-Y %)
Table 4 Market Size, By Component, 2017�2024 (USD Million)
Table 5 Solution: Market Size, By Region, 2017�2024 (USD Million)
Table 6 Services: Market Size, By Region, 2017�2024 (USD Million)
Table 7 Services: Market Size, By Type, 2017�2024 (USD Million)
Table 8 Professional Services: Market Size, By Region, 2017�2024 (USD Million)
Table 9 Managed Services: Market Size, By Region, 2017�2024 (USD Million)
Table 10 Technical Illustration Software Market Size, By Organization Size, 2017�2024 (USD Million)
Table 11 Large Enterprises: Market Size, By Region, 2017�2024 (USD Million)
Table 12 Small and Medium-Sized Enterprises: Market Size, By Region, 2017�2024 (USD Million)
Table 13 Technical Illustration Software Market Size, By End User, 2017�2024 (USD Million)
Table 14 High-Tech and Telecommunications: Market Size, By Region, 2017�2024 (USD Million)
Table 15 Aerospace and Defense: Market Size, By Region, 2017�2024 (USD Million)
Table 16 Automotive and Machinery: Market Size, By Region, 2017�2024 (USD Million)
Table 17 Architecture, Engineering and Construction: Market Size, By Region, 2017�2024 (USD Million)
Table 18 Energy, Oil, and Gas: Market Size, By Region, 2017�2024 (USD Million)
Table 19 Others: Market Size, By Region, 2017�2024 (USD Million)
Table 20 Technical Illustration Software Market Size, By Region, 2017�2024 (USD Million)
Table 21 North America: Technical Illustration Software Market Size, By Component, 2017�2024 (USD Million)
Table 22 North America: Market Size, By Service, 2017�2024 (USD Million)
Table 23 North America: Market Size, By Organization Size, 2017�2024 (USD Million)
Table 24 North America: Market Size, By End User, 2017�2024 (USD Million)
Table 25 North America: Automotive and Machinery Market Size, By Organization Size, 2017�2024 (USD Million)
Table 26 North America: Aerospace and Defense Market Size, By Organization Size, 2017�2024 (USD Million)
Table 27 North America: Architecture, Engineering and Construction Market Size, By Organization Size, 2017�2024 (USD Million)
Table 28 North America: High-Tech and Telecommunications Market Size, By Organization Size, 2017�2024 (USD Million)
Table 29 North America: Energy, Oil and Gas Market Size, By Organization Size, 2017�2024 (USD Million)
Table 30 North America: Others Market Size, By Organization Size, 2017�2024 (USD Million)
Table 31 North America: Market Size, By Country, 2017�2024 (USD Million)
Table 32 United States: Technical Illustration Software Market Size, By Component, 2017�2024 (USD Million)
Table 33 United States: Market Size, By Service, 2017�2024 (USD Million)
Table 34 United States: Market Size, By Organization Size, 2017�2024 (USD Million)
Table 35 United States: Market Size, By End User, 2017�2024 (USD Million)
Table 36 Europe: Technical Illustration Software Market Size, By Component, 2017�2024 (USD Million)
Table 37 Europe: Market Size, By Service, 2017�2024 (USD Million)
Table 38 Europe: Market Size, By Organization Size, 2017�2024 (USD Million)
Table 39 Europe: Market Size, By End User, 2017�2024 (USD Million)
Table 40 Europe: Automotive and Machinery Market Size, By Organization Size, 2017�2024 (USD Million)
Table 41 Europe: Aerospace and Defense Market Size, By Organization Size, 2017�2024 (USD Million)
Table 42 Europe: Architecture, Engineering and Construction Market Size, By Organization Size, 2017�2024 (USD Million)
Table 43 Europe: High-Tech and Telecommunications Market Size, By Organization Size, 2017�2024 (USD Million)
Table 44 Europe: Energy, Oil and Gas Market Size, By Organization Size, 2017�2024 (USD Million)
Table 45 Europe: Others Market Size, By Organization Size, 2017�2024 (USD Million)
Table 46 Europe: Market Size, By Country, 2017�2024 (USD Million)
Table 47 United Kingdom: Technical Illustration Software Market Size, By Component, 2017�2024 (USD Million)
Table 48 United Kingdom: Market Size, By Service, 2017�2024 (USD Million)
Table 49 United Kingdom: Market Size, By Organization Size, 2017�2024 (USD Million)
Table 50 United Kingdom: Market Size, By End User, 2017�2024 (USD Million)
Table 51 Germany: Technical Illustration Software Market Size, By Component, 2017�2024 (USD Million)
Table 52 Germany: Market Size, By Service, 2017�2024 (USD Million)
Table 53 Germany: Market Size, By Organization Size, 2017�2024 (USD Million)
Table 54 Germany: Market Size, By End User, 2017�2024 (USD Million)
Table 55 Asia Pacific: Technical Illustration Software Market Size, By Component, 2017�2024 (USD Million)
Table 56 Asia Pacific: Market Size, By Service, 2017�2024 (USD Million)
Table 57 Asia Pacific: Market Size, By Organization Size, 2017�2024 (USD Million)
Table 58 Asia Pacific: Market Size, By End User, 2017�2024 (USD Million)
Table 59 Asia Pacific: Automotive and Machinery Market Size, By Organization Size, 2017�2024 (USD Million)
Table 60 Asia Pacific: Aerospace and Defense Market Size, By Organization Size, 2017�2024 (USD Million)
Table 61 Asia Pacific: Architecture, Engineering and Construction Market Size, By Organization Size, 2017�2024 (USD Million)
Table 62 Asia Pacific: High-Tech and Telecommunications Market Size, By Organization Size, 2017�2024 (USD Million)
Table 63 Asia Pacific: Energy, Oil and Gas Market Size, By Organization Size, 2017�2024 (USD Million)
Table 64 Asia Pacific: Others Market Size, By Organization Size, 2017�2024 (USD Million)
Table 65 Asia Pacific: Market Size, By Country, 2017�2024 (USD Million)
Table 66 China: Technical Illustration Software Market Size, By Component, 2017�2024 (USD Million)
Table 67 China: Market Size, By Service, 2017�2024 (USD Million)
Table 68 China: Market Size, By Organization Size, 2017�2024 (USD Million)
Table 69 China: Market Size, By End User, 2017�2024 (USD Million)
Table 70 Japan: Technical Illustration Software Market Size, By Component, 2017�2024 (USD Million)
Table 71 Japan: Market Size, By Service, 2017�2024 (USD Million)
Table 72 Japan: Market Size, By Organization Size, 2017�2024 (USD Million)
Table 73 Japan: Market Size, By End User, 2017�2024 (USD Million)
Table 74 Middle East and Africa: Technical Illustration Software Market Size, By Component, 2017�2024 (USD Million)
Table 75 Middle East and Africa: Market Size, By Service, 2017�2024 (USD Million)
Table 76 Middle East and Africa: Market Size, By Organization Size, 2017�2024 (USD Million)
Table 77 Middle East and Africa: Market Size, By End User, 2017�2024 (USD Million)
Table 78 Middle East and Africa: Automotive and Machinery Market Size, By Organization Size, 2017�2024 (USD Million)
Table 79 Middle East and Africa: Aerospace and Defense Market Size, By Organization Size, 2017�2024 (USD Million)
Table 80 Middle East and Africa: Architecture, Engineering and Construction Market Size, By Organization Size, 2017�2024 (USD Million)
Table 81 Middle East and Africa: High-Tech and Telecommunications Market Size, By Organization Size, 2017�2024 (USD Million)
Table 82 Middle East and Africa: Energy, Oil and Gas Market Size, By Organization Size, 2017�2024 (USD Million)
Table 83 Middle East and Africa: Others Market Size, By Organization Size, 2017�2024 (USD Million)
Table 84 Middle East and Africa: Market Size, By Country, 2017�2024 (USD Million)
Table 85 Kingdom of Saudi Arabia: Technical Illustration Software Market Size, By Component, 2017�2024 (USD Million)
Table 86 Kingdom of Saudi Arabia: Market Size, By Service, 2017�2024 (USD Million)
Table 87 Kingdom of Saudi Arabia: Market Size, By Organization Size, 2017�2024 (USD Million)
Table 88 Kingdom of Saudi Arabia: Market Size, By End User, 2017�2024 (USD Million)
Table 89 Latin America: Technical Illustration Software Market Size, By Component, 2017�2024 (USD Million)
Table 90 Latin America: Market Size, By Service, 2017�2024 (USD Million)
Table 91 Latin America: Market Size, By Organization Size, 2017�2024 (USD Million)
Table 92 Latin America: Market Size, By End User, 2017�2024 (USD Million)
Table 93 Latin America: Automotive and Machinery Market Size, By Organization Size, 2017�2024 (USD Million)
Table 94 Latin America: Aerospace and Defense Market Size, By Organization Size, 2017�2024 (USD Million)
Table 95 Latin America: Architecture, Engineering and Construction Market Size, By Organization Size, 2017�2024 (USD Million)
Table 96 Latin America: High-Tech and Telecommunications Market Size, By Organization Size, 2017�2024 (USD Million)
Table 97 Latin America: Energy, Oil and Gas Market Size, By Organization Size, 2017�2024 (USD Million)
Table 98 Latin America: Others Market Size, By Organization Size, 2017�2024 (USD Million)
Table 99 Latin America: Market Size, By Country, 2017�2024 (USD Million)
Table 100 Brazil: Technical Illustration Software Market Size, By Component, 2017�2024 (USD Million)
Table 101 Brazil: Market Size, By Service, 2017�2024 (USD Million)
Table 102 Brazil: Market Size, By Organization Size, 2017�2024 (USD Million)
Table 103 Brazil: Market Size, By End User, 2017�2024 (USD Million)
Table 104 Evaluation Criteria
Table 105 New Product Launches, 2016�2019
Table 106 Partnerships, 2019
Table 107 Acquisitions, 2018�2019
List of Figures (33 Figures)
Figure 1 Technical Illustration Software Market: Research Design
Figure 2 Market: Top-Down and Bottom-Up Approaches
Figure 3 Competitive Leadership Mapping Matrix: Criteria Weightage
Figure 4 Market, Top 3 Segments, 2019
Figure 5 Solution Segment to Account for a Higher Market Share in 2019
Figure 6 Demand for Digital Branding and Changing Entrepreneurial Ecosystem to Drive the Market Growth
Figure 7 Solution Segment and North America to Account for the Highest Market Shares in 2019
Figure 8 Asia Pacific to Grow at the Highest CAGR During the Forecast Period
Figure 9 North America to Emerge as the Best Market for Investments Over the Next 5 Years
Figure 10 Drivers, Restraints, Opportunities, and Challenges: Technical Illustration Software Market
Figure 11 Services Segment to Grow at a Higher CAGR During the Forecast Period
Figure 12 Managed Services Segment to Grow at a Higher CAGR During the Forecast Period
Figure 13 Small and Medium-Sized Enterprises to Grow at a Higher CAGR During the Forecast Period
Figure 14 High-Tech and Telecommunications End User to Grow at the Highest CAGR During the Forecast Period
Figure 15 Asia Pacific to Grow at the Highest CAGR During the Forecast Period
Figure 16 North America: Market Snapshot
Figure 17 Asia Pacific: Market Snapshot
Figure 18 Technical Illustration Software Market (Global), Competitive Leadership Mapping, 2018
Figure 19 Key Developments By Leading Players in the Market (2018�2019)
Figure 20 Ranking of Key Players in the Market, 2018
Figure 21 Market Evaluation Framework
Figure 22 Lattice Technology: SWOT Analysis
Figure 23 PTC: Company Snapshot
Figure 24 PTC: SWOT Analysis
Figure 25 Adobe Systems: Company Snapshot
Figure 26 Corel Corporation: SWOT Analysis
Figure 27 Cyient: Company Snapshot
Figure 28 Cyient: SWOT Analysis
Figure 29 Dassault Syst�mes: Company Snapshot
Figure 30 Cyient: SWOT Analysis
Figure 31 Autodesk: Company Snapshot
Figure 32 Siemens: Company Snapshot
Figure 33 SAP: Company Snapshot
The study involved four major steps to estimate the current market size for the technical illustration software market. The exhaustive secondary research was done to collect information on the market, the peer market, and the parent market, which is the first step. The next step was to validate these findings, assumptions, and sizing with industry experts across the value chain through primary research. Both top-down and bottom-up approaches were employed to estimate the complete market size. After that, market breakdown and data triangulation were used to estimate the market size of segments and subsegments.
Secondary Research
In the secondary research process, various secondary sources, such as Hoovers, Bloomberg BusinessWeek, and Dun & Bradstreet, have been referred to, to identify and collect information for this study. These secondary sources included annual reports, press releases, and investor presentations of companies; white papers, technology journals, and certified publications; and articles from recognized authors, directories, and databases.
Primary Research
The technical illustration software market comprises several stakeholders, such as platform and service providers, support and maintenance service providers, manufacturing enterprises, technology consultants, system design and development vendors, and logistics and supply chain management providers. The extensive primary research was conducted to gather information, and verify and validate the critical numbers arrived at. Primary research was also conducted to identify the segmentation types; industry trends; key players; the competitive landscape of different market players; and key market dynamics, such as drivers, restraints, opportunities, challenges, industry trends, and key strategies. Following is the breakdown of primary respondents:
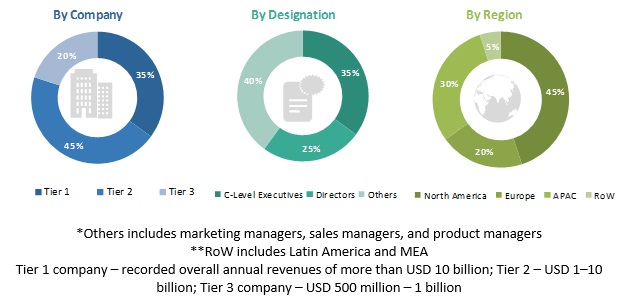
To know about the assumptions considered for the study, download the pdf brochure
Market Size Estimation
Both top-down and bottom-up approaches were used to estimate and validate the overall size of the technical illustration software market. These methods were also used extensively to estimate the size of various subsegments in the market. The research methodology used to estimate the market size includes the following:
- The key players in the industry and markets have been identified through extensive secondary research.
- The technical illustration software market expenditure across regions, along with the geographic split in various segments, have been considered to arrive at the overall market size.
- All percentage shares, splits, and breakdowns have been determined using secondary sources and verified through primary sources.
Data Triangulation
After arriving at the overall market size, using the market size estimation processes as explained above, the market was split into several segments and subsegments. To complete the overall market engineering process and arrive at the exact statistics of each market segment and subsegment, data triangulation, and market breakup procedures were employed, wherever applicable. The data was triangulated by studying various factors and trends from both the demand and supply sides in the technical illustration software industry.
Report Objectives:
- To define, describe, and forecast the technical illustration software market by type, component, organization size, end user, and region
- To provide detailed information about the major factors (drivers, restraints, opportunities, and industry-specific challenges) influencing the market growth
- To analyze the opportunities in the market and provide details of the competitive landscape for stakeholders and market leaders
- To forecast the market size of the market segments with respect to 4 main regions, namely, North America, Europe, Asia Pacific (APAC), and Rest of the World (RoW)
- To profile the key players and comprehensively analyze their market rankings and core competencies1
- To analyze competitive developments, such as partnerships, new product launches, and mergers and acquisitions, in the technical illustration software market
1. Core competencies of the companies have been captured in terms of their key developments and key strategies adopted by them to sustain their positions in the market.
Available Customizations
With the given market data, MarketsandMarkets offers customizations as per the company�s specific needs. The following customization options are available for the report:
Company Information
- Detailed analysis and profiling of additional market players


Growth opportunities and latent adjacency in Technical Illustration Software Market