
Testing, Inspection, and Certification Market | TIC Market Size, Share & Trends 2030

Testing, Inspection, and Certification (TIC) Market Size, Share & Trends by Service Type (Testing, Inspection, Certification), Source (In-house, Outsourced), Application (Consumer Goods & Retail, Agriculture & Food, Chemical, Energy & Power) - Global Forecast to 2030


OVERVIEW
Source: Secondary Research, Interviews with Experts, MarketsandMarkets Analysis
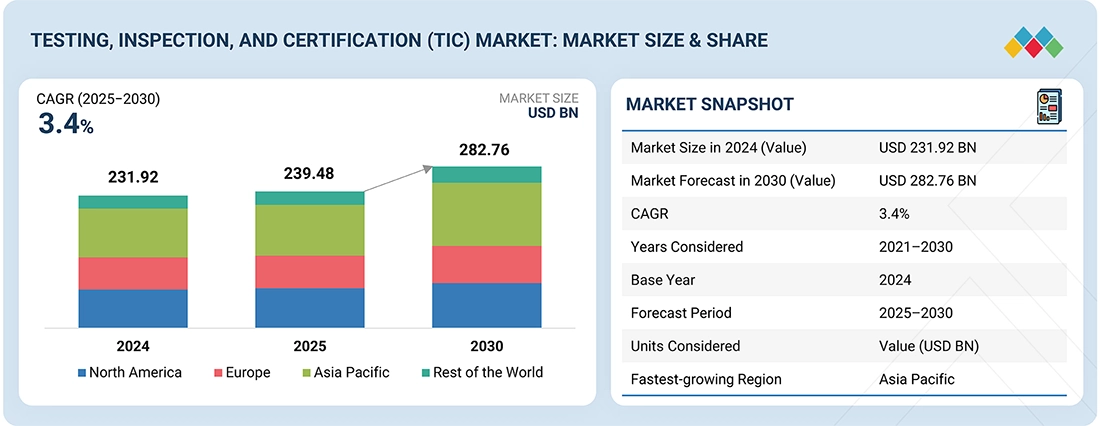
The global testing, inspection, and certification (TIC) market size is expected to grow from USD 239.48 billion in 2025 to USD 282.76 billion by 2030, at a CAGR of 3.4%. Growth is driven by stricter regulatory standards, increasing consumer focus on safety and quality, and the expansion of automotive (EVs), energy, healthcare, and manufacturing sectors. The digitalization of TIC services including automation, remote auditing, and AI-based inspection—is enhancing operational efficiency and transparency. Governments and regulatory authorities worldwide are enforcing stricter compliance frameworks, further increasing demand for certified assurance. Additionally, sustainability certifications and ESG compliance audits are emerging as new growth avenues, while global trade expansion continues to support the market’s upward trend.
KEY TAKEAWAYS
-
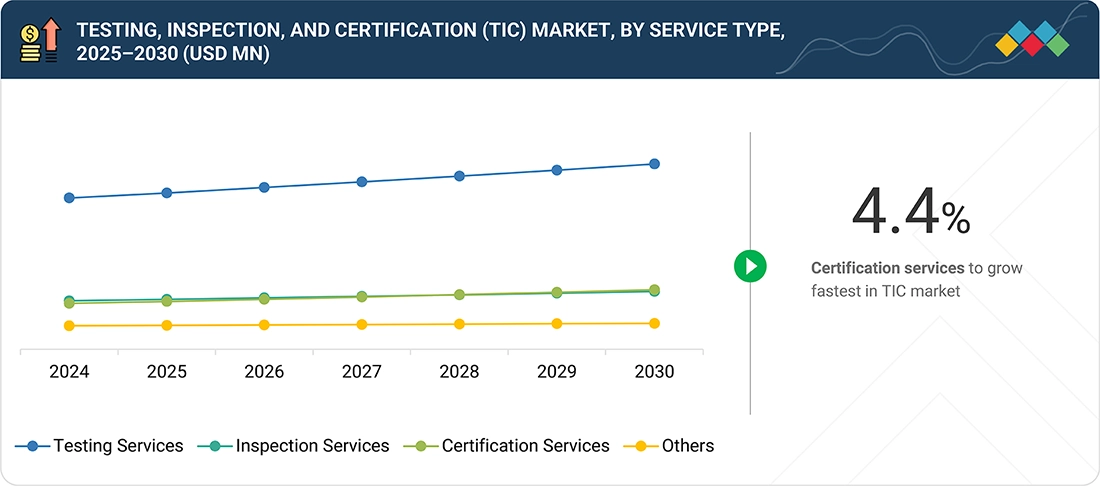
BY SERVICE TYPECertification services are likely to grow fastest, driven by rising global compliance requirements, ESG verification, and sustainability audits. Testing and inspection services remain dominant, supported by increasing product complexity, stricter quality standards, and digitalization through AI and automation in verification processes.
-
BY SOURCEOutsourced TIC services lead the market as industries seek third-party expertise for compliance, cost efficiency, and global accreditation. In-house services remain vital in high-risk sectors like energy and aerospace, ensuring process control and faster internal quality validation.
-
BY APPLICATIONGrowth is driven by the automotive, energy, consumer goods, and healthcare sectors. Increasing EV certification, renewable energy testing, and tighter food and pharma standards are boosting TIC adoption across industries focused on safety, sustainability, and regulatory compliance.
-
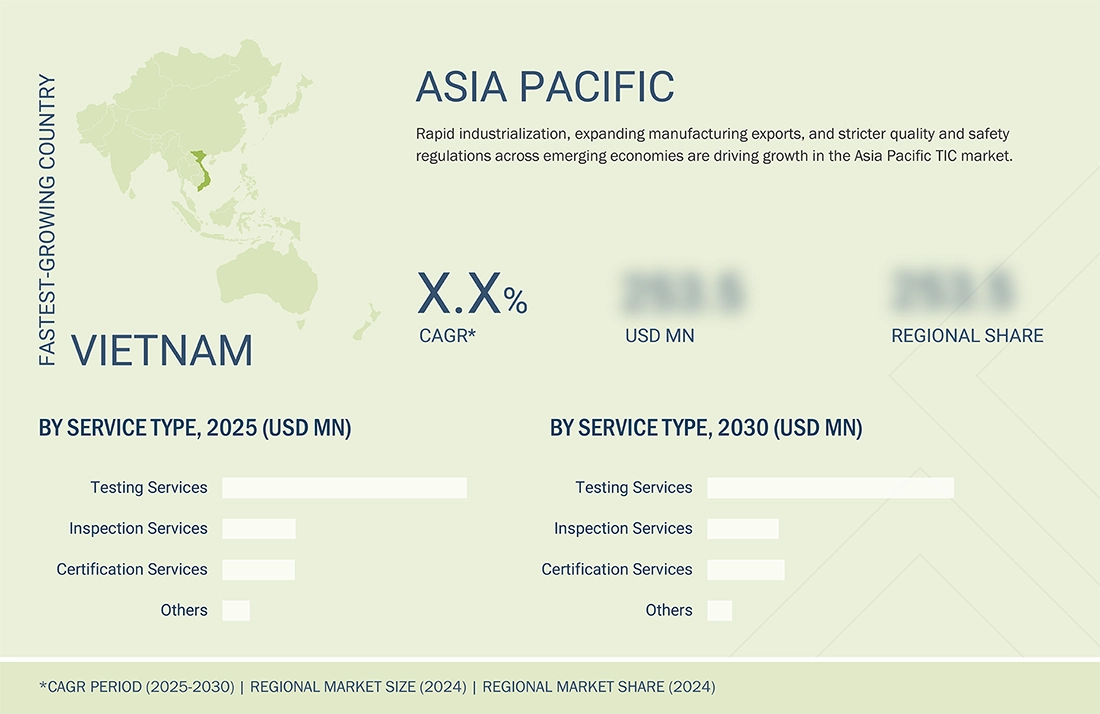
BY REGIONAsia Pacific leads due to industrialization, exports, and strict compliance enforcement in China, India, and Japan. Europe progresses with sustainability certifications, while North America dominates in digital TIC adoption and advanced manufacturing compliance programs.
-
COMPETITIVE LANDSCAPEMajor players such as SGS, Bureau Veritas, Intertek, TÜV SÜD, and DEKRA focus on digital inspections, sustainability certifications, and international standardization. Emerging firms prioritize automation, remote audits, and AI-driven analytics to grow their competitive edge.
The TIC market is expected to grow steadily, fueled by increasing regulatory compliance, consumer safety awareness, and global trade liberalization. Growth is further supported by digital transformation, incorporating AI, IoT, and blockchain for faster and more transparent verification. Rising emphasis on sustainability certification, product traceability, and ESG auditing highlights TIC’s evolving role as a crucial enabler of quality, safety, and trust across global industries.
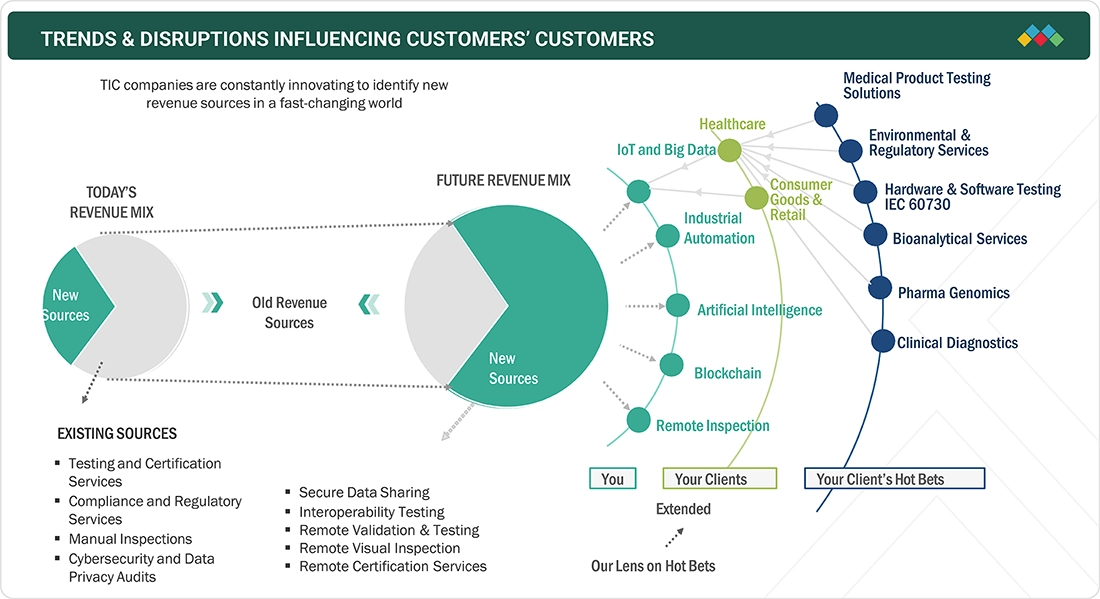
TRENDS & DISRUPTIONS IMPACTING CUSTOMERS' CUSTOMERS
The impact of changing client expectations is transforming revenue streams in the TIC market size, as industries increasingly focus on digital assurance, sustainability, and data-driven compliance. Traditional service models based on manual testing and physical audits are being replaced by AI-enabled inspections, remote validation, blockchain-based traceability, and ESG certification frameworks. This shift is creating new revenue opportunities for TIC providers through automation, interoperability testing, and real-time monitoring, while enhancing transparency, operational efficiency, and global standardization across sectors such as automotive, energy, consumer goods, and healthcare.
Source: Secondary Research, Interviews with Experts, MarketsandMarkets Analysis
MARKET DYNAMICS
Level
-
Rising adoption of connected technologies to improve manufacturing

-
Rise of counterfeit and fraudulent products

Level
-
Lack of uniformity in global TIC standards

-
High cost of TIC services due to varying standards and regulations across geographies

Level
-
Emphasis on achieving net-zero emissions

-
Implementation of Industry 4.0

Level
-
Disrupted supply chains due to geopolitical tensions

Source: Secondary Research, Interviews with Experts, MarketsandMarkets Analysis
Driver: Rising adoption of connected technologies to improve manufacturing
The increasing integration of Internet of Things (IoT), artificial Intelligence (AI), and automation within the manufacturing sector is fundamentally transforming quality assurance and compliance procedures. Connected technologies facilitate real-time monitoring, predictive maintenance, and data-driven inspections, thereby enhancing operational efficiency. This transition is driving the demand for sophisticated testing, inspection, and certification (TIC) solutions that ensure product reliability and adherence to regulatory standards in intelligent manufacturing environments.
Restraint: High cost of TIC services due to varying standards and regulations across geographies
The absence of consistent global standards and complicated certification processes raise operational costs for TIC providers. Companies struggle to adapt to different regional regulations, leading to duplicated testing and extended approval times. These discrepancies limit market growth, especially for SMEs, making TIC services less affordable and accessible across various industries.
Opportunity: Emphasis on achieving net-zero emissions
The global shift toward sustainability and carbon neutrality presents significant opportunities for TIC industry Industries are increasingly seeking verification, auditing, and certification services for ESG compliance, renewable energy, and carbon footprint reduction. As governments tighten environmental regulations, TIC companies play a vital role in validating green claims and supporting transparent sustainability reporting.
Challenge: Disrupted supply chains due to geopolitical tensions
Global trade disruptions and geopolitical conflicts are affecting the continuity of testing and inspection operations. Restrictions on material movement and certification delays have increased supply-side uncertainty. TIC providers are responding with remote auditing, digital inspection platforms, and regional diversification to maintain uninterrupted compliance services amid changing geopolitical conditions.
Testing, Inspection, and Certification (TIC) Market: COMMERCIAL USE CASES ACROSS INDUSTRIES
| COMPANY | USE CASE DESCRIPTION | BENEFITS |
|---|---|---|
 |
Engages third-party inspection and certification agencies for offshore platforms, refinery assets, and pipeline systems under ISO and API standards | Ensures operational safety, environmental compliance, and asset reliability, reducing downtime and regulatory risk |
 |
Employs independent TIC services for battery validation, EV charging safety, and autonomous vehicle component certification | Guarantees product safety and global homologation compliance, accelerates market approvals, and enhances consumer trust |
 |
Utilizes global TIC providers for electrical and automation product certification, EMC testing, and smart grid component validation | Enables worldwide market access, ensures adherence to IEC/CE standards, and strengthens equipment reliability |
 |
Partners with accredited TIC firms for GMP audits, process validation, and quality verification of pharmaceutical manufacturing sites | Maintains compliance with FDA, EMA, and WHO standards, ensuring product safety and reducing recall risks |
 |
Conducts independent food safety audits, ingredient testing, and hygiene inspections under ISO 22000 and HACCP frameworks | Enhances food quality and traceability, prevents contamination incidents, and upholds brand reputation |
Logos and trademarks shown above are the property of their respective owners. Their use here is for informational and illustrative purposes only.
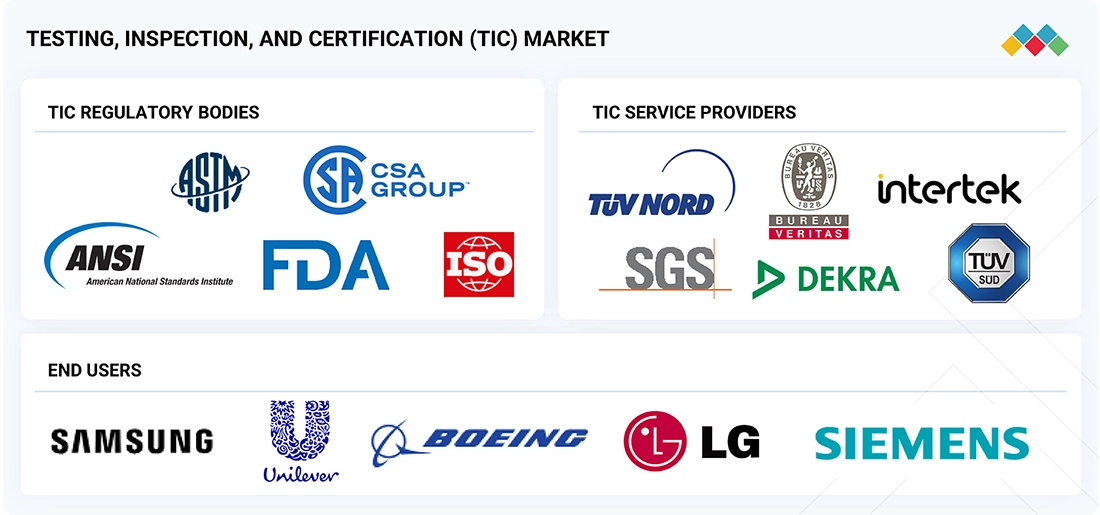
TIC MARKET ECOSYSTEM
The TIC market share features a dynamic ecosystem made up of standard organizations such as ISO, ASTM, and ANSI, regulatory agencies like the FDA, and leading TIC providers including SGS, Bureau Veritas, Intertek, TÜV SÜD, and DEKRA. These organizations work with major end users like Samsung, Boeing, Siemens, LG, and Unilever to ensure quality, safety, and compliance across industries. The ecosystem is further strengthened by data-driven platforms, automation technologies, and digital inspection tools that promote transparency, interoperability, and continued growth. Collectively, these stakeholders establish an integrated framework that supports global trade, speeds up certification processes, and builds trust in product reliability and regulatory compliance.
Logos and trademarks shown above are the property of their respective owners. Their use here is for informational and illustrative purposes only.
MARKET SEGMENTS
Source: Secondary Research, Interviews with Experts, MarketsandMarkets Analysis
Testing, Inspection, and Certification (TIC) Market, By Source
The in-house segment holds the largest market share because many large enterprises prefer to maintain internal testing and compliance departments. This approach ensures better quality control, data confidentiality, and faster turnaround times. Industries such as automotive, aerospace, and energy depend on in-house TIC capabilities to meet their internal standards and protect proprietary technologies.
TIC Market, By Service Type
The testing services segment leads the market, driven by the increasing demand for product validation, material testing, and performance assessment in regulated industries. As safety and environmental standards become more strict, companies are investing significantly in laboratory and field testing to achieve global certifications and guarantee the reliability of products and systems.
Testing, Inspection, and Certification (TIC) Market, By Application
The consumer goods & retail sector holds the largest portion of the Testing, inspection and certification market share, driven by increasing demands for product safety, labeling precision, and quality control. Growing e-commerce, more stringent import regulations, and consumer awareness of certified products have strengthened the role of TIC services in safeguarding brand trust and ensuring compliance worldwide.
REGION
Asia Pacific to hold largest share in global TIC market during forecast period
The Asia Pacific region accounts for the largest share of the TIC industry, fueled by rapid industrialization, growing manufacturing exports, and increased regulatory enforcement across countries like China, India, Japan, and South Korea. The region’s strong position in automotive, electronics, consumer goods, and renewable energy manufacturing drives high demand for quality assurance and compliance testing. Moreover, government initiatives promoting product standardization, safety certification, and sustainable production have further boosted regional TIC adoption. The growing use of digital inspection tools and automation continues to improve service efficiency, positioning Asia Pacific as the global center for TIC growth and innovation.
The North America temperature sensor market is projected to grow from USD 1.84 billion in 2024 to USD 2.11 billion by 2030, registering a CAGR of 2.3%. Strong demand from automotive, aerospace, energy, and semiconductor industries, where precise thermal control is critical. Growth in healthcare and medical device manufacturing, driven by rising diagnostic and continuous monitoring needs, further boosts the deployment of advanced contact and non-contact temperature sensing technologies. The region’s increasing focus on building automation, HVAC efficiency, and regulatory compliance around workplace and equipment safety strengthens demand for integrated temperature sensing solutions.
The Europe Testing, Inspection, and Certification (TIC) market is projected to grow from USD 56.99 billion in 2025 to USD 64.81 billion by 2030, at a CAGR of 2.6% over the forecast period of 2025 to 2030. Growth is supported by Europe’s stringent regulatory environment, including CE marking, MDR and IVDR, REACH, and RoHS, which continue to drive high compliance demand across automotive, energy, healthcare, food, and manufacturing sectors. The adoption of digital inspection models, remote auditing, and AI-enabled quality assessment is enhancing operational efficiency, while the growing emphasis on sustainability and ESG verification is creating new opportunities for certified assurance.
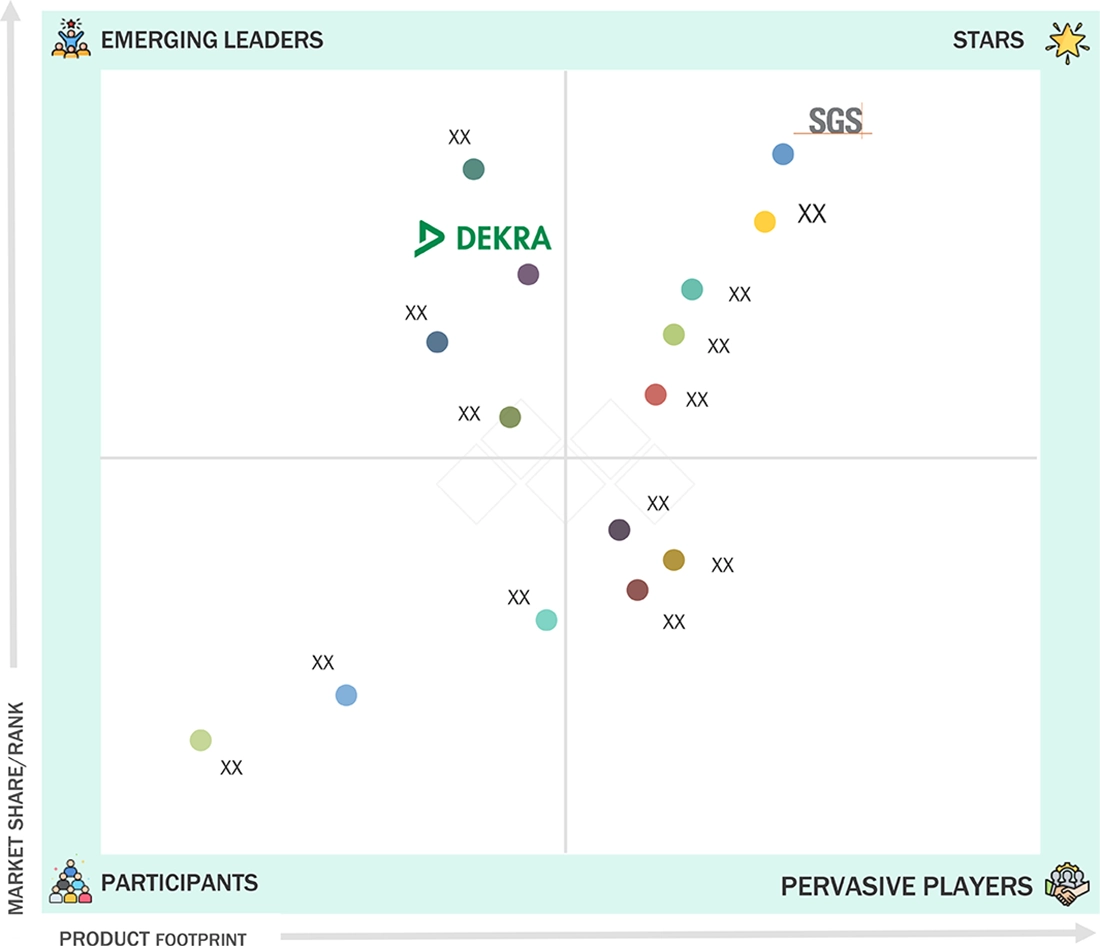
Testing, Inspection, and Certification (TIC) Market: COMPANY EVALUATION MATRIX
In the testing, inspection, and certification (TIC) companies matrix, SGS SA stands out as a Star, combining a dominant global presence with an extensive service portfolio spanning testing, certification, and digital assurance. DEKRA is positioned as an Emerging Leader, expanding rapidly through innovation and sustainability-focused offerings. Several other major players maintain strong footholds within the Pervasive Players category, supported by broad regional operations and sector-specific expertise, while new entrants and niche providers continue to build momentum through digitalization and specialized compliance solutions.
Source: Secondary Research, Interviews with Experts, MarketsandMarkets Analysis
KEY MARKET PLAYERS
MARKET SCOPE
| REPORT METRIC | DETAILS |
|---|---|
| Market Size in 2024 (Value) | USD 231.92 Billion |
| Market Forecast in 2030 (Value) | USD 282.76 Billion |
| Growth Rate | CAGR of 3.4% from 2025-2030 |
| Years Considered | 2021-2030 |
| Base Year | 2024 |
| Forecast Period | 2025-2030 |
| Units Considered | Value (USD Million/Billion) |
| Report Coverage | Revenue forecast, company ranking, competitive landscape, growth factors, and trends |
| Segments Covered |
|
| Regional Scope | North America, Asia Pacific, Europe, and Rest of the World (RoW) |
WHAT IS IN IT FOR YOU: Testing, Inspection, and Certification (TIC) Market REPORT CONTENT GUIDE
DELIVERED CUSTOMIZATIONS
We have successfully delivered the following deep-dive customizations:
| CLIENT REQUEST | CUSTOMIZATION DELIVERED | VALUE ADDS |
|---|---|---|
| Global TIC Service Provider |
|
• Identify regional growth hotspots and service gaps • Support long-term portfolio diversification • Strengthen regional expansion and acquisition strategies |
| Regional TIC Association |
|
• Understand regulatory-driven opportunities • Support advocacy and policy alignment • Highlight cross-country standardization potential |
| Global Consulting Firm (Strategy & Research) |
|
|
| Industrial & Manufacturing Client |
|
|
| Energy & Power Sector Client |
|
|
| Consumer Goods & Retail Client |
|
|
| TIC Technology Partner |
|
|
RECENT DEVELOPMENTS
- February 2025 : Applus+ extended its partnership with EDF for another five years to provide non-destructive testing (NDT) and inspection services across the UK. The contract includes various techniques, such as Ultrasonic Testing (UT), Eddy Current (ECT), Magnetic Flux Leakage (MFL), Phased Array Ultrasonic Testing (PAUT), Pulsed Eddy Current (PEC), and Internal Rotating Inspection System (IRIS), highlighting Applus+’s expertise in advanced inspection solutions.
- January 2025 : XYZ Robotics China Inc. obtained its CE-MD conformity certificate from TÜV Rheinland (China) for its Mobile Manipulation Robot (MMR) RockyOne. This certification confirms compliance with the EU Machinery Directive, allowing market entry across Europe and affirming that the product meets the highest safety and technical standards.
- January 2025 : RTI Laboratories, a US-based testing services company, was acquired by SGS SA under a new purchase agreement. The acquisition enhances SGS’s presence in North America and broadens its certification services portfolio for both commercial and federal standards, allowing for a wider client reach and increased operational capacity.
- December 2024 : Luxury Brand Services became part of Bureau Veritas following its acquisition, which aims to enhance quality assurance and control capabilities in the luxury goods segment. The move combines Bureau Veritas’s expertise with the LEAP | 28 program, supporting the company’s growth across Italy’s fashion and logistics markets.
- October 2024 : TÜV SÜD awarded its first IEEE CertifAIed certification for ethically responsible AI applications to the Austrian logistics startup Digicust GmbH. This certification assesses the ethical accountability, transparency, and safety compliance of AI systems, marking an important milestone in TÜV SÜD’s efforts to promote responsible AI governance.
Table of Contents
 Exclusive indicates content/data unique to MarketsandMarkets and not available with any competitors.
Methodology
The study involved four major activities in estimating the current size of the testing, inspection, and certification (TIC) market. Exhaustive secondary research has been done to collect information on the market, peer market, and parent market. To validate these findings, assumptions, and sizing with industry experts across the supply chain through primary research has been the next step. Both top-down and bottom-up approaches have been employed to estimate the complete market size. After that, market breakdown and data triangulation methods have been used to estimate the market size of segments and subsegments. Secondary and primary sources have been used to identify and collect information for an extensive technical and commercial study of the testing, inspection, and certification (TIC) market.
Secondary Research
Various secondary sources have been referred to in the secondary research process to identify and collect information important for this study. The secondary sources include annual reports, press releases, and investor presentations of companies; white papers; journals and certified publications; and articles from recognized authors, websites, directories, and databases. Secondary research has been conducted to obtain key information about the industry’s supply chain, the market’s value chain, the total pool of key players, market segmentation according to the industry trends (to the bottom-most level), regional markets, and key developments from market- and technology-oriented perspectives. The secondary data has been collected and analyzed to determine the overall market size, further validated by primary research.
Primary Research
Extensive primary research was conducted after gaining knowledge about the current scenario of the testing, inspection, and certification (TIC) market through secondary research. Several primary interviews were conducted with experts from the demand and supply sides across four major regions—North America, Europe, Asia Pacific and RoW. This primary data was collected through questionnaires, emails, and telephonic interviews.
 Market Size, and Share")
Note: RoW mainly comprises the Middle East & Africa, Central America, and South America.
Other designations include product managers, sales managers, and marketing managers.
Three tiers of companies have been defined based on their total revenue as of 2024; tier 3: revenue lesser than USD 500 million; tier 2: revenue between USD 500 million and 1 billion; and tier 1: revenue more than USD 1 billion
To know about the assumptions considered for the study, download the pdf brochure
Market Size Estimation
The bottom-up procedure has been employed to arrive at the overall size of the testing, inspection, and certification (TIC) market.
- More than 40 companies offering testing, inspection, and certification (TIC) services have been identified, and their services have been mapped based on certification service type, application, and region.
- The global testing, inspection, and certification (TIC) market size has been derived through the data sanity method. The revenues of testing, inspection, and certification (TIC) service providers have been analyzed through annual reports and press releases and summed up to derive the overall market size.
- For each company, a percentage has been assigned to the overall revenue to derive the revenues from the testing, inspection, and certification (TIC) segment.
- Each company's percentage has been assigned after analyzing various factors, including service offerings, geographic presence, initiatives, and recent developments/strategies adopted for growth in the testing, inspection, and certification (TIC) market.
- For the CAGR, the market trend analysis of testing, inspection, and certification (TIC) was conducted by understanding the industry penetration rate and the demand for the supply of testing, inspection, and certification (TIC) services in different sectors.
- Estimates at every level were verified and validated by discussing with key opinion leaders, including CXOs, directors, operation managers, and domain experts in MarketsandMarkets.
- Various paid and unpaid information sources, such as annual reports, press releases, white papers, and databases, have been studied.
The top-down approach has been used to estimate and validate the total size of the Testing, inspection, and certification (TIC) market.
- The report focused on top-line investments and expenditures in the ecosystems of various industries. The testing, inspection, and certification (TIC) market has been further segmented based on sourcing type, service type, and application.
- Further information has been derived from the market revenue generated by the key testing, inspection, and certification (TIC) service providers.
- Multiple on-field discussions have been carried out with key opinion leaders from each major company involved in providing testing, inspection, and certification (TIC) services.
- The geographic splits have been estimated using secondary sources based on various factors such as the number of players in a specific country, region, and major applications.
Testing, Inspection, and Certification (TIC) Market : Top-Down and Bottom-Up Approach
 Market Top Down and Bottom Up Approach")
Data Triangulation
After arriving at the overall market size—using the market size estimation processes as explained above—the market has been split into several segments and subsegments. To complete the entire market engineering process and arrive at the exact statistics of each market segment and subsegment, data triangulation and market breakdown procedures have been employed, wherever applicable. The data has been triangulated by studying various factors and trends from the demand and supply sides in the testing, inspection, and certification (TIC) market.
Market Definition
The testing, inspection, and certification (TIC) market comprises organizations and service providers engaged in evaluating the quality, safety, compliance, and performance of products, processes, and systems across various industries. These services are delivered by testing laboratories, inspection agencies, certification bodies, and conformity assessment entities, which conduct evaluations, inspections, and audits to ensure adherence to regulatory standards, industry requirements, and customer specifications. TIC services are instrumental in verifying product quality and safety, supporting regulatory compliance, facilitating trade, and strengthening consumer confidence.
The scope of TIC services includes testing, inspection, certification, and others such as verification, validation, auditing, consulting, technical assistance, training, environmental quality assessment, safety and health evaluation, asset integrity management, and project management. These services are applicable across industries and ensure that products, services, and processes align with national and international standards. The growing emphasis on quality assurance and regulatory compliance has driven the demand for TIC services, reinforcing the need for rigorous assessment frameworks to uphold safety and performance standards in global markets.
Key Stakeholders
- Raw material and testing equipment suppliers
- Research organizations
- Original equipment manufacturers (OEMs)
- Technology standards organizations, forums, alliances, and associations
- Technology investors
- Analysts and strategic business planners
- Government bodies, venture capitalists, and private equity firms
- End users who want to know more about testing, inspection, and certification services and the latest standards in the market
Report Objectives
- To define, describe, and forecast the size of the testing, inspection, and certification (TIC) market By Source, service type, application, and region in terms of value
- To describe and forecast the market size for various segments concerning four key regions, namely North America, Europe, Asia Pacific, and RoW in terms of value
- To provide detailed information regarding the key factors such as drivers, restraints, opportunities, and challenges influencing the growth of the market
- To understand and analyze the impact of evolving technologies on the overall value chain of the testing, inspection, and certification market and upcoming trends in the ecosystem
- To provide macroeconomic outlooks with respect to main regions, namely North America, Europe, Asia Pacific, and RoW
- To provide a detailed overview of the testing, inspection, and certification (TIC) market industry trends, technology trends, use cases, regulatory landscape, and Porter’s five forces.
- To strategically analyze micromarkets for individual growth trends, prospects, and contributions to the total market
- To provide ecosystem analysis, trends/disruptions impacting customer business, technology analysis, pricing analysis, key stakeholders & buying criteria, case study analysis, trade analysis, patent analysis, key conferences & events, Gen AI/ AI impact, and regulations related to the testing, inspection, and certification (TIC) market
- To analyze the opportunities in the market for stakeholders by identifying high-growth segments and detailing the competitive landscape for market players.
- To strategically profile key players and comprehensively analyze their market rankings, core competencies, company valuation and financial metrics, and product/brand comparison, along with detailing the competitive landscape for the market leaders
- To analyze the competitive developments, such as acquisitions, product launches, expansions, agreements, partnerships, and collaboration carried out by market players
- To benchmark players within the market using the proprietary competitive leadership mapping framework, which analyzes market players on various parameters within the broad categories of business strategy excellence and strength of service portfolio
Available Customizations
With the given market data, MarketsandMarkets offers customizations according to the company‘s specific needs. The following customization options are available for the report.
Company Information:
- Detailed analysis and profiling of additional market players (up to five)
Key Questions Addressed by the Report
Need a Tailored Report?
Customize this report to your needs
Get 10% FREE Customization
Customize This ReportPersonalize This Research
- Triangulate with your Own Data
- Get Data as per your Format and Definition
- Gain a Deeper Dive on a Specific Application, Geography, Customer or Competitor
- Any level of Personalization
Let Us Help You
- What are the Known and Unknown Adjacencies Impacting the Testing, Inspection, and Certification (TIC) Market
- What will your New Revenue Sources be?
- Who will be your Top Customer; what will make them switch?
- Defend your Market Share or Win Competitors
- Get a Scorecard for Target Partners

Custom Market Research Services
We Will Customise The Research For You, In Case The Report Listed Above Does Not Meet With Your Requirements
Get 10% Free CustomisationGrowth opportunities and latent adjacency in Testing, Inspection, and Certification (TIC) Market


Lim
Dec, 2022
Interested in New/emerging areas of testing in line with new/emerging technologies .