Top 10 Cellular Analysis Market by Technology (Imaging, PCR, Flow Cytometry, High-content Screening, Blotting, Spectrophotometry), Application (Stem Cell, Cancer, Tissue Engineering) & End User (Biotechnology, Research) - Global Forecast to 2021


[178 Pages Report] The top 10 cellular analysis market is expected to reach USD 41.34 Billion by 2021 from USD 28.66 Billion in 2016, at a CAGR of 7.6% from 2016 to 2021. In this report, the market is classified on the basis of technology, application, end user, and region.
On the basis of technology, the market is segmented into sample preparation technologies, cell imaging techniques, spectrophotometry, flow cytometry, polymerase chain reaction (PCR), blotting, high-content screening, centrifugation, cell counting, and cell microarray technology.
On the basis of application, the market is segmented into stem cell research, biopharmaceutical applications, cancer research, tissue engineering and regenerative medicine, and others applications (genetic counselling, cultures, virology, in vitro diagnostics, and IVF).
Based on end user, the top 10 cellular analysis market is segmented into research laboratories & institutes, cell banks, hospitals & diagnostic laboratories, biotechnology & pharmaceutical companies, and other end users (environmental monitoring organizations, food & beverage manufacturers, blood banks, and forensic laboratories).
Based on region, the market is segmented into North America, Europe, Asia, and the Rest of the World (RoW).
The major players in the top 10 cellular analysis market are Thermo Fisher Scientific Inc. (U.S.), Bio-Rad Laboratories (U.S.), Agilent Technologies (U.S.), Becton, Dickinson and Company (U.S.), Beckman Coulter, Inc. (U.S.), Merck KGaA (Germany), Olympus Corporation (Japan), GE Healthcare (U.S.), Tecan Group (Switzerland), and Nikon Instruments (Japan).
Target Audience for this Report:
- Cell biology associations
- Research & consulting firms
- Distributors of cell-based research products
- Contract manufacturers of cell-based research products
- Biotechnology, biopharmaceutical, and pharmaceutical companies
- Healthcare institutes (hospitals, medical schools, diagnostic centers, cell banks, and outpatient clinics)
- Research institutes and clinical research organizations (CROs)
- Venture capitalists
- Government associations
- Blood banks
Value Addition for the Buyer:
This report aims to provide insights into the top 10 cellular analysis market. It provides valuable information on technology, application, end user, and region of the market. Leading players in the market are profiled to study their product offerings and understand the strategies undertaken by them to be competitive in this market.
The abovementioned information would benefit the buyer by helping them understand the market dynamics. In addition, the forecasts provided in the report will enable firms to understand the trends in this market and better position themselves to capitalize the growth opportunities.
To know about the assumptions considered for the study, download the pdf brochure
Scope of the Report:
This report categorizes the top 10 cellular analysis market into the following segments:
Top 10 Cellular Analysis Market, by Technology
- Cell Imaging Techniques
- Flow Cytometry
- Spectrophotometry
- PCR
- Cell Counting
- Blotting
- High-content Screening
- Sample Preparation Technologies
- Cell Microarray Technology
- Centrifugation
Top 10 Cellular Analysis Market, by Application
- Biopharmaceutical Applications
- Stem Cell Research
- Cancer Research
- Tissue Engineering & Regenerative Medicine
- Other Applications
Top 10 Cellular Analysis Market, by End User
- Research Laboratories and Institutes
- Hospitals and Diagnostic Laboratories
- Cell Banks
- Biotechnology and Pharmaceutical Companies
- Others End Users
Top 10 Cellular Analysis Market, by Region
-
North America
- U.S.
- Canada
-
Europe
- Germany
- France
- Italy
- U.K.
- Spain
- RoE
-
Asia
- Japan
- China
- India
- RoA
- RoW
Customization Options:
- Company Information: Detailed company profiles of five or more market players
- Opportunities Assessment: A detailed report underlining the various growth opportunities presented in the market
The top 10 cellular analysis market is expected to reach USD 41.34 Billion by 2021 from USD 28.66 Billion in 2016, at a CAGR of 7.6% during the forecast period. Cellular analysis is used for cell identification, cell interaction, cell viability, cell proliferation, cell structure study, cell signaling/cell transduction, target identification & validation, cell counting, and quality control. Currently, cellular analysis technologies are used in various phases of the drug discovery process, cancer diagnosis (oncology), blood cell analysis, toxicity testing, personalized medicine, pathogen testing, and other applications. In addition, cellular analysis technologies are extensively used in research institutes for understanding the evolution and development process of various types of cells.
Growth in the market is primarily driven by the availability of corporate and government funding for cell-based research and rising incidence of chronic and infectious diseases. The introduction of technologically advanced products for cell analysis, growing life sciences industry, and increase in healthcare spending are the other factors supporting the growth of this market. However, high installation and implementation costs of cell analysis systems and stringent regulations for their approval are expected to hinder the growth of this market.
Based on technology, the top 10 cellular analysis market is segmented into cell imaging techniques, flow cytometry, spectrophotometry, polymerase chain reaction (PCR), cell counting, blotting, high-content screening, sample preparation technologies, cell microarray technology, and centrifugation. The cell imaging techniques segment dominates the market in 2016. Factors expected to drive the cell imaging techniques market are rising investments in life sciences research and introduction of technologically advanced cell imaging instruments for cell analysis procedures.
On the basis of application, the market is segmented into biopharmaceutical applications, cancer research, stem cell research, tissue engineering and regenerative medicine, and other applications (organ cultures, IVF, virology, in vitro diagnostics, and genetic counselling). In 2016, the biopharmaceutical applications segment is expected to account for the largest share of the market. The large share of this segment can be attributed to the increasing investments by companies for the production of biopharmaceutical products.
On the basis of end user, the market is segmented into hospitals and diagnostic laboratories, research laboratories and institutes, cell banks, biotechnology and pharmaceutical companies, and other end users (food and beverage manufacturers, environmental monitoring organizations, forensic laboratories, and blood banks). The hospitals and diagnostic laboratories segment is expected to account for the largest share of the top 10 cellular analysis market in 2016. Some of the major factors driving the growth of this segment include increasing incidence of chronic and infectious diseases and increasing investments in healthcare systems across the globe.
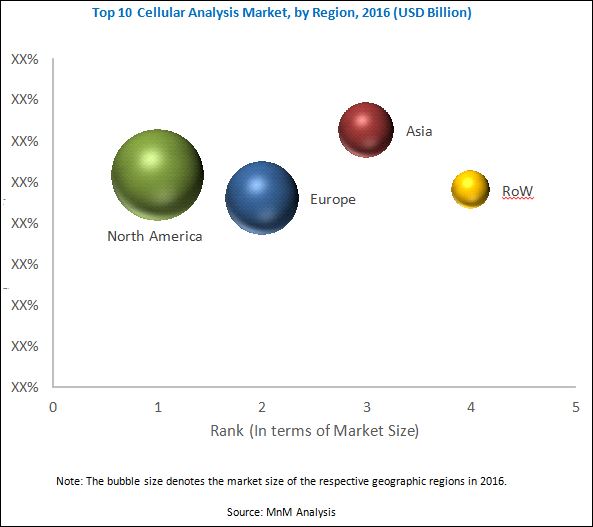
In 2016, the top 10 cellular analysis market is dominated by North America, followed by Europe, Asia, and the RoW. North America is expected to continue to dominate the market in 2021. Asia is projected to witness the highest CAGR, with the growth in this market centered at China, Japan, and India.
The major players in the top 10 cellular analysis market include Thermo Fisher Scientific Inc. (U.S.), Agilent Technologies (U.S.), Becton, Dickinson and Company (U.S.), Bio-Rad Laboratories (U.S.), Beckman Coulter Inc. (U.S.), Merck KGaA (Germany), GE Healthcare (U.S.), Olympus Corporation (Japan), Tecan Group (Switzerland), and Nikon Instruments (Japan).
To speak to our analyst for a discussion on the above findings, click Speak to Analyst
 Exclusive indicates content/data unique to MarketsandMarkets and not available with any competitors.
Table of Contents
1 Introduction (Page No. - 16)
1.1 Objectives of the Study
1.2 Market Definition
1.3 Market Scope
1.4 Markets Covered
1.5 Years Considered for the Study
1.6 Currency
1.7 Limitations
1.8 Stakeholders
2 Research Methodology (Page No. - 19)
2.1 Secondary Data
2.1.1 Key Data From Secondary Sources
2.2 Primary Data
2.2.1 Key Data From Primary Sources
2.3 Market Size Estimation
2.3.1 Bottom-Up Approach
2.3.2 Top-Down Approach
2.4 Market Breakdown & Data Triangulation
2.5 Assumptions for the Study
3 Executive Summary (Page No. - 27)
4 Premium Insights (Page No. - 32)
4.1 Top 10 Cellular Analysis: Market Overview
4.2 Geographic Analysis: Top 10 Cellular Analysis Market, By Technology
4.3 Top 10 Cellular Analysis Market Size, By Application, 2016 vs 2021
5 Market Overview (Page No. - 35)
5.1 Introduction
5.2 Market Dynamics
5.2.1 Drivers
5.2.1.1 Availability of Funding for Cell-Based Research
5.2.1.2 Rising Incidence of Chronic and Infectious Diseases
5.2.1.3 Increasing Number of Patients Suffering From Cancer
5.2.1.4 Technological Advancements in Cell Analysis Instruments
5.2.1.5 Growing Biotechnology and Biopharmaceutical Industries
5.2.2 Restraints
5.2.2.1 High Cost of Cell Analysis Systems
5.2.2.2 Ethical Issues Related to Embryonic Stem Cell Research
5.2.3 Opportunities
5.2.3.1 Emerging Markets
5.2.3.2 Growing Stem Cell Research
5.2.3.3 Emergence of Microfluidics
5.2.4 Challenge
5.2.4.1 Complexities Related to Reagent Development
6 Industry Insights (Page No. - 45)
6.1 Introduction
6.2 Industry Trends
6.2.1 Integration of Basic Flow Cytometry Techniques in Modern Hematology Analyzers
6.2.2 Acquisition of Small Players
6.3 Value Chain Analysis
6.4 Porter’s Five Forces Analysis
6.4.1 Threat of New Entrants
6.4.2 Bargaining Power of Suppliers
6.4.3 Bargaining Power of Buyers
6.4.4 Intensity of Competitive Rivalry
6.4.5 Threat of Substitutes
7 Global Top 10 Cellular Analysis Market, By Technology (Page No. - 50)
7.1 Introduction
7.2 Cell Imaging Technologies
7.3 Flow Cytometry
7.4 Spectrophotometry
7.5 PCR (Polymerase Chain Reaction)
7.6 Cell Counting
7.7 Blotting
7.8 High-Content Screening
7.9 Sample Preparation Technologies
7.10 Cell Microarray Technology
7.11 Centrifugation
8 Top 10 Cellular Analysis Market, By Application (Page No. - 62)
8.1 Introduction
8.2 Biopharmaceutical Applications
8.3 Stem Cell Research
8.4 Cancer Research
8.5 Tissue Engineering & Regenerative Medicine
8.6 Other Applications
9 Top 10 Cellular Analysis Market, By End User (Page No. - 70)
9.1 Introduction
9.2 Hospitals and Diagnostic Laboratories
9.3 Research Laboratories and Institutes
9.4 Cell Banks
9.5 Biotechnology and Pharmaceutical Companies
9.6 Other End Users
10 Global Top 10 Cellular Analysis Market, By Region (Page No. - 78)
10.1 Introduction
10.2 North America
10.2.1 U.S.
10.2.2 Canada
10.3 Europe
10.3.1 Germany
10.3.2 France
10.3.3 U.K.
10.3.4 Italy
10.3.5 Spain
10.3.6 Rest of Europe
10.4 Asia
10.4.1 Japan
10.4.2 China
10.4.3 India
10.4.4 Rest of Asia
10.5 RoW
11 Competitive Landscape (Page No. - 128)
11.1 Overview
11.2 Leading Players in the Market
11.3 Competitive Situations and Trends
11.3.1 Product Launches
11.3.2 Agreements
11.3.3 Acquisitions
11.3.4 Expansions
12 Company Profiles (Page No. - 135)
(Introduction, Products & Services, Strategy, & Analyst Insights, Developments, MnM View)*
12.1 Introduction
12.2 Thermo Fisher Scientific, Inc.
12.3 Beckman Coulter Inc. (A Subsidiary of Danaher Corporation)
12.4 Merck KGaA
12.5 Bio-Rad Laboratories, Inc.
12.6 Becton, Dickinson and Company
12.7 Agilent Technologies, Inc.
12.8 GE Healthcare
12.9 Olympus Corporation
12.10 Tecan Group Ltd.
12.11 Nikon Corporation
*Details on Marketsandmarkets View, Introduction, Product & Services, Strategy, & Analyst Insights, New Developments Might Not Be Captured in Case of Unlisted Companies.
13 Appendix (Page No. - 169)
13.1 Industry Insights
13.2 Discussion Guide
13.3 Knowledge Store: Marketsandmarkets’ Subscription Portal
13.4 Introducing RT: Real-Time Market Intelligence
13.5 Available Customizations
13.6 Related Reports
13.7 Author Details
List of Tables (83 Tables)
Table 1 Top 10 Cellular Analysis Market Snapshot
Table 2 Incidence of Infectious Diseases (Hepatitis C & Cholera)
Table 3 Global Number of Patients Suffering From Cancer, 2015–2030
Table 4 Top 10 Cellular Analysis Market Size, By Technology, 2014-2021 (USD Million)
Table 5 Cell Imaging Market Size, By Country, 2014–2021 (USD Million)
Table 6 Flow Cytometry Market Size, By Country, 2014–2021 (USD Million)
Table 7 Spectrophotometry Market Size, By Country, 2014–2021 (USD Million)
Table 8 PCR Market Size, By Country, 2014–2021 (USD Million)
Table 9 Cell Counting Market Size, By Country, 2014–2021 (USD Million)
Table 10 Blotting Market Size, By Country, 2014–2021 (USD Million)
Table 11 High-Content Screening Market Size, By Country, 2014–2021 (USD Million)
Table 12 Sample Preparation Technologiesmarket Size, By Country, 2014–2021 (USD Million)
Table 13 Cell Microarray Market Size, By Country, 2014–2021 (USD Million)
Table 14 Centrifugation Market Size, By Country, 2014–2021 (USD Million)
Table 15 Market Size, By Application, 2014–2021 (USD Million)
Table 16 Market Size for Biopharmaceutical Applications, By Country, 2014–2021 (USD Million)
Table 17 Market Size for Stem Cell Research, By Country, 2014–2021 (USD Million)
Table 18 Market Size for Cancer Research, By Country, 2014–2021 (USD Million)
Table 19 Market Size for Tissue Engineering & Regenerative Medicine, By Country, 2014–2021 (USD Million)
Table 20 Market Size for Other Applications, By Country, 2014–2021 (USD Million)
Table 21 Market Size, By End User, 2014–2021 (USD Million)
Table 22 Market Size for Hospitals and Diagnostic Laboratories, By Country, 2014–2021 (USD Million)
Table 23 Market Size for Research Laboratories and Institutes, By Country, 2014–2021 (USD Million)
Table 24 Market Size for Cell Banks, By Country, 2014–2021 (USD Million)
Table 25 Market Size for Biotechnology and Pharmaceutical Companies, By Country, 2014–2021 (USD Million)
Table 26 Market Size for Other End Users, By Country, 2014–2021 (USD Million)
Table 27 Market Size, By Region, 2014–2021 (USD Million)
Table 28 North America: Market Size, By Country, 2014–2021 (USD Million)
Table 29 North America: Market Size, By Technology, 2014–2021 (USD Million)
Table 30 North America: Market Size, By Application, 2014–2021 (USD Million)
Table 31 North America: Market Size, By End User, 2014–2021 (USD Million)
Table 32 U.S.: Market Size, By Technology, 2014–2021 (USD Million)
Table 33 U.S.: Market Size, By Application, 2014–2021 (USD Million)
Table 34 U.S.: Market Size, By End User, 2014–2021 (USD Million)
Table 35 Canada: Market Size, By Technology, 2014–2021 (USD Million)
Table 36 Canada: Market Size, By Application, 2014–2021 (USD Million)
Table 37 Canada: Market Size, By End User, 2014–2021 (USD Million)
Table 38 Europe: Market Size, By Country, 2014–2021 (USD Million)
Table 39 Europe: Market Size, By Technology, 2014–2021 (USD Million)
Table 40 Europe: Market Size, By Application, 2014–2021 (USD Million)
Table 41 Europe: Market Size, By End User, 2014–2021 (USD Million)
Table 42 Germany: Market Size, By Technology, 2014–2021 (USD Million)
Table 43 Germany: Market Size, By Application, 2014–2021 (USD Million)
Table 44 Germany: Market Size, By End User, 2014–2021 (USD Million)
Table 45 France: Market Size, By Technology, 2014–2021 (USD Million)
Table 46 France: Market Size, By Application, 2014–2021 (USD Million)
Table 47 France: Market Size, By End User, 2014–2021 (USD Million)
Table 48 U.K.: Market Size, By Technology, 2014–2021 (USD Million)
Table 49 U.K.: Market Size, By Application, 2014–2021 (USD Million)
Table 50 U.K.: Market Size, By End User, 2014–2021 (USD Million)
Table 51 Italy: Market Size, By Technology, 2014–2021 (USD Million)
Table 52 Italy: Market Size, By Application, 2014–2021 (USD Million)
Table 53 Italy: Market Size, By End User, 2014–2021 (USD Million)
Table 54 Spain: Market Size, By Technology, 2014–2021 (USD Million)
Table 55 Spain: Market Size, By Application, 2014–2021 (USD Million)
Table 56 Spain: Market Size, By End User, 2014–2021 (USD Million)
Table 57 RoE: Market Size, By Technology, 2014–2021 (USD Million)
Table 58 RoE: Market Size, By Application, 2014–2021 (USD Million)
Table 59 RoE: Market Size, By End User, 2014–2021 (USD Million)
Table 60 Asia: Market Size, By Country, 2014–2021 (USD Million)
Table 61 Asia: Market Size, By Technology, 2014–2021 (USD Million)
Table 62 Asia: Market Size, By Application, 2014–2021 (USD Million)
Table 63 Asia: Market Size, By End User, 2014–2021 (USD Million)
Table 64 Japan: Market Size, By Technology, 2014–2021 (USD Million)
Table 65 Japan: Market Size, By Application, 2014–2021 (USD Million)
Table 66 Japan: Market Size, By End User, 2014–2021 (USD Million)
Table 67 China: Market Size, By Technology, 2014–2021 (USD Million)
Table 68 China: Market Size, By Application, 2014–2021 (USD Million)
Table 69 China: Market Size, By End User, 2014–2021 (USD Million)
Table 70 India: Market Size, By Technology, 2014–2021 (USD Million)
Table 71 India: Market Size, By Application, 2014–2021 (USD Million)
Table 72 India: Market Size, By End User, 2014–2021 (USD Million)
Table 73 RoA: Market Size, By Technology, 2014–2021 (USD Million)
Table 74 RoA: Market Size, By Application, 2014–2021 (USD Million)
Table 75 RoA: Market Size, By End User, 2014–2021 (USD Million)
Table 76 RoW: Market Size, By Technology, 2014–2021 (USD Million)
Table 77 RoW: Market Size, By Application, 2014–2021 (USD Million)
Table 78 RoW: Market Size, By End User, 2014–2021 (USD Million)
Table 79 Rank of Companies in the Market
Table 80 Product Launches, 2014-2016
Table 81 Agreements, 2014–2016
Table 82 Acquisitions, 2014–2016
Table 83 Expansions, 2014–2016
List of Figures (55 Figures)
Figure 1 Research Design
Figure 2 Top 10 Cellular Analysis Market: Bottom-Up Approach
Figure 3 Top-Down Approach
Figure 4 Data Triangulation Methodology
Figure 5 Top 10 Cellular Analysis Market Size, By Technology, 2016 vs 2021 (USD Billion)
Figure 6 Top 10 Cellular Analysis Market Size, By Application, 2016 vs 2021 (USD Billion)
Figure 7 Top 10 Cellular Analysis Market Size, By End User, 2016 vs 2021 (USD Billion)
Figure 8 Top 10 Cellular Analysis Market Size, By Region, 2016 vs 2021 (USD Billion)
Figure 9 Top 10 Cellular Analysis Market
Figure 10 Cell Imaging Techniques Segment to Account for the Largest Market Share in 2016
Figure 11 Biopharmaceutical Applications to Register the Highest CAGR From 2016 to 2021
Figure 12 Asia to Register the Highest CAGR During the Forecast Period
Figure 13 Market: Drivers, Restraints, Opportunities, and Challenges
Figure 14 NIH Funding in the U.S., 2013 vs 2016 (USD Million)
Figure 15 Diabetes Cases, 2015 vs 2040 (Million)
Figure 16 Global HIV Prevalence (All Ages), 2010 vs 2015 (Million)
Figure 17 Value Chain Analysis
Figure 18 Significant Growth Potential in the Market is Enhancing Competition Among Market Players
Figure 19 Cell Imaging Techniques Segment to Dominate the Market in 2016–2021
Figure 20 Biopharmaceutical Applications Segment to Account for the Largest Share of the Market in 2016
Figure 21 Hospitals and Diagnostic Laboratories Segment to Command the Largest Share of the Market in 2016
Figure 22 Asian Top 10 Cellular Analysis Market Expected to Register the Highest CAGR During the Forecast Period
Figure 23 North America: Cancer Incidence & Mortality, 2012–2035
Figure 24 North America: Market Snapshot
Figure 25 U.S.: Cancer Incidence & Mortality, 2012–2035
Figure 26 Cell Imagine Techniques to Account for the Largest Share in the U.S. Top 10 Cellular Analysis Market in 2016
Figure 27 Canada: Cancer Incidence & Mortality, 2012–2035
Figure 28 Europe: Cancer Incidence & Mortality, 2012–2035
Figure 29 Europe: Market Snapshot
Figure 30 Germany: Cancer Incidence & Mortality, 2012–2035
Figure 31 PCR Segment to Register the Highest CAGR in the German Top 10 Cellular Analysis Market From 2016 to 2021
Figure 32 France: Cancer Incidence & Mortality, 2012–2035
Figure 33 U.K.: Cancer Incidence & Mortality, 2012–2035
Figure 34 Italy: Cancer Incidence & Mortality, 2012–2035
Figure 35 Spain: Cancer Incidence & Mortality, 2012–2035
Figure 36 Asia: Cancer Incidence & Mortality, 2012–2035
Figure 37 Asia: Market Snapshot
Figure 38 Japan: Cancer Incidence & Mortality, 2012–2035
Figure 39 The Biopharmaceutical Applications Segment to Hold the Largest Share in the Japanese Market
Figure 40 China: Cancer Incidence & Mortality, 2012–2035
Figure 41 India: Cancer Incidence & Mortality, 2012–2035
Figure 42 RoW: Market Snapshot
Figure 43 Product Launches, the Key Strategy Adopted By Leading Players
Figure 44 Battle for Market Share: Product Launches & Agreements, the Key Growth Strategies Adopted Between 2014 & 2016
Figure 45 Product Benchmarking of the Top 5 Players
Figure 46 Thermo Fisher Scientific, Inc.: Company Snapshot
Figure 47 Danaher Corporation: Company Snapshot
Figure 48 Merck KGaA: Company Snapshot
Figure 49 Bio-Rad Laboratories, Inc.: Company Snapshot
Figure 50 Becton, Dickinson and Company: Company Snapshot
Figure 51 Agilent Technologies, Inc.: Company Snapshot
Figure 52 General Electric Company: Company Snapshot
Figure 53 Olympus Corporation: Company Snapshot
Figure 54 Tecan Group Ltd: Company Snapshot
Figure 55 Nikon Corporation: Company Snapshot

 Generating Response ...


Growth opportunities and latent adjacency in Top 10 Cellular Analysis Market