Triacetin Market by Grade (Tobacco, Food, Industrial), Product Type (Plasticizer, Solvent, Humectant), End Use Industry (Tobacco, Food & Beverage, Pharmaceutical, Cosmetic, Chemical), and Region - Global Forecast to 2022


The triacetin market was valued at USD 234.5 million in 2016 and projected to reach USD 309.9 million by 2022, at a cagr 4.8% during the forecast period. The Asia Pacific region is the largest consumer of triacetin across the globe. In terms of value, the Asia Pacific triacetin market is projected to grow at the highest CAGR during the forecast period. The increasing use of triacetin in tobacco, food & beverages, cosmetics, pharmaceuticals, and other industries is driving the growth of the triacetin market across the globe. In this study, 2016 has been considered the base year and 2017-2022 as the forecast period to estimate the triacetin market size.
Market Dynamics
Drivers
- High demand for triacetin from end-use industries
Restraints
- Stringent regulations and international quality standards for triacetin
Opportunities
- Abundant supply of raw materials for triacetin
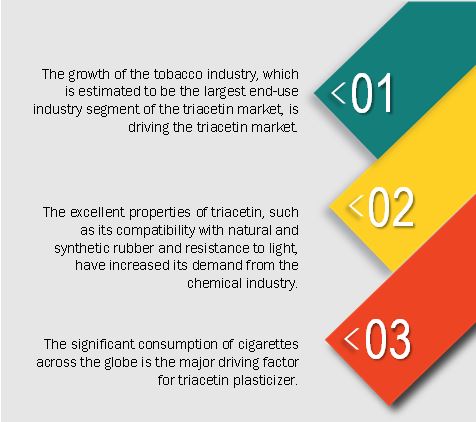
The growth of the tobacco industry is driving the triacetin market
The excellent properties of triacetin, such as its compatibility with natural and synthetic rubber and resistance to light, have increased its demand from the chemical industry. The growth of the tobacco industry, is driving the triacetin market. Triacetin is used in the tobacco industry as a plasticizer in cigarette filter rods. The increasing consumption of cigarettes across the globe has resulted in the growth of the tobacco industry, which has, in turn, increased the demand for triacetin from this end-use segment.
The following are the major objectives of the study:
- To define, describe, and forecast the triacetin market based on grade, product type, end-use industry, and region
- To forecast the size of the triacetin market in terms of value and volume in Asia Pacific, North America, Europe, the Middle East & Africa, and South America
- To strategically analyze micromarkets (refer to further segments and subsegments of the triacetin market included in the report) with respect to individual growth trends, future prospects, and contribution to the total triacetin market
- To analyze the opportunities in the triacetin market for the stakeholders and draw a competitive landscape for the market leaders
- To strategically profile the key players in the triacetin market and comprehensively analyze their core competencies
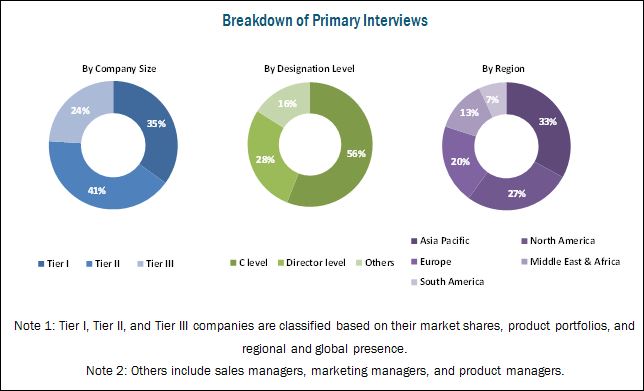
Different secondary sources, such as company websites, encyclopedias, directories, and databases such as Hoovers, Bloomberg, Businessweek, Factiva, and OneSource have been used to identify and collect information useful for this extensive, commercial study of the global triacetin market. Primary sources, including experts from related industries, have been interviewed to verify and collect critical information and assess prospects of the market. The top-down approach has been implemented to validate the market size in terms of value. With data triangulation procedures and validation of data through primaries, the exact values of the overall parent market size and individual market sizes have been determined and confirmed in this study.
To know about the assumptions considered for the study, download the pdf brochure
This study answers several questions for stakeholders, primarily, which market segments they should focus upon during the next two to five years to prioritize their efforts and investments. These stakeholders include triacetin manufacturers such as Eastman Chemical (US), LANXESS (Germany), BASF (Germany), Polynt Group (Italy), and Daicel Corporation (Japan) are some of the leading companies operating in the triacetin market.
Key Target Audience:
- Manufacturers, Dealers, and Suppliers of Triacetin
- Government Bodies
- End-Use Industries
- Suppliers of Triacetin
- Companies Engaged in Material-based R&D Activities
- Food & Beverages Organizations
- Feedstock Suppliers
- Industrial Associations
- Investment Banks
- Consulting Companies/Consultants in the Chemicals & Materials Sector
Scope of the Report:
This research report categorizes the triacetin market based on grade, product type, end-use industry, and region. The report forecasts revenues of leading companies operating in the triacetin market as well as analyzes trends in various submarkets.
Based on Grade:
- Tobacco
- Food
- Industrial
Each class is further described in detail in the report with value forecasts until 2022.
Based on Product Type:
- Plasticizer
- Solvent
- Humectant
- Others
Each type is further described in detail in the report with value forecasts until 2022.
Based on End-Us Industry:
- Tobacco
- Food & Beverage
- Pharmaceutical
- Cosmetic
- Chemical
- Others
Each end-use industry segment is further described in detail in the report, with value forecasts until 2022.
Based on Region:
- Asia Pacific
- North America
- Europe
- Middle East & Africa
- South America
Each region is further segmented by key countries, such as China, India, Japan, South Korea, the US, Mexico, Canada, Germany, the UK, Italy, France, Saudi Arabia, Argentina, and Brazil.
Available Customizations:
The following customization options are available for the report:
Company Information
- Analysis and profiles of additional global as well as regional market players (up to three)
The triacetin market is estimated to be USD 245.6 million in 2017 and is projected to reach USD 309.9 million by 2022, at a CAGR of 4.8% from 2017 to 2022. Increasing demand from end-use industries, such as tobacco, food & beverage, pharmaceutical, and cosmetic, is expected to drive the growth of the triacetin market during the forecast period.
Based on grade, the tobacco segment of the triacetin market is projected to grow at the highest CAGR during the forecast period owing to the growing consumption of tobacco grade triacetin in the tobacco industry, for use in cigarette filter rods. The food grade segment is the second-largest grade segment of the triacetin market. Food grade triacetin is used in various applications in the food & beverage industry, such as in baked foods, dairy products, confectionaries, and others.
Among end-use industries, the tobacco industry segment is projected to lead the triacetin market during the forecast period, in terms of value. The increasing consumption of cigarettes, globally, has fueled the demand for triacetin in the tobacco industry. Food & beverage is the second-largest end-use industry segment of the triacetin market. Increasing spending on eating out and growing consumption of food products (such as dairy products) have driven the demand for triacetin in the food & beverage industry.
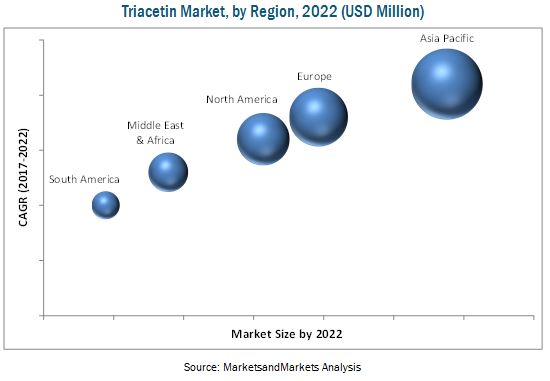
Among regions, Asia Pacific is the largest market for triacetin. Continuously increasing population and growing number of end-use industries have led to the increased demand for triacetin in the Asia Pacific region. This, in turn, has fueled the growth of the Asia Pacific triacetin market. In addition, continuous R&D activities being carried out by end-use industries, such as food & beverage and pharmaceutical, for the development of new products are fueling the growth of the triacetin market in the Asia Pacific region.
Increasing demand from tobacco industry is driving the growth of triacetin market
Tobacco
The tobacco industry is one of the fastest-growing and largest industries in the world. China is the leading producer of tobacco, producing more than 3 million tons of tobacco leaf annually. According to a study, the market size of the tobacco industry is around USD 800 billion. This industry plays a vital role in the economies of many countries. The major product of the tobacco industry is cigarettes, and triacetin is used as a plasticizer in cellulose acetate filters or cigarette filter rods.
Food & Beverage
Triacetin is used in various food applications, including baked foods, dairy products, and others. It is widely used for its texturing, moisturizing, emulsifying, and stabilizing properties. These functional properties enable manufacturers to lower their raw material costs as they act as substitutes to some food additives and are used to impart specific properties. As a result, triacetin is witnessing a high level of demand from, and consumption in, segments such as bakery & confectionery, beverages, functional & nutritional foods, and others.
Pharmaceutical
Triacetin is used as a pharmaceutical excipient in the manufacturing of capsules and tablets. In the pharmaceutical industry, triacetin is widely used as an antifungal agent and as a plasticizer for manufacturing capsules and capsule coatings. Drug development in the pharmaceutical industry and the benefits of medical, chemical, and biological research have propelled the growth of the pharmaceutical industry across the globe.
Critical questions the report answers:
- Where will all these developments take the industry in the mid to long term?
- What are the upcoming industry applications for triacetin?
To speak to our analyst for a discussion on the above findings, click Speak to Analyst
The global triacetin market is witnessing decent growth. However, stringent regulations and international quality standards have restricted the use of triacetin in various countries.
Eastman Chemical Company (US), LANXESS AG (Germany), BASF SE (Germany), Polynt Group (Italy), and Daicel Corporation (Japan) are some of the leading companies operating in the triacetin market.
 Exclusive indicates content/data unique to MarketsandMarkets and not available with any competitors.
Table of Contents
1 Introduction (Page No. - 14)
1.1 Objectives of the Study
1.2 Market Definition
1.3 Market Scope
1.3.1 Years Considered for the Study
1.4 Currency
1.5 Unit Considered
1.6 Stakeholders
2 Research Methodology (Page No. - 17)
2.1 Research Data
2.1.1 Secondary Data
2.1.1.1 Key Data From Secondary Sources
2.1.2 Primary Data
2.1.2.1 Key Data From Primary Sources
2.1.2.2 Key Industry Insights
2.1.2.3 Breakdown of Primary Interviews
2.2 Market Size Estimation
2.2.1 Bottom-Up Approach
2.2.2 Top-Down Approach
2.3 Data Triangulation
2.4 Research Assumptions
2.5 Limitations
3 Executive Summary (Page No. - 25)
4 Premium Insights (Page No. - 28)
4.1 Attractive Growth Opportunities in the Triacetin Market
4.2 Market, End-Use Industry
4.3 Market, By Product Type and Region
4.4 Triacetin Market, By Grade
5 Market Overview (Page No. - 30)
5.1 Introduction
5.2 Market Dynamics
5.2.1 Drivers
5.2.1.1 High Demand for Triacetin From End-Use Industries
5.2.2 Restraints
5.2.2.1 Stringent Regulations and International Quality Standards for Triacetin
5.2.3 Opportunities
5.2.3.1 Abundant Supply of Raw Material for Triacetin
5.3 Porter’s Five Forces Analysis
5.3.1 Threat of New Entrants
5.3.2 Threat of Substitutes
5.3.3 Bargaining Power of Buyers
5.3.4 Bargaining Power of Suppliers
5.3.5 Intensity of Competitive Rivalry
6 Triacetin Market, By Grade (Page No. - 36)
6.1 Introduction
6.2 Tobacco Grade
6.3 Food Grade
6.4 Industrial Grade
7 Triacetin Market, By Product Type (Page No. - 42)
7.1 Introduction
7.2 Plasticizer
7.3 Solvent
7.4 Humectant
7.5 Others
8 Triacetin Market, By End-Use Industry (Page No. - 48)
8.1 Introduction
8.2 Tobacco
8.3 Food & Beverage
8.4 Pharmaceutical
8.5 Cosmetic
8.6 Chemical
8.7 Others
9 Triacetin Market, By Region (Page No. - 58)
9.1 Introduction
9.2 Asia Pacific
9.2.1 China
9.2.2 Japan
9.2.3 India
9.2.4 South Korea
9.2.5 Australia
9.2.6 Rest of Asia Pacific
9.3 Europe
9.3.1 Germany
9.3.2 France
9.3.3 UK
9.3.4 Russia
9.3.5 Spain
9.3.6 Belgium
9.3.7 Rest of Europe
9.4 North America
9.4.1 US
9.4.2 Canada
9.4.3 Mexico
9.5 Middle East & Africa
9.5.1 South Africa
9.5.2 Saudi Arabia
9.5.3 Egypt
9.5.4 Rest of Middle East & Africa
9.6 South America
9.6.1 Brazil
9.6.2 Colombia
9.6.3 Argentina
9.6.4 Rest of South America
10 Competitive Landscape (Page No. - 97)
10.1 Market Ranking Analysis
10.2 Competitive Situation & Trends
10.2.1 Mergers
11 Company Profiles (Page No. - 99)
Business Overview, Products Offered, SWOT Analysis, MnM View
11.1 Eastman Chemical Company
11.2 Lanxess AG
11.3 BASF SE
11.4 Polynt Group
11.5 Daicel Corporation
11.6 KLK OLEO
11.7 Jiangsu Ruichen Chemical Co., Ltd.
11.8 Atanor S.C.A.
11.9 Hefei Tnj Chemical Industry Co., Ltd.
11.10 Mosselman S.A.
11.11 Yixing Kaixin Chemical Co., Ltd.
11.12 Reactchem Co., Ltd.
*Details Might Not Be Captured in Case of Unlisted Companies.
11.13 Other Companies in the Value Chain of the Market
11.13.1 Spectrum Chemical Mfg. Corp.
11.13.2 Alfa Aesar
11.13.3 Lemon-Flex Company Limited China
11.13.4 Sisco Research Laboratories Pvt. Ltd. (SRL)
11.13.5 Zhonglan Industry Co., Ltd.
12 Appendix (Page No. - 118)
12.1 Insights of Industry Experts
12.2 Discussion Guide
12.3 Knowledge Store: Marketsandmarkets Subscription Portal
12.4 Introducing RT: Real-Time Market Intelligence
12.5 Available Customizations
12.6 Related Reports
12.7 Author Details
List of Tables (118 Tables)
Table 1 Triacetin Market Snapshot, 2017 & 2022
Table 2 Market, By Grade, 2015-2022 (USD Million)
Table 3 Market, By Grade, 2015-2022 (Kilotons)
Table 4 Tobacco Grade Triacetin Market, By Region, 2015-2022 (USD Thousand)
Table 5 Tobacco Grade Market, By Region, 2015-2022 (Tons)
Table 6 Food Grade Market, By Region, 2015-2022 (USD Thousand)
Table 7 Food Grade Market, By Region, 2015-2022 (Tons)
Table 8 Industrial Grade Market, By Region, 2015-2022 (USD Thousand)
Table 9 Industrial Grade Market, By Region, 2015-2022 (Tons)
Table 10 Market, By Product Type, 2015-2022 (USD Million)
Table 11 Market, By Product Type, 2015-2022 (Kilotons)
Table 12 Triacetin Plasticizer Market, By Region, 2015-2022 (USD Thousand)
Table 13 Triacetin Plasticizer Market, By Region, 2015-2022 (Tons)
Table 14 Triacetin Solvent Market By Region, 2015-2022 (USD Thousand)
Table 15 Triacetin Solvent Market, By Region, 2015-2022 (Tons)
Table 16 Triacetin Humectant Market, By Region, 2015-2022 (USD Thousand)
Table 17 Triacetin Humectant Market, By Region, 2015-2022 (Tons)
Table 18 Other Triacetin Product Types Market, By Region, 2015-2022 (USD Million)
Table 19 Other Triacetin Product Types Market, By Region, 2015-2022 (Tons)
Table 20 Triacetin Market, By End-Use Industry, 2015-2022 (USD Million)
Table 21 By Market, By End-Use Industry, 2015-2022 (Kilotons)
Table 22 Market for Tobacco, By Region, 2015-2022 (USD Thousand)
Table 23 By Market for Tobacco, By Region, 2015-2022 (Tons)
Table 24 Market for Food & Beverage, By Region, 2015-2022 (USD Thousand)
Table 25 By Market for Food & Beverage, By Region, 2015-2022 (Tons)
Table 26 Triacetin Market for Pharmaceutical, By Region, 2015-2022 (USD Thousand)
Table 27 By Market for Pharmaceutical, By Region, 2015-2022 (Tons)
Table 28 Market for Cosmetic, By Region, 2015-2022 (USD Thousand)
Table 29 By Market for Cosmetic, By Region, 2015-2022 (Tons)
Table 30 Market for Chemical, By Region, 2015-2022 (USD Thousand)
Table 31 By Market for Chemical, By Region, 2015-2022 (Tons)
Table 32 Market for Other End-Use Industries, By Region, 2015-2022 (USD Thousand)
Table 33 By Market for Other End-Use Industries, By Region, 2015-2022 (Tons)
Table 34 Triacetin Market, By Region, 2015–2022 (USD Million)
Table 35 By Market, By Region, 2015–2022 (Kilotons)
Table 36 Asia Pacific Market, By Country, 2015-2022 (USD Million)
Table 37 Asia Pacific By Market, By Country, 2015-2022 (Kilotons)
Table 38 Asia Pacific By Market, By Grade, 2015-2022 (USD Million)
Table 39 Asia Pacific By Market, By Grade, 2015-2022 (Kilotons)
Table 40 Asia Pacific By Market, By End-Use Industry, 2015-2022 (USD Million)
Table 41 Asia Pacific By Market, By End-Use Industry, 2015-2022 (Kilotons)
Table 42 Asia Pacific By Market, By Product Type, 2015-2022 (USD Million)
Table 43 Asia Pacific By Market, By Product Type, 2015-2022 (Kilotons)
Table 44 China By Market, By End-Use Industry, 2015-2022 (USD Thousand)
Table 45 China By Market, By End-Use Industry, 2015-2022 (Tons)
Table 46 Japan By Market, By End-Use Industry, 2015-2022 (USD Thousand)
Table 47 Japan By Market, By End-Use Industry, 2015-2022 (Tons)
Table 48 India By Market, By End-Use Industry, 2015-2022 (USD Thousand)
Table 49 India By Market, By End-Use Industry, 2015-2022 (Tons)
Table 50 South Korea By Market, By End-Use Industry, 2015-2022 (USD Thousand)
Table 51 South Korea By Market, By End-Use Industry, 2015-2022 (Tons)
Table 52 Australia By Market, By End-Use Industry, 2015-2022 (USD Thousand)
Table 53 Australia By Market, By End-Use Industry, 2015-2022 (Tons)
Table 54 Rest of Asia Pacific By Market, By End-Use Industry, 2015-2022 (USD Thousand)
Table 55 Rest of Asia Pacific By Market, By End-Use Industry, 2015-2022 (Tons)
Table 56 Europe By Market, By Country, 2015-2022 (USD Million)
Table 57 Europe By Market, By Country, 2015-2022 (Kilotons)
Table 58 Europe By Market, By Grade, 2015-2022 (USD Million)
Table 59 Europe By Market, By Grade, 2015-2022 (Kilotons)
Table 60 Europe By Market, By Product Type, 2015-2022 (USD Million)
Table 61 Europe By Market, By Product Type, 2015-2022 (Kilotons)
Table 62 Europe By Market, By End-Use Industry, 2015-2022 (USD Million)
Table 63 Europe By Market, By End-Use Industry, 2015-2022 (Kilotons)
Table 64 Germany By Market, By End-Use Industry, 2015-2022 (USD Thousand)
Table 65 Germany By Market, By End-Use Industry, 2015-2022 (Tons)
Table 66 France By Market, By End-Use Industry, 2015-2022 (USD Thousand)
Table 67 France By Market, By End-Use Industry, 2015-2022 (Tons)
Table 68 UK By Market, By End-Use Industry, 2015-2022 (USD Thousand)
Table 69 UK By Market, By End-Use Industry, 2015-2022 (Tons)
Table 70 Russia By Market, By End-Use Industry, 2015-2022 (USD Thousand)
Table 71 Russia By Market, By End-Use Industry, 2015-2022 (Tons)
Table 72 Spain By Market, By End-Use Industry, 2015-2022 (USD Thousand)
Table 73 Spain By Market, By End-Use Industry, 2015-2022 (Tons)
Table 74 Belgium By Market, By End-Use Industry, 2015-2022 (USD Thousand)
Table 75 Belgium By Market, By End-Use Industry, 2015-2022 (Tons)
Table 76 Rest of Europe By Market, By End-Use Industry, 2015-2022 (USD Thousand)
Table 77 Rest of Europe By Market, By End-Use Industry, 2015-2022 (Tons)
Table 78 North America By Market, By Country, 2015-2022 (USD Million)
Table 79 North America By Market, By Country, 2015-2022 (Kilotons)
Table 80 North America By Market, By Grade, 2015-2022 (USD Million)
Table 81 North America By Market, By Grade, 2015-2022 (Kilotons)
Table 82 North America By Market, By Product Type, 2015-2022 (USD Million)
Table 83 North America By Market, By Product Type, 2015-2022 (Kilotons)
Table 84 US By Market, By End-Use Industry, 2015-2022 (USD Thousand)
Table 85 US By Market, By End-Use Industry, 2015-2022 (Tons)
Table 86 Canada By Market, By End-Use Industry, 2015-2022 (USD Million)
Table 87 Canada By Market, By End-Use Industry, 2015-2022 (Tons)
Table 88 Mexico By Market, By End-Use Industry, 2015-2022 (USD Million)
Table 89 Mexico By Market, By End-Use Industry, 2015-2022 (Tons)
Table 90 Middle East & Africa By Market, By Country, 2015-2022 (USD Million)
Table 91 Middle East & Africa By Market, By Country, 2015-2022 (Kilotons)
Table 92 Middle East & Africa By Market, By Grade, 2015-2022 (USD Million)
Table 93 Middle East & Africa By Market, By Grade, 2015-2022 (Kilotons)
Table 94 Middle East & Africa By Market, By Product Type, 2015-2022 (USD Million)
Table 95 Middle East & Africa By Market, By Product Type, 2015-2022 (Kilotons)
Table 96 South Africa By Market, By End-Use Industry, 2015-2022 (USD Thousand)
Table 97 South Africa By Market, By End-Use Industry, 2015-2022 (Tons)
Table 98 Saudi Arabia By Market, By End-Use Industry, 2015-2022 (USD Thousand)
Table 99 Saudi Arabia By Market, By End-Use Industry, 2015-2022 (Tons)
Table 100 Egypt By Market, By End-Use Industry, 2015-2022 (USD Thousand)
Table 101 Egypt By Market, By End-Use Industry, 2015-2022 (Tons)
Table 102 Rest of Middle East & Africa By Market, By End-Use Industry, 2015-2022 (USD Thousand)
Table 103 Rest of Middle East & Africa By Market, By End-Use Industry, 2015-2022 (Tons)
Table 104 South America By Market, By Country, 2015-2022 (USD Million)
Table 105 South America By Market, By Country, 2015-2022 (Kilotons)
Table 106 South America By Market, By Grade, 2015-2022 (USD Million)
Table 107 Middle East & Africa By Market, By Grade, 2015-2022 (Kilotons)
Table 108 Middle East & Africa By Market, By Product Type, 2015-2022 (USD Million)
Table 109 Middle East & Africa By Market, By Product Type, 2015-2022 (Kilotons)
Table 110 Brazil By Market, By End-Use Industry, 2015-2022 (USD Thousand)
Table 111 Brazil By Market, By End-Use Industry, 2015-2022 (Tons)
Table 112 Colombia By Market, By End-Use Industry, 2015-2022 (USD Thousand)
Table 113 Colombia By Market, By End-Use Industry, 2015-2022 (Tons)
Table 114 Argentina By Market, By End-Use Industry, 2015-2022 (USD Thousand)
Table 115 Argentina By Market, By End-Use Industry, 2015-2022 (Tons)
Table 116 Rest of South America By Market, By End-Use Industry, 2015-2022 (USD Thousand)
Table 117 Rest of South America By Market, By End-Use Industry, 2015-2022 (Tons)
Table 118 Mergers, 2013-2017
List of Figures (39 Figures)
Figure 1 Research Design: Triacetin Market
Figure 2 Bottom-Up Approach
Figure 3 Top-Down Approach
Figure 4 Market: Data Triangulation
Figure 5 Tobacco Grade Segment Projected to Lead Triacetin Market During Forecast Period
Figure 6 Plasticizer Product Type Segment Expected to Lead Triacetin Market During Forecast Period
Figure 7 Asia Pacific Projected to Be Fastest-Growing Market for Triacetin During Forecast Period
Figure 8 Increasing Demand for Triacetin From the Tobacco Industry is Anticipated to Drive the Triacetin Market
Figure 9 Tobacco End-Use Industry Segment Projected to Grow at the Highest CAGR From 2017 to 2022
Figure 10 The Plasticizer Segment is Estimated to Account for the Largest Share of the Triacetin Market in 2017
Figure 11 Tobacco Grade Segment Projected to Lead the Triacetin Market Between 2017 and 2022
Figure 12 Market Dynamics
Figure 13 Market: Porter’s Five Forces Analysis
Figure 14 Tobacco Grade Segment Projected to Grow at Highest CAGR During Forecast Period
Figure 15 Asia Pacific Anticipated to Lead Tobacco Grade Segment During Forecast Period
Figure 16 Asia Pacific Anticipated to Lead Food Grade Segment During the Forecast Period
Figure 17 Asia Pacific Anticipated to Lead Industrial Grade Segment During Forecast Period
Figure 18 Plasticizer Product Type Segment Expected to Lead Triacetin Market Between 2017 and 2022
Figure 19 Asia Pacific Projected to Lead Plasticizer Segment During Forecast Period
Figure 20 Asia Pacific Projected to Lead Solvent Segment During Forecast Period
Figure 21 Asia Pacific Projected to Lead Humectant Segment During Forecast Period
Figure 22 Asia Pacific Projected to Lead Others Segment During Forecast Period
Figure 23 Tobacco End-Use Industry Segment Expected to Lead Triacetin Market Between 2017 and 2022
Figure 24 Asia Pacific Projected to Lead Tobacco End-Use Industry Segment During Forecast Period
Figure 25 Asia Pacific Projected to Lead Food & Beverage End-Use Industry Segment During Forecast Period
Figure 26 Asia Pacific Projected to Lead Pharmaceutical End-Use Industry Segment During Forecast Period
Figure 27 Asia Pacific Projected to Lead Cosmetic End-Use Industry Segment During Forecast Period
Figure 28 Asia Pacific Projected to Lead Chemical End-Use Industry Segment During Forecast Period
Figure 29 Asia Pacific Projected to Lead Others Segment During Forecast Period
Figure 30 Regional Share of the Triacetin Market, 2016
Figure 31 Asia Pacific Market Snapshot
Figure 32 Europe Market Snapshot
Figure 33 North America Triacetin Market Snapshot
Figure 34 Latin America Market Snapshot
Figure 35 South America Market Snapshot
Figure 36 Eastman Chemical Company: Company Snapshot
Figure 37 BASF SE: Company Snapshot
Figure 38 Polynt Group: Company Snapshot
Figure 39 Daicel Corporation: Company Snapshot


Growth opportunities and latent adjacency in Triacetin Market