Variable Air Volume (VAV) Systems Market by Type (Single-duct VAV, Dual-duct VAV, Induction VAV, Fan-powered VAV), Application (Commercial building, Industrial building, Residential building), and Region - Global Forecast to 2024


[157 Pages Report] The global variable air volume (VAV) systems market is estimated to be valued at USD 11.8 billion in 2019 and is projected to reach USD 16.0 billion by 2024, at a CAGR of 6.3% during the same period. The demand for variable air volume (VAV) systems is driven mainly by its growing demand in commercial buildings applications.
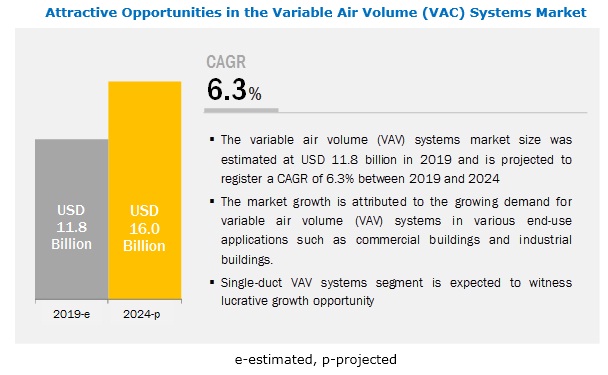
Commercial buildings application segment accounts for the largest market size during the forecast period
The commercial buildings segment is increasing owing to the rising demand for variable air volume (VAV) systems in the hospitality sector, retail sector, offices, and warehouses. The countries in the Middle East and Africa, such as the UAE and Saudi Arabia, are emerged as lucrative locations for the hospitality sector, retail sector. Hence, global investors are commencing their operating units in these countries. All such attributes are fueling the installations of variable air volume (VAV) systems in the commercial buildings application segment
By type, the single-duct VAV systems are expected to be the largest contributor in the market during the forecast period.
Based on type, the variable air volume (VAV) systems segment is likely to account for the largest share of the market in 2019. The growth of single-dut VAV systems segment is spurred by its growing demand in industrial buildings applications, especially in countries like China, India, Southeast Asia.
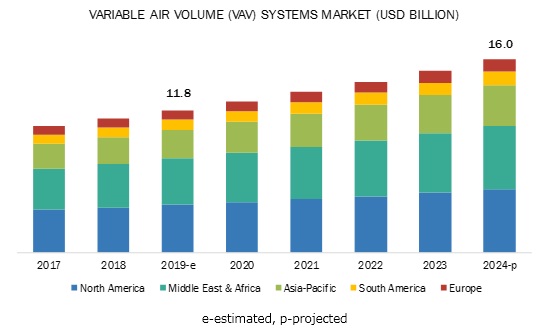
North America is expected to account for the largest market size during the forecast period
North America is the largest variable air volume (VAV) systems market, owing to its increasing usage in various applications such as commercial buildings, residential buildings, and industrial buildings. High per capita income, huge customer base, high standard of living, and huge migration rate due to industrial development have propelled the growth of residential and commercial infrastructure in the region. All such attributes are expected to propel the installations of VAV systems in the region.
Key Market Players
The major vendors in the polyurethane dispersion market are, Ingersoll Rand (Ireland), Honeywell International Ltd (US), United Technologies Corporation (US), Daikin Industries Ltd.(Japan), Johnson Controls(US), Siemens(Germany), Emerson Electric Co(US),TROX(Germany), DAIKIN INDUSTRIES, Ltd.,(Japan),KMC Controls(US), Barcol Air Ltd(Switzerland).
Scope of the Report:
|
Report Metric |
Details |
|
Market size available for years |
2017-2024 |
|
Base year considered |
2018 |
|
Forecast period |
2019-2024 |
|
Forecast units |
Value (USD) |
|
Segments covered |
Type, Application, and Region |
|
Geographies covered |
North America, APAC, Europe, South America, and Middle East & Africa |
|
Companies covered |
Ingersoll Rand (Ireland), Honeywell International Ltd (US), United Technologies Corporation (US), Daikin Industries Ltd.(Japan), Johnson Controls(US), Siemens(Germany), Emerson Electric Co(US),TROX(Germany), DAIKIN INDUSTRIES, Ltd.,(Japan),KMC Controls(US), Barcol Air Ltd(Switzerland). |
This research report categorizes the Variable Air Volume (VAV) systems market based on type, application, and region.
Variable Air Volume (VAV) Systems Market, by Types
- Single-Duct
- Dual-Duct
- Fan-Powered
- Induction based
Variable Air Volume (VAV) Systems Market, by Application
- Commercial Buildings
- Industrial Buildings
- Residential Buildings
Variable Air Volume (VAV) Systems Market, by Region
- Asia Pacific
- Europe
- North America
- Middle East & Africa
- South America
Recent Developments
- In June 2019, Johnson Controls expanded its facilities in East China to enlarge its subsidiary, York (Wuxi) Air Conditioning and Refrigeration Co. Ltd. It will help the company to establish its foothold in APAC.
- In March 2019, Trox GmbH signed a joint venture with Egyptian air conditioning manufacturer and supplier, Tiba El Manzalawi Group. With this joint venture, Trox aims at serving the Egyptian market as well as other markets in the Middle East and North & East Africa.
- In February 2017, Ingersoll Rand announced plans to acquire the business of Thermocold Costruzioni S.r.l., a manufacturer and distributor of heating, ventilating, and air-conditioning (HVAC) systems and solutions.
Key Questions addressed by the report
- Which are the future revenue pockets in the variable air volume(VAV) systems market?
- Which key developments are expected to have a high impact on the market?
- Which products/technologies are expected to overpower the existing technologies?
- How the regulatory scenario further is expected to impact the market?
- What will be the future product mix in the variable air volume(VAV) systems market?
- What are the prime strategies of leaders in the market?
Frequently Asked Questions (FAQ):
What are the factors Influencing the growth of Vav systems market?
Which region dominate the Vav systems market?
What type of Vav system dominate the market?
The Single duct VAV system is the most commonly used VAV system. Single-duct VAV system includes a supply fan and one single supply duct, that is attached to individual zone. The supply fan provides chilled air to the VAV zones in variable volumes, depending upon the cooling requirements.
How is the Vav system market aligned?
Who are the major manufacturers?
What is dominating application in the Vav system market?
What is the biggest Restraint for Vav system market?
To speak to our analyst for a discussion on the above findings, click Speak to Analyst
 Exclusive indicates content/data unique to MarketsandMarkets and not available with any competitors.
Table of Contents
1 Introduction (Page No. - 15)
1.1 Objectives of the Study
1.2 Market Definition
1.3 Market Scope
1.4 Years Considered for the Study
1.5 Currency
1.6 Limitations
1.7 Stakeholders
2 Research Methodology (Page No. - 19)
2.1 Research Data
2.1.1 Secondary Data
2.1.1.1 Key Data From Secondary Sources
2.1.2 Primary Data
2.1.2.1 Key Data From Primary Sources
2.1.2.2 Key Industry Insights
2.1.2.3 Breakdown of Primary Interviews
2.2 Market Size Estimation
2.2.1 Top-Down Approach
2.2.2 Bottom-Up Approach
2.3 Market Breakdown and Data Triangulation
2.3.1 Assumptions
3 Executive Summary (Page No. - 25)
4 Premium Insights (Page No. - 29)
4.1 Attractive Opportunities in the VAV System Market
4.2 VAV System Market Growth, By Type
4.3 VAV System Market, By Application and Region
4.4 VAV System Market: Major Countries
5 Market Overview (Page No. - 32)
5.1 Introduction
5.2 Market Dynamics
5.2.1 Drivers
5.2.1.1 Increasing Construction Activities, Globally
5.2.1.2 Increasing Awareness for Reducing Energy Consumption
5.2.2 Restraints
5.2.2.1 Presence of Alternative Technologies
5.2.2.2 Low Awareness About the VAV System
5.2.3 Opportunities
5.2.3.1 Newer Modifications in the VAV System
5.2.4 Challenges
5.2.4.1 High Product and Installation Costs
5.2.5 Porter�s Five Forces Analysis
5.2.5.1 Bargaining Power of Suppliers
5.2.5.2 Threat of New Entrants
5.2.5.3 Threat of Substitutes
5.2.5.4 Bargaining Power of Buyers
5.2.5.5 Intensity of Competitive Rivalry
5.2.6 Macroeconomic Indicators
5.2.6.1 Introduction
5.2.6.2 Trends and Forecast of GDP at Country Level
5.2.6.3 Countries Engaging in More Than 60% Green Projects (2018 and 2021)
5.2.6.4 Sectors Having Planned Green Activity Over the Next Three Years(2020�2022)
5.2.6.5 Growth Rate of Global Manufacturing Output (Quarter I, 2018)
5.2.7 Supply Chain Analysis
5.2.8 Sales Channel and Component Definition
5.2.9 Component Cost Breakup
5.2.9.1 Component Definitions
5.2.10 New Construction vs Retrofit
6 VAV System Market, By Type (Page No. - 48)
6.1 Introduction
6.2 Single-Duct VAV System
6.2.1 The Use of Single-Duct VAV System Ensures Reduced Energy Consumption, Thereby Contributing to the Global Need for Energy Efficiency
6.3 Dual-Duct VAV System
6.3.1 Dual-Duct VAV System is Ideal for Alternative Ventilation and Humidity Control
6.4 Induction VAV System
6.4.1 One of The Most Important Advantages of This VAV System is That It Requires Low Maintenance
6.5 Fan-Powered VAV System
6.5.1 Fan-Powered Series VAV System
6.5.1.1 This Type of VAV System is Suitable for Use in Areas Where Constant Cfm Needs to Be Maintained
6.5.2 Parallel Fan-Powered VAV System
6.5.2.1 Parallel Fan-Powered VAV System Functions at Constant as Well as Variable Temperature Modes
7 VAV System Market, By Application (Page No. - 57)
7.1 Introduction
7.2 Commercial Buildings
7.2.1 Offices
7.2.1.1 The Type of VAV System Used in Office Buildings Varies According to the Size of the Building
7.2.2 Warehouse
7.2.2.1 Roof Top Single Zone Or Single-Duct VAV Systems are Used Commonly in Warehouses
7.2.3 Hospitality
7.2.4 Retail
7.2.4.1 Packaged Roof Top Single Zone Or Single-Duct VAV Systems are Widely Used in the Retail Sector
7.2.5 Others
7.3 Industrial Buildings
7.3.1 The Energy-Efficient and Cost-Effective Nature of the VAV System is Useful in Industrial Buildings
7.4 Residential Buildings
7.4.1 MEA is A Promising Market in the Residential Buildings Segment
8 VAV System Market, By Region (Page No. - 65)
8.1 Introduction
8.2 North America
8.2.1 US
8.2.1.1 Industrial Growth Driving the Installations of VAV Systems
8.2.2 Canada
8.2.2.1 Growing Immigration Rate is Driving the VAV System Installations in Residential, Commercial, and Industrial Applications
8.2.3 Mexico
8.2.3.1 Government Initiatives to Develop Manufacturing Industries are Driving the VAV System Market
8.3 Middle East and Africa (MEA)
8.3.1 UAE
8.3.1.1 Growing Building and Construction Industry Driving the Installations of VAV Systems
8.3.2 Saudi Arabia
8.3.2.1 Growing Immigration Rate is Driving the VAV Systems Installations in Residential, Commercial, and Industrial Applications
8.3.3 Nigeria
8.3.3.1 Government Initiatives to Develop Manufacturing Industries to Drive the VAV System Market
8.3.4 Rest of MEA
8.4 APAC
8.4.1 China
8.4.1.1 Increasing Demand for the Hvac System to Drive the Market
8.4.2 India
8.4.2.1 Growing Construction Industry and Smart City Projects to Drive the Market
8.4.3 Japan
8.4.3.1 Reconstruction Activities and Further Economic Growth to Provide Opportunities for Market Growth
8.4.4 South Korea
8.4.4.1 Upcoming Green City Projects and the Changing Climatic Conditions to Drive the Demand for VAV Systems
8.4.5 Indonesia
8.4.5.1 Growing Infrastructural Development and Upcoming Smart City Projects are Driving the VAV System Market
8.4.6 Rest of APAC
8.5 South America
8.5.1 Brazil
8.5.1.1 Recovery in Construction Activities Driving the Installation of VAV Systems
8.5.2 Argentina
8.5.2.1 Recovering Construction Activities are Expected to Drive the VAV System Market in the Country
8.5.3 Rest of South America
8.6 Europe
8.6.1 Western Europe
8.6.1.1 Germany
8.6.1.1.1 The Increasing Awareness Regarding Energy Consumption to Drive the VAV System Market
8.6.1.2 UK
8.6.1.2.1 The Growth in Construction of Commercial Buildings to Drive the VAV System Market
8.6.1.3 France
8.6.1.3.1 Growing Construction Activities and the Rising Awareness Regarding Energy Efficiency to Drive the Market
8.6.1.4 Rest of Western Europe
8.6.2 Central & Eastern Europe
8.6.2.1 Russia
8.6.2.1.1 Increase in the Construction Activities in the Country to Drive the Market
8.6.2.2 Turkey
8.6.2.2.1 Growing Awareness Regarding Energy Consumption and an Increasing Number of Commercial Buildings to Drive the Market
8.6.2.3 Rest of Eastern and Central Europe
9 Competitive Landscape (Page No. - 113)
9.1 Overview
9.2 Market Ranking Analysis
9.3 Competitive Scenario
9.3.1 Expansion
9.3.2 Acquisition
9.3.3 Agreement & Joint Venture
9.3.4 New Product Launch
10 Company Profiles (Page No. - 117)
10.1 Johnson Controls
10.1.1 Business Overview
10.1.2 Products Offered
10.1.3 Recent Developments
10.1.4 SWOT Analysis
10.1.5 MnM View
10.2 Ingersoll Rand Plc
10.2.1 Business Overview
10.2.2 Products Offered
10.2.3 Recent Developments
10.2.4 SWOT Analysis
10.2.5 MnM View
10.3 DAIKIN INDUSTRIES, Ltd.
10.3.1 Business Overview
10.3.2 Products Offered
10.3.3 Recent Developments
10.3.4 MnM View
10.4 United Technologies Corporation
10.4.1 Business Overview
10.4.2 Products Offered
10.4.3 Recent Developments
10.4.4 SWOT Analysis
10.4.5 MnM View
10.5 Emerson Electric Co.
10.5.1 Business Overview
10.5.2 Products Offered
10.5.3 SWOT Analysis
10.5.4 MnM View
10.6 Honeywell International Inc.
10.6.1 Business Overview
10.6.2 Products Offered
10.6.3 SWOT Analysis
10.6.4 MnM View
10.7 Siemens
10.7.1 Business Overview
10.7.2 Products Offered
10.7.3 SWOT Analysis
10.7.4 MnM View
10.8 TROX GmbH
10.8.1 Business Overview
10.8.2 Products Offered
10.8.3 Recent Developments
10.8.4 MnM View
10.9 KMC Controls
10.9.1 Business Overview
10.9.2 Products Offered
10.9.3 Recent Developments
10.9.4 MnM View
10.10 Barcol-Air
10.10.1 Business Overview
10.10.2 Products Offered
10.10.3 MnM View
10.11 Other Company Profiles
10.11.1 Schneider Electric
10.11.2 Systemair Ab
10.11.3 Kad Airconditioning
10.11.4 Metal Industries Inc.
10.11.5 Spectrum Industries
10.11.6 Dynacraft Air Controls
10.11.7 Halton Group
10.11.8 Advanced Air Limited
10.11.9 Waterloo Air Products Plc
10.11.10 Air Master Equipments Emirates L.L.C.
11 Appendix (Page No. - 151)
11.1 Insights From Industry Experts
11.2 Available Customizations
11.3 Related Reports
List of Tables (84 Tables)
Table 1 VAV System Market Size, By Type, 2017�2024 (USD Million)
Table 2 Single-Duct VAV System Market Size , By Region, 2017�2024 (USD Million)
Table 3 Dual-Duct VAV System Market Size, By Region, 2017�2024 (USD Million)
Table 4 Induction VAV System Market Size, By Region, 2017�2024 (USD Million)
Table 5 Fan-Powered VAV System Market Size, By Region, 2017�2024 (USD Million)
Table 6 VAV System Market Size, By Application, 2017�2024 (USD Million)
Table 1 VAV System Market in Commercial Buildings Application, 2017�2024 (USD Million)
Table 2 VAV System Market Size in Commercial Buildings Application, By Region, 2017�2024 (USD Million)
Table 3 VAV System Market Size in Industrial Buildings Application, By Region, 2017�2024 (USD Million
Table 4 VAV System Market Size in Residential Buildings Application, By Region, 2017�2024 (USD Million)
Table 5 VAV System Market Size, By Region, 2017�2024 (USD Million)
Table 6 VAV System Market Size, By Type, 2017�2024 (USD Million)
Table 7 VAV System Market Size, By Fan-Powered Type, 2017�2024 (USD Million)
Table 8 VAV System Market Size, By Application, 2017�2024 (USD Million)
Table 9 VAV System Market Size in Commercial Buildings Application, 2017�2024 (USD Million)
Table 10 North America: VAV System Market Size, By Country, 2017�2024 (USD Million)
Table 11 North America: VAV System Market Size, By Type, 2017�2024 (USD Million)
Table 12 North America: VAV System Market Size, By Fan-Powered Type, 2017�2024 (USD Million)
Table 13 North America: VAV System Market Size, By Application, 2017�2024 (USD Million)
Table 14 North America: VAV System Market Size in Commercial Buildings Application, 2017�2024 (USD Million)
Table 15 US: VAV System Market Size, By Type, 2017�2024 (USD Million)
Table 16 US: VAV System Market Size, By Application, 2017�2024 (USD Million)
Table 17 Canada: VAV System Market Size, By Type, 2017�2024 (USD Million)
Table 18 Canada: VAV System Market Size, By Application, 2017�2024 (USD Million)
Table 19 Mexico: VAV System Market Size, By Type, 2017�2024 (USD Million)
Table 20 Mexico: VAV System Market Size, By Application, 2017�2024 (USD Million)
Table 21 MEA: VAV System Market Size, By Country, 2017�2024 (USD Million)
Table 22 MEA: VAV System Market Size, By Type, 2017�2024 (USD Million)
Table 23 MEA: VAV System Market Size, By Fan-Powered Type, 2017�2024 (USD Million)
Table 24 MEA: VAV System Market Size, By Application, 2017�2024 (USD Million)
Table 25 MEA: VAV System Market Size in Commercial Buildings Application, 2017�2024 (USD Million)
Table 26 UAE: VAV System Market Size, By Type, 2017�2024 (USD Million)
Table 27 UAE: VAV System Market Size, By Application, 2017�2024 (USD Million)
Table 28 Saudi Arabia: VAV System Market Size, By Type, 2017�2024 (USD Million)
Table 29 Saudi Arabia: VAV System Market Size, By Application, 2017�2024 (USD Million)
Table 30 Nigeria: VAV System Market Size, By Type, 2017�2024 (USD Million)
Table 31 Nigeria: VAV System Market Size, By Application, 2017�2024 (USD Million)
Table 32 Rest of MEA: VAV System Market Size, By Type, 2017�2024 (USD Million)
Table 33 Rest of MEA: VAV System Market Size, By Application, 2017�2024 (USD Million)
Table 34 APAC: VAV System Market Size, By Country, 2017�2024 (USD Million)
Table 35 APAC: VAV System Market Size, By Type, 2017�2024 (USD Million)
Table 36 APAC: VAV System Market Size, By Fan-Powered Type, 2017�2024 (USD Million)
Table 37 APAC: VAV System Market Size, By Application, 2017�2024 (USD Million)
Table 38 APAC: VAV System Market Size in Commercial Buildings Application, 2017�2024 (USD Million)
Table 39 China: VAV System Market Size, By Type, 2017�2024 (USD Million)
Table 40 China: VAV System Market Size, By Application, 2017�2024 (USD Million)
Table 41 India: VAV System Market Size, By Type, 2017�2024 (USD Million)
Table 42 India: VAV System Market Size, By Application, 2017�2024 (USD Million)
Table 43 Japan: VAV System Market Size, By Type, 2017�2024 (USD Million)
Table 44 Japan: VAV System Market Size, By Application, 2017�2024 (USD Million)
Table 45 South Korea: VAV System Market Size, By Type, 2017�2024 (USD Million)
Table 46 South Korea: VAV System Market Size, By Application, 2017�2024 (USD Million)
Table 47 Indonesia: VAV System Market Size, By Type, 2017�2024 (USD Million)
Table 48 Indonesia: VAV System Market Size, By Application, 2017�2024 (USD Million)
Table 49 Rest of APAC: VAV System Market Size, By Type, 2017�2024 (USD Million)
Table 50 Rest of APAC: VAV System Market Size, By Application, 2017�2024 (USD Million)
Table 51 South America: VAV System Market Size, By Country, 2017�2024 (USD Million)
Table 52 South America: VAV System Market Size, By Type, 2017�2024 (USD Million)
Table 53 South America: VAV System Market Size, By Fan-Powered Type, 2017�2024 (USD Million)
Table 54 South America: VAV System Market Size, By Application, 2017�2024 (USD Million)
Table 55 South America: VAV System Market Size, in Commercial Buildings Application, 2017�2024 (USD Million)
Table 56 Brazil: VAV System Market Size, By Type, 2017�2024 (USD Million)
Table 57 Brazil: VAV System Market Size, By Application, 2017�2024 (USD Million)
Table 58 Argentina: VAV System Market Size, By Type, 2017�2024 (USD Million)
Table 59 Argentina: VAV System Market Size, By Application, 2017�2024 (USD Million)
Table 60 Rest of South America: VAV System Market Size, By Type, 2017�2024 (USD Million)
Table 61 Rest of South America: VAV System Market Size, By Application, 2017�2024 (USD Million)
Table 62 Europe: VAV System Market Size, By Country, 2017�2024 (USD Million)
Table 63 Europe: VAV System Market Size, By Type, 2017�2024 (USD Million)
Table 64 Europe: VAV System Market Size, By Fan-Powered Type, 2017�2024 (USD Million)
Table 65 Europe: VAV System Market Size, By Application, 2017�2024 (USD Million)
Table 66 Europe: VAV System Market Size in Commercial Buildings Application, 2017�2024 (USD Million)
Table 67 Germany: VAV System Market Size, By Type, 2017�2024 (USD Million)
Table 68 Germany: VAV System Market Size, By Application, 2017�2024 (USD Million)
Table 69 UK: VAV System Market Size, By Type, 2017�2024 (USD Million)
Table 70 UK: VAV System Market Size, By Application, 2017�2024 (USD Million)
Table 71 France: VAV System Market Size, By Type, 2017�2024 (USD Million)
Table 72 France: VAV System Market Size, By Application, 2017�2024 (USD Million)
Table 73 Rest of Western Europe: VAV System Market Size, By Type, 2017�2024 (USD Million)
Table 74 Rest of Western Europe: VAV System Market Size, By Application, 2017�2024 (USD Million)
Table 75 Russia: VAV System Market Size, By Type, 2017�2024 (USD Million)
Table 76 Russia: VAV System Market Size, By Application, 2017�2024 (USD Million)
Table 77 Turkey: VAV System Market Size, By Type, 2017�2024 (USD Million)
Table 78 Turkey: VAV System Market Size, By Application, 2017�2024 (USD Million)
Table 79 Rest of Europe: VAV System Market Size, By Type, 2017�2024 (USD Million)
Table 80 Rest of Europe: VAV System Market Size, By Application, 2017�2024 (USD Million)
Table 81 Expansion, 2014�2019
Table 82 Acquisition, 2014�2019
Table 83 Agreement & Joint Venture, 2014�2019
Table 84 New Product Launch, 2014�2019
List of Figures (52 Figures)
Figure 1 VAV System: Market Segmentation
Figure 2 VAV System Market: Research Design
Figure 3 VAV System Market: Top-Down Approach
Figure 4 VAV System Market: Bottom-Up Approach
Figure 5 Single-Duct VAV to Be the Largest Type of the VAV System Market
Figure 6 Commercial Buildings to Be the Largest Application of the VAV System Market
Figure 7 North America Accounted for Leading Market Share in 2018
Figure 8 Increasing Investments in Emerging Countries of APAC to Drive the Global Market
Figure 9 Single-Duct VAV to Lead the Market, 2019�2024
Figure 10 Commercial Buildings and North America Accounted for the Highest Shares of the Market, 2018
Figure 11 India to Grow at the Highest CAGR in the Market
Figure 12 Drivers, Restraints, Opportunities, and Challenges in the VAV System Market
Figure 13 High Threat of Substitutes Owing to A Large Number of Alternative Products in the VAV System Market
Figure 14 Trends and Forecast of GDP at Country Level, USD Billion (2018�2024)
Figure 15 Countries Engaging in More Than 60% Green Projects (2018 and 2021)
Figure 16 VAV System Market: Supply Chain Analysis
Figure 17 Sales Channel Breakup
Figure 18 VAV System Market: Component Cost Breakup
Figure 19 VAV System Market: New Construction vs Retrofit
Figure 20 Single-Duct VAV System to Be the Fastest-Growing Segment of the Market
Figure 21 North America to Be the Largest Market for Single-Duct VAV System
Figure 22 North America to Be the Largest Market for Dual-Duct VAV System
Figure 23 North America to Be the Largest Market for Induction VAV System
Figure 24 North America to Be the Largest Market for Fan-Powered VAV System
Figure 25 Commercial Buildings to Be the Fastest-Growing Application of VAV System
Figure 26 Commercial Buildings to Be the Largest Application of VAV Systems in North America
Figure 27 Industrial Buildings to Be the Largest Application of VAV System in North America
Figure 28 Residential Buildings to Be the Largest Application of VAV System in North America
Figure 29 India and the UAE to Lead the Market
Figure 30 North America: VAV System Market Snapshot
Figure 31 MEA: VAV System Market Snapshot
Figure 32 APAC: VAV System Market Snapshot
Figure 33 South America: VAV System Market Snapshot
Figure 34 Europe: VAV System Market Snapshot
Figure 35 Companies Primarily Adopted Expansion as the Key Growth Strategy Between 2014 and 2019
Figure 36 Market Ranking of Key Players, 2018
Figure 37 Johnson Controls: Company Snapshot
Figure 38 Johnson Controls: SWOT Analysis
Figure 39 Ingersoll Rand Plc: Company Snapshot
Figure 40 Ingersoll Rand Plc: SWOT Analysis
Figure 41 DAIKIN INDUSTRIES: Company Snapshot
Figure 42 United Technologies Corporation: Company Snapshot
Figure 43 United Technologies Corporation: SWOT Analysis
Figure 44 Emerson Electric: Company Snapshot
Figure 45 Emerson Electric: SWOT Analysis
Figure 46 Honeywell International: Company Snapshot
Figure 47 Honeywell International: SWOT Analysis
Figure 48 Siemens: Company Snapshot
Figure 49 Siemens: SWOT Analysis
Figure 50 TROX GmbH: Company Snapshot
Figure 51 KMC Controls: Company Snapshot
Figure 52 Barcol-Air: Company Snapshot
The study involved four major activities in estimating the current market size of variable air volume (VAV) systems. Exhaustive secondary research was done to collect information on the market, peer market, and parent market. The next step was to validate these findings, assumptions, and sizing with industry experts across the value chain through primary research. Both top-down and bottom-up approaches were employed to estimate the complete market size. After that, market breakdown and data triangulation were used to estimate the market size of segments and sub-segments.
Secondary Research
In the secondary research process, various secondary sources such as Hoovers, Bloomberg Business Week, Factiva, World Bank, and Industry Journals have been referred to, to identify and collect information for this study. These secondary sources included annual reports, press releases & investor presentations of companies, white papers, certified publications, articles by recognized authors, and databases.
Primary Research
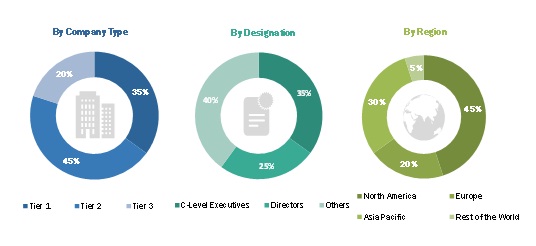
The Variable Air Volume (VAV) systems market comprises several stakeholders, such as raw material suppliers, end-product manufacturers, and regulatory organizations in the supply chain. The demand side is characterized by the developments in the Variable Air Volume (VAV) systems market. The supply side is characterized by market consolidation activities undertaken by the manufacturers. Various primary sources from both the supply and demand sides of the market were interviewed to obtain qualitative and quantitative information. Following is the breakdown of primary respondents
To know about the assumptions considered for the study, download the pdf brochure
Market Size Estimation
Both top-down and bottom-up approaches were used to estimate and validate the total size of the Variable Air Volume (VAV) systems market. These methods were also used extensively to estimate the size of various sub-segments in the market. The research methodology used to estimate the market size includes the following:
- The key players in the industry and markets have been identified through extensive secondary research.
- The industry�s supply chain, component cost break-up, sales channel distribution break-up and market size, in terms of value, have been determined through primary and secondary research processes.
- All percentage shares, splits, and breakdowns have been determined using secondary sources and verified through primary sources.
Data Triangulation
After arriving at the overall market size-using the market size estimation processes as explained above-the market was split into several segments and sub-segments. To complete the overall market engineering process and arrive at the exact statistics of each market segment and subsegment, the data triangulation, and market breakdown procedures were employed, wherever applicable. The data was triangulated by studying various factors and trends from both the demand and supply sides in the Variable Air Volume (VAV) systems market.
Report Objectives
- To define, describe, and forecast Variable Air Volume (VAV) systems market size, in terms of value
- To provide information about the major factors (drivers, restraints, opportunities, and challenges) influencing the market growth
- To analyze and forecast the Variable Air Volume (VAV) systems market size based on application, type, and region
- To forecast the market size with respect to key regions, namely, North America, Asia Pacific (APAC), Europe, the Middle East & Africa, and South America
- To study and analyze the supply chain, component cost break-up, and sales channel distribution
- To strategically analyze the market with respect to individual growth trends, prospects, and their contribution to the overall market
Available Customizations:
With the given market data, MarketsandMarkets offers customizations according to the company�s specific needs.
The following customization options are available for the report:
Product Analysis
- Product matrix, which gives a detailed comparison of the product portfolio of each company
Regional Analysis
- Further breakdown country level by type and application
Company Information
- Detailed analysis and profiling of additional market players (up to five)


Growth opportunities and latent adjacency in Variable Air Volume (VAV) Systems Market