Viral Clearance Market by Application (Recombinant Proteins, Blood, Vaccines), End User (Pharmaceutical & Biotechnology Companies, CROs), Method (Viral Removal (Chromatography, Nanofiltration), Viral Inactivation (Low pH)) - Global Forecasts to 2023


The global viral clearance market is projected to reach USD 724.5 million by 2023, growing at a CAGR of 21.7%.
Objectives of the Study
- To define, measure, and describe the global viral clearance market by application, method, end user, and region
- To provide detailed information about the major factors influencing market growth (drivers, restraints, challenges, and opportunities)
- To analyze micromarkets with respect to individual growth trends, prospects, and contributions to the overall market
- To analyze market opportunities for stakeholders and provide details of the competitive landscape for key players
- To forecast the size of market segments in North America, Europe, Asia Pacific, and RoW
- To strategically analyze the market structure and profile key players in the global viral clearance market and comprehensively analyze their core competencies
- To track and analyze company developments such as acquisitions, expansions, agreements, partnerships, collaborations, and product launches in the viral clearance market
Research Methodology
Top-down and bottom-up approaches were used to validate the size of the global viral clearance market and estimate the size of other dependent submarkets. Various secondary sources such as the International Society for Pharmaceutical Engineering, International Federation of Pharmaceutical Manufacturers and Associations (IFPMA), International Pharmaceutical Federation (FIP), International Diabetes Federation (IDF), European Federation of Biotechnology, International Rare Diseases Research Consortium (IRDiRC), Canadian Institutes of Health Research, Association of the British Pharmaceutical Industry (ABPI), Indian Drug Manufacturers Association, Chinese Medical Association, Korean Research- based Pharma Industry Association (KRPIA), directories, industry journals, databases, press releases, and annual reports of the companies have been used to identify and collect information useful for the study of this market.
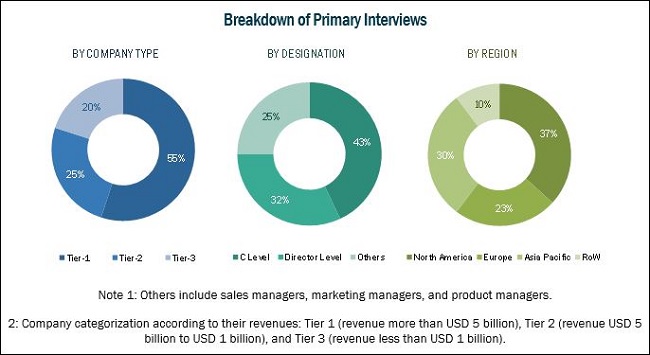
Primary sources such as experts from both supply and demand sides have been interviewed to obtain and validate information as well as to assess the dynamics of this market. The breakdown of profiles of primaries is shown in the figure below:
To know about the assumptions considered for the study, download the pdf brochure
See how this study impacted revenues for other players in Viral Clearance Market
Client’s Problem Statement
Our client, a viral clearance service provider, based in the US, wanted segmental analysis of the viral clearance market, with special focus on viral clearance end users and applications. The client wanted an analysis of end users such as pharmaceutical & biotechnology companies, contract research organizations, academic research institutes, and other end users, with a focus on the key players operating across the Asia Pacific region. The client also wanted information on applications such as recombinant proteins, blood and blood products, vaccines, and others.
MnM Approach
MnM identified the share of viral clearance end users in the market. MnM also prepared an exhaustive subsegmentation of viral clearance end users and applications. Upon identifying the end users and applications under these segments, we studied their geographical footprint globally to understand the regional shares of the Asia Pacific market.
Simultaneously, MnM interacted with key industry leaders and analyzed the market size and growth of the segments across the Asia Pacific region. Based on the understanding of the primaries conducted, secondary research, and the ample data in the MnM repository, we provided the market shares, sizes, and CAGRs of different viral clearance end users and applications across the Asia Pacific and Latin America regions. Our client utilized our analysis to understand the dynamics of the viral clearance market and explore emerging markets. A detailed revenue share analysis helped the client understand the top players in this market.
Revenue Impact (RI)
Our evaluation of this market enabled the creation of a revenue impact of ~USD 50 million.
The major players in the global viral clearance market are Wuxi Biologics (Cayman) (China), Merck KGaA (Germany), Charles River Laboratories International Inc. (US), Texcell Inc. (France), Kedrion (Italy), Vironova Biosafety (Sweden), Clean Cells (France), BSL BIOSERVICE Scientific Laboratories Munich GmbH (Germany), and ViruSure GmbH (Austria).
Target Audience:
- Viral clearance product manufacturers, suppliers, and distributors
- Pharmaceutical & biotechnology companies
- Associations related to pharmaceutical and biotechnological research
- Research institutes and CROs
- Government bodies/municipal corporations
- Regulatory bodies
- Teaching hospitals and academic medical centers (AMCs)
- Venture capitalists
- Market research and consulting firms
Scope of the Report:
The research report categorizes the viral clearance market into the following segments and subsegments:
Viral Clearance Market, by Application
- Recombinant Proteins
- Blood and Blood Products
- Vaccines
- Other Applications
Viral Clearance Market, by End User
- Pharmaceutical & Biotechnology Companies
- Contract Research Organizations
- Academic Research Institutes
- Other End Users
Viral Clearance Market, by Method
- Viral Removal
- Chromatography
- Nanofiltration
- Precipitation
- Viral Inactivation
- Low pH
- Solvent Detergent Method
- Pasteurization
- Other Viral Inactivation Methods
Viral Clearance Market, by Region
-
North America
- US
- Canada
-
Europe
- Germany
- France
- UK
- Rest of Europe (RoE)
-
Asia Pacific
- China
- Japan
- India
- Rest of Asia Pacific (RoAPAC)
- Rest of the World
Available customizations
With the given market data, MarketsandMarkets offers customizations as per the company’s specific needs. The following customization options are available for the report:
Product Analysis
- Product matrix, which gives a detailed comparison of the product portfolios of each company
Company Information
- Detailed analysis and profiling of additional market players (up to 3)
The growth of this market is primarily driven by factors such as the growth in the pharmaceutical and biotechnology industries, increasing number of new drug launches, R&D investments in life science, advancements in nanofiltration technology, and high incidence and large economic burden of chronic diseases.
The viral clearance market is segmented on the basis of application, end user, method, and region.
Based on application, the market is segmented into recombinant proteins, blood and blood products, vaccines, and other applications. The other applications segment is expected to grow at the highest CAGR during the forecast owing to the increasing use of cellular therapies in the treatment of various disorders, increasing public and private funding for stem cell research, rising awareness about stem cell therapies, and the use of tissue-based therapies to treat various diseases.
On the basis of end user, the viral clearance market is segmented into pharmaceutical & biotechnology companies, CROs, academic research institutes, and other end users. The contract research organizations segment is expected to register the highest CAGR during the forecast period. The high growth in this segment can be attributed to the ability of CROs to invest in extensive drug discovery infrastructure and the rising outsourcing of Drug Discovery Services to CROs by pharmaceutical companies, academic institutes, small biotechnology companies, and start-ups.
On the basis of method, the global viral clearance market is segmented into two broad categories viral removal and viral inactivation. The viral removal segment is estimated to account for the largest share of the global viral clearance market in 2018. This segment is also expected to grow at the highest rate during the forecast period. The large share of this market segment is primarily attributed to the growth of R&D activities by biopharmaceutical companies; high acceptance of this method; and the accuracy, speed, and flexibility provided by the method in life sciences research.
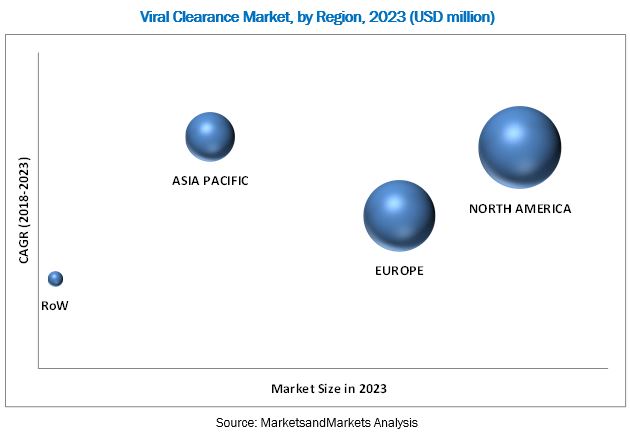
The North American region is expected to account for the largest share of the market in 2018. The viral clearance market in the region is driven by the presence of national institutes supporting biotechnology and life science research, growth in the pharmaceuticals industry, and the increasing number of drug approvals. The rising prevalence of diseases, growing production of monoclonal antibodies, and government support for the development of drugs are some of the key factors driving the viral clearance market in the US. In Canada, increasing pharmaceutical production is expected to boost the growth of the viral clearance market.
However, Asia Pacific is expected to witness the highest growth during the forecast period, owing to increase in generics development and manufacturing, surge in funding for medical research and the presence of a large number of CROs to provide preclinical and clinical research services in China, government initiatives to boost the use of generic drugs, increasing aging population in Japan, rise in pharmaceutical R&D expenditures in India, and the growing pharmaceutical manufacturing in Singapore and Malaysia.
While this is a high-growth market, the high time and cost requirements for drug development may hamper the pace of activity in this sector, and consequently the adoption of viral clearance practices during the forecast period to a certain extent.
The key players in the global viral clearance market are Wuxi Biologics (Cayman) (China), Merck KGaA (Germany), Charles River Laboratories International Inc. (US), and Texcell Inc. (France). These companies together accounted for 70.0% of the global viral clearance market in 2017. Other players together accounted for 30.0% of the market. These include Kedrion (Italy), Vironova Biosafety (Sweden), Clean Cells (France), BSL BIOSERVICE Scientific Laboratories Munich GmbH (Germany), and ViruSure GmbH (Austria).
To speak to our analyst for a discussion on the above findings, click Speak to Analyst
 Exclusive indicates content/data unique to MarketsandMarkets and not available with any competitors.
Table of Contents
1 Introduction (Page No. - 17)
1.1 Objectives of the Study
1.2 Market Definition
1.3 Market Scope
1.3.1 Markets Covered
1.3.2 Years Considered for the Study
1.4 Currency
1.5 Limitations
1.6 Stakeholders
2 Research Methodology (Page No. - 21)
2.1 Research Data
2.1.1 Secondary Data
2.1.1.1 Key Data From Secondary Sources
2.1.2 Primary Data
2.1.2.1 Key Data From Primary Sources
2.1.2.2 Key Industry Insights
2.2 Market Size Estimation
2.2.1 Market Data Validation and Triangulation
2.3 Assumptions for the Study
3 Executive Summary (Page No. - 31)
4 Premium Insights (Page No. - 37)
4.1 Viral Clearance Market Overview
4.2 Asia Pacific: Viral Clearance Market, By Country and End User
4.3 Geographic Snapshot: Viral Clearance Market
4.4 Viral Clearance Market, By Application (2018 vs 2023)
5 Market Overview (Page No. - 41)
5.1 Introduction
5.2 Market Dynamics
5.2.1 Drivers
5.2.1.1 Growth in the Pharmaceutical and Biotechnology Industries
5.2.1.2 Increasing Number of Drug Launches
5.2.1.3 Favorable R&D Investment Scenario
5.2.1.4 Possibility of Cell Culture Contamination
5.2.1.5 Advancements in Nanofiltration Technology
5.2.1.6 High Incidence and Large Economic Burden of Chronic Diseases
5.2.2 Restraints
5.2.2.1 Cost and Time-Intensive Drug Development Process
5.2.3 Opportunities
5.2.3.1 Increasing Pharmaceutical Outsourcing
5.2.3.2 Emerging Markets
5.2.4 Challenges
5.2.4.1 Dearth of Skilled Professionals
6 Viral Clearance Market, By Application (Page No. - 47)
6.1 Introduction
6.2 Recombinant Proteins
6.3 Blood and Blood Products
6.4 Vaccines
6.5 Other Applications
7 Viral Clearance Market, By End User (Page No. - 57)
7.1 Introduction
7.2 Pharmaceutical & Biotechnology Companies
7.3 Contract Research Organizations
7.4 Academic Research Institutes
7.5 Other End Users
8 Viral Clearance Market, By Method (Page No. - 67)
8.1 Introduction
8.2 Viral Removal
8.2.1 Chromatography
8.2.2 Nanofiltration
8.2.3 Precipitation
8.3 Viral Inactivation
8.3.1 Low Ph
8.3.2 Solvent Detergent Method
8.3.3 Pasteurization
8.3.4 Other Viral Inactivation Methods
9 Viral Clearance Market, By Region (Page No. - 85)
9.1 Introduction
9.2 North America
9.2.1 US
9.2.2 Canada
9.3 Europe
9.3.1 Germany
9.3.2 France
9.3.3 UK
9.3.4 RoE
9.4 Asia Pacific
9.4.1 China
9.4.2 Japan
9.4.3 India
9.4.4 RoAPAC
9.5 RoW
10 Competitive Landscape (Page No. - 129)
10.1 Introduction
10.2 Viral Clearance Market Share Analysis (2017)
10.2.1 Wuxi Biologics (Cayman)
10.2.2 Merck KGaA
10.2.3 Charles River Laboratories International Inc.
10.3 Competitive Scenario
11 Company Profiles (Page No. - 135)
(Business Overview, Products Offered, Recent Developments, MnM View)*
11.1 Wuxi Biologics (Cayman) (Subsidiary of Wuxi Apptec)
11.2 Merck KGaA
11.3 Charles River Laboratories International
11.4 Kedrion
11.5 Vironova Biosafety
11.6 Texcell
11.7 Clean Cells
11.8 Bsl Bioservice
11.9 Virusure GmbH
*Business Overview, Products Offered, Recent Developments, MnM View Might Not Be Captured in Case of Unlisted Companies.
12 Appendix (Page No. - 152)
12.1 Discussion Guide: Viral Clearance Market
12.2 Knowledge Store: Marketsandmarkets’ Subscription Portal
12.3 Available Customizations
12.4 Related Reports
12.5 Author Details
List of Tables (118 Tables)
Table 1 Viral Clearance Market, By Application, 2016–2023 (USD Million)
Table 2 Viral Clearance Market for Recombinant Proteins, By Region, 2016–2023 (USD Million)
Table 3 Viral Clearance Market for Recombinant Proteins, By Country, 2016–2023 (USD Million)
Table 4 Viral Clearance Market for Blood and Blood Products, By Region, 2016–2023 (USD Million)
Table 5 Viral Clearance Market for Blood and Blood Products, By Country, 2016–2023 (USD Million)
Table 6 Viral Clearance Market for Vaccines, By Region, 2016–2023 (USD Million)
Table 7 Viral Clearance Market for Vaccines, By Country, 2016–2023 (USD Million)
Table 8 Viral Clearance Market for Other Applications, By Region, 2016–2023 (USD Million)
Table 9 Viral Clearance Market for Other Applications, By Country, 2016–2023 (USD Million)
Table 10 Viral Clearance Market, By End User, 2016–2023 (USD Million)
Table 11 Viral Clearance Market for Pharmaceutical & Biotechnology Companies, By Region, 2016–2023 (USD Million)
Table 12 Viral Clearance Market for Pharmaceutical & Biopharmaceutical Companies, By Country, 2016–2023 (USD Million)
Table 13 Viral Clearance Market for Contract Research Organizations, By Region, 2016–2023 (USD Million)
Table 14 Viral Clearance Market for Contract Research Organizations, By Country, 2016–2023 (USD Million)
Table 15 Market for Academic Research Institutes, By Region, 2016–2023 (USD Thousand)
Table 16 Market for Academic Research Institutes, By Country, 2016–2023 (USD Million)
Table 17 Market for Other End Users, By Region, 2016–2023 (USD Thousand)
Table 18 Market for Other End Users, By Country, 2016–2023 (USD Million)
Table 19 Market, By Method, 2016–2023 (USD Million)
Table 20 Viral Removal Market, By Method, 2016–2023 (USD Million)
Table 21 Viral Removal Market, By Region, 2016–2023 (USD Million)
Table 22 Viral Removal Market, By Country, 2016–2023 (USD Million)
Table 23 Viral Removal Market for Chromatography, By Region, 2016–2023 (USD Million)
Table 24 Viral Removal Market for Chromatography, By Country, 2016–2023 (USD Million)
Table 25 Viral Removal Market for Nanofiltration, By Region, 2016–2023 (USD Million)
Table 26 Viral Removal Market for Nanofiltration, By Country, 2016–2023 (USD Million)
Table 27 Viral Removal Market for Precipitation, By Region, 2016–2023 (USD Million)
Table 28 Viral Removal Market for Precipitation, By Country, 2016–2023 (USD Million)
Table 29 Viral Inactivation Market, By Method, 2016–2023 (USD Million)
Table 30 Viral Inactivation Market, By Region, 2016–2023 (USD Million)
Table 31 Viral Inactivation Market, By Country, 2016–2023 (USD Million)
Table 32 Low Ph Viral Inactivation Market, By Region, 2016–2023 (USD Million)
Table 33 Low Ph Viral Inactivation Market, By Country, 2016–2023 (USD Million)
Table 34 Viral Inactivation Market for Solvent Detergent Method, By Region, 2016–2023 (USD Million)
Table 35 Viral Inactivation Market for Solvent Detergent Method, By Country, 2016–2023 (USD Million)
Table 36 Viral Inactivation Market for Pasteurization, By Region, 2016–2023 (USD Million)
Table 37 Viral Inactivation Market for Pasteurization, By Country, 2016–2023 (USD Million)
Table 38 Other Viral Inactivation Methods Market, By Region, 2016–2023 (USD Million)
Table 39 Other Viral Inactivation Methods Market, By Country, 2016–2023 (USD Million)
Table 40 Viral Clearance Market, By Region, 2016–2023 (USD Million)
Table 41 Viral Clearance Market, By Country, 2016–2023 (USD Million)
Table 42 North America: Viral Clearance Market, By Country, 2016–2023 (USD Million)
Table 43 North America: Market, By Application, 2016–2023 (USD Million)
Table 44 North America: Market, By End User, 2016–2023 (USD Million)
Table 45 North America: Market, By Method, 2016–2023 (USD Million)
Table 46 North America: Viral Removal Market, By Method, 2016–2023 (USD Million)
Table 47 North America: Viral Inactivation Market, By Method, 2016–2023 (USD Million)
Table 48 US: Viral Clearance Market, By Application, 2016–2023 (USD Million)
Table 49 US: Market, By End User, 2016–2023 (USD Million)
Table 50 US: Market, By Method, 2016–2023 (USD Million)
Table 51 US: Viral Removal Market, By Method, 2016–2023 (USD Million)
Table 52 US: Viral Inactivation Market, By Method, 2016–2023 (USD Million)
Table 53 Canada: Viral Clearance Market, By Application, 2016–2023 (USD Million)
Table 54 Canada: Market, By End User, 2016–2023 (USD Million)
Table 55 Canada: Market, By Method, 2016–2023 (USD Million)
Table 56 Canada: Viral Removal Market, By Method, 2016–2023 (USD Million)
Table 57 Canada: Viral Inactivation Market, By Method, 2016–2023 (USD Million)
Table 58 Europe: Viral Clearance Market, By Country, 2016–2023 (USD Million)
Table 59 Europe: Market, By Application, 2016–2023 (USD Million)
Table 60 Europe: Market, By End User, 2016–2023 (USD Million)
Table 61 Europe: Market, By Method, 2016–2023 (USD Million)
Table 62 Europe: Viral Removal Market, By Method, 2016–2023 (USD Million)
Table 63 Europe: Viral Inactivation Market, By Method, 2016–2023 (USD Million)
Table 64 Germany: Viral Clearance Market, By Application, 2016–2023 (USD Million)
Table 65 Germany: Market, By End User, 2016–2023 (USD Million)
Table 66 Germany: Market, By Method, 2016–2023 (USD Million)
Table 67 Germany: Viral Removal Market, By Method, 2016–2023 (USD Million)
Table 68 Germany: Viral Inactivation Market, By Method, 2016–2023 (USD Million)
Table 69 France: Viral Clearance Market, By Application, 2016–2023 (USD Million)
Table 70 France: Market, By End User, 2016–2023 (USD Million)
Table 71 France: Market, By Method, 2016–2023 (USD Million)
Table 72 France: Viral Removal Market, By Method, 2016–2023 (USD Million)
Table 73 France: Viral Inactivation Market, By Method, 2016–2023 (USD Million)
Table 74 UK: Viral Clearance Market, By Application, 2016–2023 (USD Million)
Table 75 UK: Market, By End User, 2016–2023 (USD Million)
Table 76 UK: Market, By Method, 2016–2023 (USD Million)
Table 77 UK: Viral Removal Market, By Method, 2016–2023 (USD Million)
Table 78 UK: Viral Inactivation Market, By Method, 2016–2023 (USD Million)
Table 79 RoE: Viral Clearance Market, By Application, 2016–2023 (USD Million)
Table 80 RoE: Market, By End User, 2016–2023 (USD Million)
Table 81 RoE: Market, By Method, 2016–2023 (USD Million)
Table 82 RoE: Viral Removal Market, By Method, 2016–2023 (USD Million)
Table 83 RoE: Viral Inactivation Market, By Method, 2016–2023 (USD Million)
Table 84 Asia Pacific: Viral Clearance Market, By Country, 2016–2023 (USD Million)
Table 85 Asia Pacific: Market, By Application, 2016–2023 (USD Million)
Table 86 Asia Pacific: Market, By End User, 2016–2023 (USD Million)
Table 87 Asia Pacific: Market, By Method, 2016–2023 (USD Million)
Table 88 Asia Pacific: Viral Removal Market, By Method, 2016–2023 (USD Million)
Table 89 Asia Pacific: Viral Inactivation Market, By Method, 2016–2023 (USD Million)
Table 90 China: Viral Clearance Market, By Application, 2016–2023 (USD Million)
Table 91 China: Market, By End User, 2016–2023 (USD Million)
Table 92 China: Market, By Method, 2016–2023 (USD Million)
Table 93 China: Viral Removal Market, By Method, 2016–2023 (USD Million)
Table 94 China: Viral Inactivation Market, By Method, 2016–2023 (USD Million)
Table 95 Japan: Viral Clearance Market, By Application, 2016–2023 (USD Million)
Table 96 Japan: Market, By End User, 2016–2023 (USD Million)
Table 97 Japan: Market, By Method, 2016–2023 (USD Million)
Table 98 Japan: Viral Removal Market, By Method, 2016–2023 (USD Million)
Table 99 Japan: Viral Inactivation Market, By Method, 2016–2023 (USD Million)
Table 100 India: Viral Clearance Market, By Application, 2016–2023 (USD Million)
Table 101 India: Market, By End User, 2016–2023 (USD Million)
Table 102 India: Market, By Method, 2016–2023 (USD Million)
Table 103 India: Viral Removal Market, By Method, 2016–2023 (USD Million)
Table 104 India: Viral Inactivation Market, By Method, 2016–2023 (USD Million)
Table 105 RoAPAC: Viral Clearance Market, By Application, 2016–2023 (USD Million)
Table 106 RoAPAC: Market, By End User, 2016–2023 (USD Million)
Table 107 RoAPAC: Market, By Method, 2016–2023 (USD Million)
Table 108 RoAPAC: Viral Removal Market, By Method, 2016–2023 (USD Million)
Table 109 RoAPAC: Viral Inactivation Market, By Method, 2016–2023 (USD Million)
Table 110 RoW: Viral Clearance Market, By Application, 2016–2023 (USD Million)
Table 111 RoW: Market, By End User, 2016–2023 (USD Million)
Table 112 RoW: Market, By Method, 2016–2023 (USD Million)
Table 113 RoW: Viral Removal Market, By Method, 2016–2023 (USD Million)
Table 114 RoW: Viral Inactivation Market, By Method, 2016–2023 (USD Million)
Table 115 Product Launches, 2015-2018
Table 116 Agreements, Collaborations, and Partnerships, 2015-2018
Table 117 Acquisitions, 2015-2018
Table 118 Expansions, 2015-2018
List of Figures (33 Figures)
Figure 1 Viral Clearance Market Segmentation
Figure 2 Viral Clearance Market: Research Methodology
Figure 3 Breakdown of Primary Interviews: By Company Type, Designation, and Region
Figure 4 Market Size Estimation Methodology: Bottom-Up Approach
Figure 5 Market Size Estimation Methodology: Top-Down Approach
Figure 6 Research Design
Figure 7 Data Triangulation Methodology
Figure 8 Recombinant Proteins Segment to Hold Largest Share of the Applications Market
Figure 9 Pharmaceutical & Biotechnology Companies Segment to Dominate the Viral Clearance Market in 2018
Figure 10 Viral Clearance Market, By Method, 2018 vs 2023
Figure 11 Viral Removal Market, By Method, 2018 vs 2023
Figure 12 Viral Inactivation Market, By Method, 2018 vs 2023
Figure 13 Asia Pacific to Register the Highest CAGR in the Forecast Period
Figure 14 Rapid Growth in Pharmaceutical and Biotechnology Industries, the Key Factor Driving the Growth of the Market
Figure 15 Pharmaceutical & Biotechnology Companies Segment to Dominate the Viral Clearance Systems Market in 2018
Figure 16 Asia Pacific to Grow at the Highest Rate During the Forecast Period
Figure 17 Recombinant Proteins Segment to Command the Largest Market Share By 2023
Figure 18 Recombinant Proteins Application Segment to Dominate the Viral Clearance Market During the Forecast Period
Figure 19 Pharmaceutical & Biotechnology Companies to Dominate the Viral Clearance End-User Market During the Forecast Period
Figure 20 Viral Removal Methods to Dominate the Viral Clearance Market During the Forecast Period
Figure 21 Chromatography to Dominate the Viral Removal Method Segment During the Forecast Period
Figure 22 Low PH Methods to Dominate the Viral Inactivation Market During the Forecast Period
Figure 23 Viral Clearance Market, By Region, 2018 vs 2023 (USD Million)
Figure 24 North America: Viral Clearance Market Snapshot
Figure 25 Europe: Viral Clearance Market Snapshot
Figure 26 Asia Pacific: Viral Clearance Market Snapshot
Figure 27 RoW: Viral Clearance Market Snapshot
Figure 28 Key Developments in the Viral Clearance Market Between 2015 and 2018
Figure 29 Market Share Analysis, By Key Player, 2017
Figure 30 Wuxi Biologics : Company Snapshot (2017)
Figure 31 Merck KGaA: Company Snapshot (2017)
Figure 32 Charles River Laboratories International: Company Snapshot (2017)
Figure 33 Kedrion: Company Snapshot (2017)

 Generating Response ...


Growth opportunities and latent adjacency in Viral Clearance Market