Wearable Materials Market by Application (Consumer Electronics, Medical, Industrial), Type (Silicones, Polyurethanes, Fluoroelastomers), Region (APAC, North America, Europe, South America,and Middle East & Africa) - Global Forecast to 2023


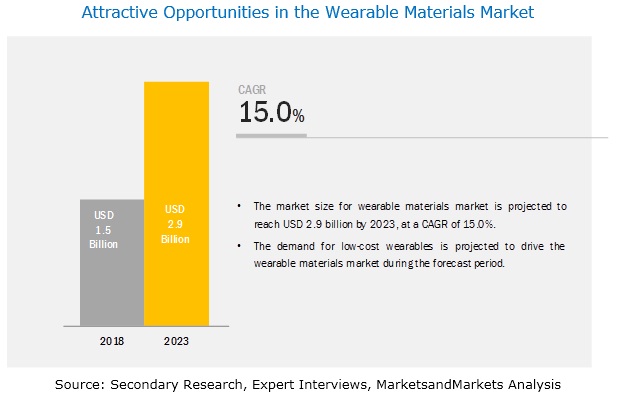
[98 Pages Report] The market size of wearable materials is estimated at USD 1.5 billion in 2018 and is projected to reach USD 2.9 billion by 2023, at a CAGR of 15.0 % between 2018 and 2023. The high demand for wearable electronics in emerging countries is leading to the increasing consumption of wearable materials. Increasing demand for low-cost wearables and rising disposable income in emerging economies are driving the wearable materials market.
The silicones segment is expected to account for the largest share, in terms of value, of the overall wearable materials market.
The silicones segment is expected to be the largest type of wearable materials in the overall market.
Silicone is considered biocompatible and can be used in a broad array of skin care applications, including peel and stick technology for wearable skin applications and biomedical grade silicones for wearable medical devices. They are also much more breathable than any other organic polymer, which entails increased patient comfort. These materials adapt well to the body contours and offer greater comfort and better fit.
Consumer electronics is expected to be the largest consumer of wearable materials market during the forecast period.
The wearable materials market has been segmented on the basis of application as consumer electronics, industrial, medical, and others. Consumer electronics is the largest application of wearable materials. The market in this segment is driven by the increased use of fitness and wellness trackers. The wearable materials market in the industrial application segment is projected to register the highest growth during the forecast period.
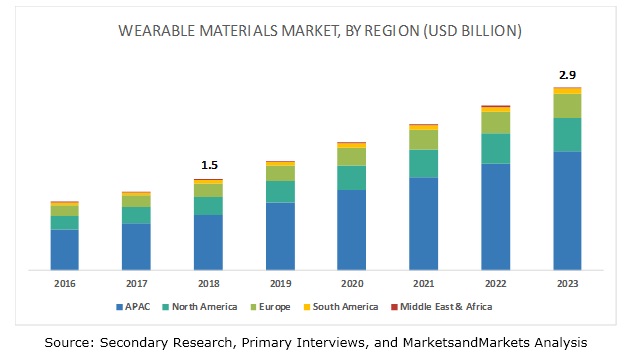
APAC is projected to be the largest market for wearable materials during the forecast period.
On the basis of region, the wearable materials market has been segmented into APAC, Europe, North America, the Middle East & Africa, and South America. APAC is projected to register the highest growth in the wearable materials market during the forecast period. The growing electronics industry coupled with rapid rise in disposable income in the region is driving the wearable materials market in the region. China is the largest market for wearable materials in the region.
Key Market Players
Key players profiled in this report include BASF (Germany), DowDuPont (US), Wacker Chemie (Germany), DSM (Netherlands), Arkema (France), Eastman Corporation (US), Shin-Etsu (Japan), Elkem (Norway), Momentive performance materials (US), and Lubrizol (US).
These companies have adopted various organic as well as inorganic growth strategies between 2015 and 2018 to strengthen their position in the market. New product launch was among the key growth strategies adopted by these leading players to enhance their regional presence and meet the growing demand for wearable electronics in emerging economies.
Scope of the Report
|
Report Metric |
Details |
|
Years considered for the study |
|
|
Base year |
2017 |
|
Forecast period |
2018-2023 |
|
Unit considered |
USD million (Value) |
|
Segments |
Application and region |
|
Geographies |
North America, APAC, Europe, the Middle East & Africa, and South America |
|
Companies |
Major players covered: |
This research report categorizes the wearable materials market based on type, application, and region.
On the basis of type, the wearable materials market has been segmented as follows:
- Silicones
- Fluoroelastomers
- Polyurethanes
- Others (PET, polyamide, and polyaniline)
On the basis of application, the wearable materials market has been segmented as follows:
- Consumer electronics
- Medical
- Industrial
- Others (aviation, marine, and military & defense)
On the basis of region, the wearable materials market has been segmented as follows:
- Europe
- North America
- APAC
- Middle East & Africa
- South America
Recent Developments
- In October 2017, Arnitel developed by DSM was used by Zhongxing Telecommunication Equipment Corporation (ZTE) in the manufacture of their new smart watch, ZTE Quartz. Arnitel was used in the manufacture of the soft strap of the smart watch as it has increased safety, resistance to UV rays, and design flexibility.
- In November 2016, BASF developed the thermoplastic polyurethane brand, Elastollan, which was incorporated in Paiband, a wearable device manufactured by Putao Technology. Ellastolan offers design flexibility, haptic optimization, and UV resistance.
- In June 2015, Elkem acquired Bluestar Silicones International in 2015 and integrated into a single company. This acquisition helped Elkem in emerging as a vertically integrated silicones manufacturer and a financially robust company.
Critical questions the report answers:
- What are the upcoming hot bets in the wearable materials market?
- How is the market dynamics changing for different types of wearable materials?
- How is the market dynamics changing for different applications of wearable materials?
- Who are the major manufacturers of wearable materials?
- How are the market dynamics wearable materials changing in the different regions?
To speak to our analyst for a discussion on the above findings, click Speak to Analyst
 Exclusive indicates content/data unique to MarketsandMarkets and not available with any competitors.
Table of Contents
1 Introduction (Page No. - 14)
1.1 Objectives of the Study
1.2 Market Definition
1.3 Market Scope
1.3.1 Regions Covered
1.3.2 Years Considered for the Study
1.4 Currency
1.5 Stakeholders
2 Research Methodology (Page No. - 17)
2.1 Research Data
2.1.1 Secondary Data
2.1.1.1 Key Data From Secondary Sources
2.1.2 Primary Data
2.1.2.1 Key Data From Primary Sources
2.1.2.2 Key Industry Insights
2.1.2.3 Breakdown of Primary Interviews
2.2 Market Size Estimation
2.2.1 Top-Down Approach
2.2.2 Bottom-Up Approach
2.3 Data Triangulation
2.4 Assumptions
2.5 Limitations
3 Executive Summary (Page No. - 24)
4 Premium Insights (Page No. - 26)
4.1 Attractive Opportunities in the Wearable Materials Market
4.2 Wearable Materials Market, By Application
4.3 Wearable Materials Market, By Region
4.4 APAC Wearable Materials Market, By Application and Country
4.5 Wearable Materials Market, By Key Countries
5 Market Overview (Page No. - 29)
5.1 Introduction
5.2 Market Dynamics
5.2.1 Drivers
5.2.1.1 Increased Demand for Wearables With Higher Functionality
5.2.1.2 Growing Popularity of Internet of Things
5.2.2 Restraints
5.2.2.1 Lack of Long-Lasting and Supple Materials
5.2.3 Opportunities
5.2.3.1 Adoption of Wearables in Multiple Application Areas
5.2.4 Challenges
5.2.4.1 Increased Manufacturing Cost of Wearable Materials
5.3 Porter�s Five Forces Analysis
5.3.1 Bargaining Power of Suppliers
5.3.2 Bargaining Power of Buyers
5.3.3 Threat of New Entrants
5.3.4 Threat of Substitutes
5.3.5 Intensity of Competitive Rivalry
6 Wearable Materials Market, By Type (Page No. - 33)
6.1 Introduction
6.2 Silicones
6.2.1 Silicones are Biocompatible and Versatile Materials
6.3 Polyurethanes
6.3.1 Polyurethanes are Used in Wearable Skin Patches, Soft-Touch Bands in Smartwatches
6.4 Fluoroelastomers
6.4.1 Fluoroelastomers Enhance the Look and Feel of Wearable Products
6.5 Others
7 Wearable Materials Market, By Application (Page No. - 36)
7.1 Introduction
7.2 Consumer Electronics
7.2.1 Fitness & Sports
7.2.1.1 Rising Health Consciousness Among Consumers to Increase the Demand in the Fitness & Sports Application
7.2.2 Infotainment & Multimedia
7.2.2.1 Increasing Use of Smartwatches to Drive the Market in the Infotainment & Multimedia Application
7.2.3 Multifunction
7.2.3.1 Wellness Trends Among Users of Wearables to Drive the Multifunction Application
7.2.4 Garments & Fashion
7.2.4.1 E-Textile to Support the Growth of the Market in the Garments & Fashion Application
7.3 Medical
7.3.1 Clinical
7.3.1.1 New Variants of Wearable Sensors to Propel the Growth of the Clinical Application
7.3.2 Nonclinical
7.3.2.1 Routine Care of Acute Diseases to Support the Nonclinical Application
7.4 Industrial
7.4.1 Logistics, Packaging & Warehouses
7.4.1.1 Research and Prototyping of Wearables is Expected to Fuel the Growth of the Wearable Materials Market
7.4.2 Others
7.5 Others
8 Wearable Materials Market, By Region (Page No. - 43)
8.1 Introduction
8.2 North America
8.2.1 US
8.2.1.1 Presence of Major Wearables Manufacturers are Increasing the Demand for Wearable Materials
8.2.2 Canada
8.2.2.1 The Growing Medical Application to Augment the Wearable Materials Market Growth
8.2.3 Mexico
8.2.3.1 Low Manufacturing Cost to Help Support the Wearable Materials Market
8.3 Europe
8.3.1 Germany
8.3.1.1 Growing Fitness Trends are Increasing the Use Wearables
8.3.2 UK
8.3.2.1 Increasing Use of Wearables in the Medical Application is Supporting the Market Growth
8.3.3 France
8.3.3.1 Growing Use of Consumer Electronics Wearables is Driving the Market
8.3.4 Italy
8.3.4.1 Penetration of Luxury Brands Into Wearables to Support the Market
8.3.5 Spain
8.3.5.1 Growth in Distribution Channels of Wearables Manufacturers Fueling the Demand
8.3.6 Rest of Europe
8.4 APAC
8.4.1 China
8.4.1.1 Government Investment is Expected to Augment the Growth of the Wearables Materials Market
8.4.2 Japan
8.4.2.1 Industrial to Be the Fastest-Growing Application of Wearable Materials During the Forecast Period
8.4.3 India
8.4.3.1 Low-Cost Wearables to Increase the Demand for Wearable Materials
8.4.4 South Korea
8.4.4.1 Wearables Manufacturers to Support the Wearable Materials Market
8.4.5 Malaysia
8.4.5.1 Rising Disposable Income to Drive the Wearable Materials Market
8.4.6 Rest of APAC
8.5 South America
8.5.1 Brazil
8.5.1.1 Improvement in Healthcare and Manufacturing Sectors to Provide Opportunities for Manufacturers of Wearables
8.5.2 Argentina
8.5.2.1 Influence of International Brands to Drive the Wearables Materials Market
8.5.3 Rest of South America
8.6 Middle East & Africa
8.6.1 Saudi Arabia
8.6.1.1 Avid Users of Wearable Devices to Drive the Wearables Materials Market
8.6.2 Israel
8.6.2.1 Israeli Enterprises to Support the Growth of the Market
8.6.3 Rest of Middle East & Africa
9 Competitive Landscape (Page No. - 73)
9.1 Introduction
9.2 Market Ranking
9.3 Competitive Scenario
9.3.1 Expansion
9.3.2 New Product Launch
9.3.3 Acquisition
10 Company Profiles (Page No. - 77)
(Business Overview, Products Offered, Recent Developments, SWOT Analysis, and MnM View)*
10.1 BASF
10.2 Dowdupont
10.3 Wacker Chemie
10.4 DSM
10.5 Arkema
10.6 Eastman Corporation
10.7 Shin-Etsu
10.8 Elkem
10.9 Momentive Performance Materials
10.10 Lubrizol
10.11 Other Companies
10.11.1 Emerald Performance Materials
10.11.2 Daikin Chemicals
10.11.3 Solvay
10.11.4 3M
10.11.5 Covestro
*Details on Business Overview, Products Offered, Recent Developments, SWOT Analysis, and MnM View Might Not Be Captured in Case of Unlisted Companies.
11 Appendix (Page No. - 93)
11.1 Discussion Guide
11.2 Knowledge Store: Marketsandmarkets� Subscription Portal
11.3 Related Reports
11.4 Author Details
List of Tables (63 Tables)
Table 1 Wearable Materials Market Size, By Application, 2016�2023 (USD Million)
Table 2 Wearable Materials Market Size in Consumer Electronics, By Region, 2016�2023 (USD Million)
Table 3 Wearable Materials Market Size in Consumer Electronics, By Sub Application, 2016�2023 (USD Million)
Table 4 Wearable Materials Market Size in Medical, By Region, 2016�2023 (USD Million)
Table 5 Wearable Materials Market Size in Medical, By Sub Application, 2016�2023 (USD Million)
Table 6 Wearable Materials Market Size in Industrial, By Region, 2016�2023 (USD Million)
Table 7 Wearable Materials Market Size in Industrial, By Sub Application, 2016�2023 (USD Million)
Table 8 Wearable Materials Market Size in Other Applications, By Region, 2016�2023 (USD Million)
Table 9 Wearable Materials Market Size, By Region, 2016�2023 (USD Million)
Table 10 North America: By Market Size, By Country, 2016�2023 (USD Million)
Table 11 North America: By Market Size, By Application, 2016�2023 (USD Million)
Table 12 North America: By Market Size in Consumer Electronics, By Country, 2016�2023 (USD Million)
Table 13 North America: By Market Size in Medical, By Country, 2016�2023 (USD Million)
Table 14 North America: By Market Size in Industrial, By Country, 2016�2023 (USD Million)
Table 15 North America: By Market Size in Other Applications, By Country, 2016�2023 (USD Million)
Table 16 US: By Market Size, By Application, 2016�2023 (USD Million)
Table 17 Canada: By Market Size, By Application, 2016�2023 (USD Million)
Table 18 Mexico: By Market Size, By Application, 2016�2023 (USD Million)
Table 19 Europe: By Market Size, By Country, 2016�2023 (USD Million)
Table 20 Europe: By Market Size, By Application, 2016�2023 (USD Million)
Table 21 Europe: By Market Size in Consumer Electronics, By Country, 2016�2023 (USD Million)
Table 22 Europe: By Market Size in Medical, By Country, 2016�2023 (USD Million)
Table 23 Europe: By Market Size in Industrial, By Country, 2016�2023 (USD Million)
Table 24 Europe: By Market Size in Other Applications, By Country, 2016�2023 (USD Million)
Table 25 Germany: By Market Size, By Application, 2016�2023 (USD Million)
Table 26 UK: By Market Size, By Application, 2016�2023 (USD Million)
Table 27 France: By Market Size, By Application, 2016�2023 (USD Million)
Table 28 Italy: By Market Size, By Application, 2016�2023(USD Million)
Table 29 Spain: By Market Size, By Application, 2016�2023(USD Million)
Table 30 Rest of Europe: By Market Size, By Application, 2016�2023(USD Million)
Table 31 APAC: By Market Size, By Country, 2016�2023 (USD Million)
Table 32 APAC: By Market Size, By Application, 2016�2023 (USD Million)
Table 33 APAC: By Market Size in Consumer Electronics, By Country, 2016�2023 (USD Million)
Table 34 APAC: By Market Size in Medical, By Country, 2016�2023 (USD Million)
Table 35 APAC: By Market Size in Industrial, By Country, 2016�2023 (USD Million)
Table 36 APAC: By Market Size in Other Applications, By Country, 2016�2023 (USD Million)
Table 37 China: By Market Size, By Application, 2016�2023 (USD Million)
Table 38 Japan: By Market Size, By Application, 2016�2023 (USD Million)
Table 39 India: By Market Size, By Application, 2016�2023 (USD Million)
Table 40 South Korea: By Market Size, By Application,2016�2023 (USD Million)
Table 41 Malaysia: By Market Size, By Application, 2016�2023 (USD Million)
Table 42 Rest of APAC: By Market Size, By Application, 2016�2023 (USD Million)
Table 43 South America: By Market Size, By Country, 2016�2023 (USD Million)
Table 44 South America: By Market Size, By Application, 2016�2023 (USD Million)
Table 45 South America: By Market Size in Consumer Electronics, By Country, 2016�2023 (USD Million)
Table 46 South America: By Market Size in Medical, By Country, 2016�2023 (USD Million)
Table 47 South America: By Market Size in Industrial, By Country, 2016�2023 (USD Million)
Table 48 South America: By Market Size in Other Applications, By Country, 2016�2023 (USD Million)
Table 49 Brazil: By Market Size, By Application, 2016�2023 (USD Million)
Table 50 Argentina: By Market Size, By Application, 2016�2023 (USD Million)
Table 51 Rest of South America: By Market Size, By Application, 2016�2023 (USD Million)
Table 52 Middle East & Africa: By Market Size, By Country, 2016�2023 (USD Million)
Table 53 Middle East & Africa: By Market Size, By Application, 2016�2023 (USD Million)
Table 54 Middle East & Africa: By Market Size in Consumer Electronics, By Country, 2016�2023 (USD Million)
Table 55 Middle East & Africa: By Market Size in Medical, By Country, 2016�2023 (USD Million)
Table 56 Middle East & Africa: By Market Size in Industrial, By Country, 2016�2023 (USD Million)
Table 57 Middle East & Africa: By Market Size in Other Applications, By Country, 2016�2023 (USD Million)
Table 58 Saudi Arabia: By Market Size, By Application, 2016�2023 (USD Million)
Table 59 Israel: By Market Size, By Application, 2016�2023 (USD Million)
Table 60 Rest of Middle East & Africa: By Market Size, By Application, 2016�2023 (USD Million)
Table 61 Expansion, 2015�2017
Table 62 New Product Launch, 2015�2017
Table 63 Acquisition, 2015�2017
List of Figures (31 Figures)
Figure 1 Wearable Materials Market Segmentation
Figure 2 Wearable Materials Market: Research Design
Figure 3 Consumer Electronics Segment Held the Largest Market Share in 2017
Figure 4 APAC to Register the Fastest Growth Rate in the Wearable Materials Market
Figure 5 Growing Consumer Electronics Application to Drive the Market
Figure 6 Consumer Electronics Segment to Dominate the Wearable Materials Market
Figure 7 APAC to Be the Largest Wearable Materials Market
Figure 8 Consumer Electronics Segment and China Accounted for the Largest Share of the APAC Market
Figure 9 China to Witness the Fastest Growth Rate in the Market
Figure 10 Drivers, Restraints, Opportunities, and Challenges in the Wearable Materials Market
Figure 11 Wearable Materials Market: Porter�s Five Forces Analysis
Figure 12 Consumer Electronics to Be the Largest Application of Wearable Materials
Figure 13 Emerging Economies to Be the New Hotspot for the Wearables Materials Market
Figure 14 North America: Wearable Materials Market Snapshot
Figure 15 APAC: Wearable Materials Market Snapshot
Figure 16 Companies Adopted Both Organic and Inorganic Growth Strategies Between 2015 and 2017
Figure 17 Ranking of Key Players in 2017
Figure 18 BASF: Company Snapshot
Figure 19 BASF: SWOT Analysis
Figure 20 Dowdupont: Company Snapshot
Figure 21 Dowdupont: SWOT Analysis
Figure 22 Wacker Chemie: Company Snapshot.
Figure 23 Wacker Chemie: SWOT Analysis
Figure 24 DSM: Company Snapshot
Figure 25 DSM: SWOT Analysis
Figure 26 Arkema: Company Snapshot
Figure 27 Arkema: SWOT Analysis
Figure 28 Eastman Corporation: Company Snapshot
Figure 29 Shin-Etsu: Company Snapshot
Figure 30 Elkem: Company Snapshot
Figure 31 Momentive Performance Materials: Company Snapshot
The study involved four major activities in estimating the current market size for wearable materials. Exhaustive secondary research was done to collect information on the market, peer market, and parent market. The next step was to validate these findings, assumptions, and sizing with industry experts across the value chain through primary research. Both the top-down and bottom-up approaches were employed to estimate the complete market size. Thereafter, the market breakdown and data triangulation methodologies were used to estimate the market size of the segments and subsegments.
Secondary Research
In the secondary research process, various secondary sources such as Hoovers and Bloomberg BusinessWeek have been referred to identify and collect information for this study. These secondary sources included annual reports, press releases & investor presentations of companies; white papers; certified publications; articles by recognized authors; food safety organizations, regulatory bodies; and databases.
Primary Research
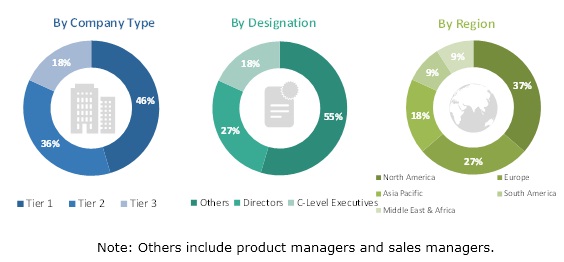
The wearable materials market comprises several stakeholders such as raw material suppliers, distributors of wearable materials, and regulatory organizations in the supply chain. The demand side of this market consists of manufacturers of medical appliances and industrial appliances, whereas, the supply side consists of wearable material manufacturers. Various primary sources from both the supply and demand sides of the market were interviewed to obtain qualitative and quantitative information. Following is the breakdown of primary respondents:
To know about the assumptions considered for the study, download the pdf brochure
Market Size Estimation
Both the top-down and bottom-up approaches were used to estimate and validate the total size of the wearable materials market. These methods were also used extensively to estimate the size of various subsegments in the market. The research methodology used to estimate the market size includes the following:
- The key players in the industry and markets have been identified through extensive secondary research.
- The industry�s market size, in terms of value, have been determined through primary and secondary research processes.
- All percentage shares, splits, and breakdowns have been determined using secondary sources and verified through primary sources.
Data Triangulation
After arriving at the overall market size-using the market size estimation processes as explained above�the market was split into several segments and subsegments. In order to complete the overall market engineering process and arrive at the exact statistics of each market segment and subsegment, the data triangulation and market breakdown procedures were employed, wherever applicable. The data was triangulated by studying various factors and trends from both the demand and supply sides.
Objectives of the Study:
- To define, describe, and forecast the wearable material market in terms of value
- To provide detailed information about the key factors influencing the growth of the market (drivers, restraints, and opportunities)
- To analyze and forecast the market by type and end-use industry
- To forecast the size of the market with respect to five regions, namely, North America, Europe, APAC, Middle East & Africa, and South America along with their key countries
- To strategically analyze micromarkets1 with respect to individual growth trends, prospects, and their contribution to the total market
- To analyze the opportunities in the market for stakeholders and provide a competitive landscape for market leaders
- To analyze competitive developments such as new product launch, expansion, and acquisition in the market
- To strategically profile key players and comprehensively analyze their market shares and core competencies2
Note1: Micromarkets are the subsegments of the wearable materials market included in the report.
Note2: Core competencies of companies are determined in terms of their key developments, SWOT analysis, and key strategies adopted by them to sustain in the market.
Available Customizations:
Along with the market data, MarketsandMarkets offers customizations according to the specific needs of the companies. The following customization options are available for this report:
Product Analysis
- A product matrix that provides a detailed comparison of the product portfolio of each company
Regional Analysis
- Further breakdown of the Rest of APAC wearable materials market
Company Information:
- Detailed analysis and profiles of additional market players


Growth opportunities and latent adjacency in Wearable Materials Market