Well Cementing Services Market by Type (Primary, Remedial & Others), by Application (Onshore & Offshore) and Casing Equipment Market by Application (Onshore & Offshore) - Global Trends and Forecasts to 2019


[185 Pages Report] Well Cementing is the most important aspect of the well completion process; it plays a critical role in permanently stopping water from penetrating the well. The basic function of Well Cementing Services is to seal the lost circulation zone and areas where there is reduced flow within the wellbore. There are three basic purposes of cementing, namely, zonal isolation and segregation, corrosion control and formation stability, and pipe strength improvement. When these functions are achieved, production and stimulation operations are conducted.
A successful cement job requires that the pumped slurry is the same that was designed and tested in the laboratory, control of mixing water quality, control of the dry material and the cement, and that the slurry additives tested in the laboratory are the same for actual operations.
The Well Cementing Services Market is segmented on the basis of its types and applications. These are further broken down into different geographies. Leading players of this industry, along with their recent developments and other strategic industry activities, are profiled in the report. The top five companies are Halliburton (U.S.), Schlumberger (U.S.), Baker Hughes (U.S.), Trican Well Service Ltd. (Canada) and Calfrac Well Service Ltd. (U.S.).
Well Cementing Services Market Size, By Application ($Million)
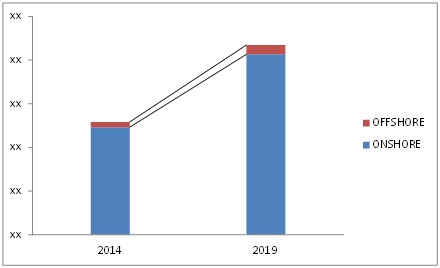
Source: MarketsandMarkets Analysis
The Well Cementing Services Market is projected to witness significant growth especially with respect to the offshore application. The offshore segment market is estimated to grow at a CAGR of 12.4% from 2014 to 2019. As the exploration and production activities are venturing into deeper waters, the key market players operating in this industry are compelled to find innovative methods to avail of the new opportunities present in the offshore Well Cementing Services industry.
The market is also analyzed with respect to Porter's Five Force model. Analysis of the sector�s value chain and the various factors affecting the stages of the chain has been conducted to assess and evaluate the five forces of Porter�s model. The report also provides a competitive landscape of major market players that includes mergers and acquisition, business expansion, agreements and collaborations, contracts signed, and new technologies innovated. Key developments have been mapped against the market players involved in order to determine the growth strategies implemented by the leaders within the segment. The study provides a comprehensive review of major market drivers, restraints, opportunities, winning imperatives, and key burning issues in the market.
This report also focuses on well casing equipment, which is an integral part of well cementing services. Casing equipment are pipe-like structures introduced into the wellbore to isolate and define the passage of hydrocarbons from the well formation. The casing equipment market is expected to grow at a CAGR of 12% from 2014 to 2019, while Asia-Pacific is expected to show the highest CAGR from 2014 to 2019.
Scope of the Report:
The global Well Cementing Services Market is analyzed in terms of revenue ($million) for the aforesaid type and application, and by regions.
By Type- Primary Cementing
- Remedial Cementing
- Other Cementing (Plug Abandonment)
By Product category
- Onshore Cementing
- Offshore Cementing
Casing Equipment Market
- By Application (Onshore & Offshore)
- By Region
By Geography
- North America
- South and Central America
- Asia-Pacific
- Middle East
- Africa
- Europe
Well Cementing Services basically refers to pumping cement slurry into the well. It performs the key function of sealing the annulus after the casing string has been run into the wellbore. The global market is projected to exhibit high growth on account of rising onshore and offshore development activities, increasing energy demands in emerging economies, rising capital expenditure in E&P operations, rising sub-sea construction activities and the shale boom in the U.S. The global market was valued at $11,488.6 million in 2013. It is projected to grow at a CAGR of 10.9% for the forecast period 2014-2019, owing to the increase in the number of wells, globally.
North America holds the major well cementing services market share followed by Asia-Pacific and Europe. In terms of a country-level scenario, the market is dominated by the U.S. on account of the increasing number of deep water offshore wells due to which more cementing for the construction of oil and gas wells is needed. Due to the rising energy demand and redevelopment of mature oilfield wells, the demand for well cementing is high even in Asia-Pacific. China alone holds approximately 22% of the global market. Increased well construction activities and pressure pumping activities in China have led to an increase in the demand for cementing services.
By application, offshore cementing is estimated to dominate the market in terms of growth rate. Asia-Pacific and Europe currently lead the offshore cementing market in terms of market value. With respect to market by type, there is higher demand for primary cementing, with North America and Asia-Pacific leading in terms of market share.
Well Cementing Services Market Size, By Geography ($Million)
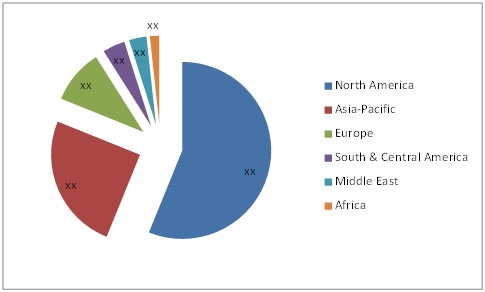
Source: MarketsandMarkets Analysis
The market is growing exponentially, due to the increasing investments by E&P companies and the expectations of an oil price hike in the long run. This prospective growth is evident from the strategies adopted by the key players operating in this industry. Companies are aiming to invest in different countries to expand their businesses.
The top five companies in the Well Cementing Services industry are Halliburton (U.S.), Schlumberger (U.S.), Baker Hughes (U.S.), Trican Well Service Ltd. (Canada), and Calfrac Well Service Ltd. (Canada).
 Exclusive indicates content/data unique to MarketsandMarkets and not available with any competitors.
Table Of Contents
1. Introduction
1.1.Objectives Of The Study
1.2.Markets Covered
1.3.Stakeholders
1.4.Market Scope
2. Research Methodology
2.1.Introduction
2.2.Market Size Estimation
2.3.Market Crackdown Using Primary And Secondary Sources
2.3.1.Market Crackdown And Data Triangulation
2.4.Market Estimation
2.4.1.Key Data Points From Secondary Sources
2.4.2.Key Data Points Taken From Primary Sources
2.5.Assumptions
3. Executive Summary
4. Premium Insights
4.1.Attractive Market Opportunities In North America
4.2.Well Cementing Services Market By Application
4.3.Well Cementing Services Market In North America
4.4.Well Cementing Services Market Is Equally Dispersed Throughout The Globe
4.5.Well Cementing Services Market By Type
4.6.Well Cementing Market : Largest Markets
4.7.Well Cementing Services By Region
4.8.Life Cycle Analysis By Region
5. Market Overview
5.1.Introduction
5.2.Evolution
5.3.Parent Market
5.4.Market Segmentation
5.4.1.Cementing Services By Type
5.4.2.Cementing Services By Application
5.4.3.Cementing Services By Geography
5.5.Market Dynamics
5.5.1.Drivers
5.5.1.1.Rising Capital Expenditure In E&P Operations
5.5.1.2.Rising Onshore & Offshore Drilling Activities
5.5.1.3.Shale Boom In The U.S.
5.5.1.4.Aged & Matured Wells
5.5.1.5.Increasing Energy Demand In Developing Countries
5.5.2. Restraints
5.5.2.1.Limited Access To Reserves
5.5.2.2.Local Content Requirement
5.5.3. Opportunities
5.5.3.1.New Shale Discoveries In China And Australia
5.5.3.2.Technological Advancements
5.5.4. Challenges
5.5.4.1.Shortage Of Technical Professionals
5.5.4.2.Managing Growing Environmental Concerns
6. Industry Trends
6.1.Introduction
6.2.Supply Chain
6.2.1.Key Influencers
6.3. Industry Trends
6.4. Porters� Five Forces Model
6.4.1.Threat Of Substitutes
6.4.2.Threat Of New Entrants
6.4.3.Bargaining Power Of Buyers
6.4.4.Bargaining Power Of Suppliers
6.4.5.Degree Of Competition
7. Well Cementing Services Market By Type, 2012 � 2019 ($Million)
7.1.Introduction � Market Trends
7.2.Primary Cementing
7.3.Remedial Cementing
7.4.Others
8. Well Cementing Services Market By Application, 2012 � 2019 ($Million)
8.1.Introduction � Market Trends
8.2.Onshore
8.3.Offshore
9. Casing Equipment Market
9.1.Introduction
9.2.Casing Equipment Market Overview
9.3.Casing Equipment (Hardware) Market By Application, 2012 � 2019 ($Million)
9.3.1. Onshore
9.3.2. Offshore
9.4. Casing Equipment By Geography
9.4.1. North America
9.4.2. Europe
9.4.3. Latin America
9.4.4. Asia-Pacific
9.4.5. Middle East
9.4.6. Africa
10. Well Cementing Services Market By Geography, 2012 � 2019 ($Million)
10.1.Introduction � Market Trends
10.2.North America
10.2.1.U.S
10.2.2.Canada
10.3.Europe
10.3.1.Russia
10.3.2.U.K.
10.3.3.Others
10.4. Asia-Pacific
10.4.1.China
10.4.2.India
10.4.3.Australia
10.4.4.Others
10.5. Middle East
10.5.1.Saudi Arabia
10.5.2.U.A.E.
10.5.3.Others
10.6. Africa
10.6.1.Angola
10.6.2.Nigeria
10.6.3.Others
10.7. Latin America
10.7.1. Brazil
10.7.2. Argentina
10.7.3. Mexico
10.7.4. Others
11. Competitive Landscape
11.1.Introduction
11.2.Key Strategies
11.3.Market Share Analysis, (By Key Players)
11.4.Competitive Situation & Trends
11.5.Battle For Market Share: Contracts & Agreements Is The Key Strategy
11.6.Contract Agreements
11.7.Mergers & Acquisitions
11.8.New Product Launch
12. Company Profiles
12.1.Halliburton
12.1.1.Introduction
12.1.2.Products & Services
12.1.3.Strategy & Insights
12.1.4.Swot Analysis
12.1.5.Developments
12.1.6.Mnm View
12.2.Schlumberger Ltd.
12.2.1.Introduction
12.2.2.Products & Services
12.2.3.Strategy & Insights
12.2.4.Swot Analysis
12.2.5.Developments
12.2.6.Mnm View
12.3.Baker Hughes Inc.
12.3.1.Introduction
12.3.2.Products & Services
12.3.3.Strategy & Insights
12.3.4.Swot Analysis
12.3.5.Developments
12.3.6.Mnm View
12.4.Trican Well Service Ltd.
12.4.1.Introduction
12.4.2.Products & Services
12.4.3.Strategy & Insights
12.4.4.Swot Analysis
12.4.5.Developments
12.4.6.Mnm View
12.5.Calfrac Well Services Ltd.
12.5.1.Introduction
12.5.2.Products & Services
12.5.3.Strategy & Insights
12.5.4.Swot Analysis
12.5.5.Developments
12.5.6.Mnm View
12.6.Nabors Industries Ltd.
12.6.1.Introduction
12.6.2.Products & Services
12.6.3.Strategy & Insights
12.6.4.Developments
12.7.Sanjel Corp.
12.7.1.Introduction
12.7.2.Products & Services
12.7.3.Strategy & Insights
12.7.4.Developments
12.8.Condor Energy Services Ltd
12.8.1.Introduction
12.8.2.Products & Services
12.8.3.Strategy & Insights
12.8.4.Developments
12.9.Gulf Energy Llc
12.9.1.Introduction
12.9.2.Products & Services
12.9.3.Strategy & Insights
12.9.4.Developments
12.10.China Oilfield Services Ltd
12.10.1.Introduction
12.10.2.Products & Services
12.10.3.Strategy & Insights
12.10.4.Developments
12.11.Weatherford
12.11.1.Introduction
12.11.2.Products & Services
12.11.3.Strategy & Insights
12.11.4.Swot Analysis
12.11.5.Developments
12.11.6.Mnm View
12.12.Top-Co
12.12.1.Introduction
12.12.2.Products & Services
12.12.3.Strategy & Insights
12.12.4.Swot Analysis
12.12.5.Developments
12.12.6.Mnm View
12.13.Tenaris
12.13.1.Introduction
12.13.2.Products & Services
12.13.3.Strategy & Insights
12.13.4.Swot Analysis
12.13.5.Developments
12.13.6.Mnm View
12.14.Valluorec
12.14.1.Introduction
12.14.2.Products & Services
12.14.3.Strategy & Insights
12.14.4.Swot Analysis
12.14.5.Developments
12.14.6.Mnm View
12.15.Tmk
12.15.1.Introduction
12.15.2.Products & Services
12.15.3.Strategy & Insights
12.15.4.Swot Analysis
12.15.5.Developments
12.15.6.Mnm View
List Of Tables (63 Tables)
Table 1 Well Cementing Services Market Size, By Type, 2014-2019 ($ Mllion)
Table 2 Primary Well Cementing Services Market Size, By Region, 2014-2019($Million)
Table 3 Remedial Well Cementing Services Market Size, By Region, 2014-2019($Million)
Table 4 Other Well Cementing Services Market Size, By Region, 2014-2019($Million)
Table 5 Market Size, By Product Category, 2012-2019 ($Million)
Table 6 Onshore Market Size, By Region, 2012-2019 ($Million)
Table 7 Offshore Market Size, By Region, 2012-2019 ($Million)
Table 8 Casing Equipment Market Size, By Application, 2014-2019($Million)
Table 9 Casing Equipment, By Geography, 2014-2019 ($Million)
Table 10 Cementing Services Market Size, By Region, 2012-2019 ($Million)
Table 11 North America: Well Cementing Services Market Size, By Country, 2012-2019($Million)
Table 12 U.S.: Well Cementing Services Market Size, By Type, 2012-2019 ($Million)
Table 13 U.S.: Well Cementing Services Market Size, By Product Category, 2012-2019 ($Million)
Table 14 Canada: Market Size, By Type, 2012-2019 ($Million)
Table 15 Canada: Market Size, By Product Category, 2012-2019($Million)
Table 16 Mexico: Market Size, By Type, 2012-2019 ($Million)
Table 17 Mexico: Market Size, By Product Category, 2012-2019($Million)
Table 18 Europe: Market Size, By Country, 2012-2019 ($Million)
Table 19 U.K.: Market Size, By Type, 2012-2019 ($Million)
Table 20 U.K.: Market Size, By Product Category, 2012-2019 ($Million)
Table 21 Germany: Market Size, By Type, 2012-2019 ($Million)
Table 22 Germany: Market Size, By Product Category, 2012-2019($Million)
Table 23 France: Market Size, By Type, 2012-2019 ($Million)
Table 24 France: Market Size, By Product Category, 2012-2019($Million)
Table 25 Rest Of Europe: Well Cementing Services Market Size, By Type, 2012-2019($Million)
Table 26 Rest Of Europe: Market Size, By Product Category, 2012-2019($Million)
Table 27 Latin America: Market Size, By Country, 2012-2019($Million)
Table 28 Brazil: Market Size, By Type, 2012-2019 ($Million)
Table 29 Brazil: Market Size, By Product Category, 2012-2019 ($Million)
Table 30 Argentina: Market Size, By Type, 2012-2019 ($Million)
Table 31 Argentina: Market Size, By Product Category, 2012-2019 ($Million)
Table 32 Rest Of Latin America: Market Size, By Type, 2012-2019($Million)
Table 33 Rest Of Latin America: Market Size, By Product Category, 2012-2019($Million) Table 34 The Middle East: Market Size, By Country, 2012-2019($Million)
Table 35 UAE: Well Cementing Services Market Size, By Type, 2012-2019 ($Million)
Table 36 UAE: Well Cementing Services Market Size, By Product Category, 2012-2019 ($Million)
Table 37 Qatar: Well Cementing Services Market Size, By Type, 2012-2019 ($Million)
Table 38 Qatar: Well Cementing Services Market Size, By Product Category, 2012-2019 ($Million)
Table 39 Kuwait: Market Size, By Type, 2012-2019 ($Million)
Table 40 Kuwait: Market Size, By Product Category, 2012-2019($Million)
Table 41 Rest Of The Middle East: Market Size, By Type, 2012-2019 ($Million)
Table 42 Rest Of The Middle East: Market Size, By Product Category, 2012-2019($Million)
Table 43 Asia-Pacific: Market Size, By Country, 2012-2019($Million)
Table 44 China: Market Size, By Type, 2012-2019 ($Million)
Table 45 China: Market Size, By Product Category, 2012-2019 ($Million)
Table 46 India: Market Size, By Type, 2012-2019 ($Million)
Table 47 India: Market Size, By Product Category, 2012-2019 ($Million)
Table 48 Australia: Market Size, By Type, 2012-2019 ($Million)
Table 49 Australia: Market Size, By Product Category, 2012-2019($Million)
Table 50 Japan: Market Size, By Type, 2012-2019 ($Million)
Table 51 Japan: Market Size, By Product Category, 2012-2019 ($Million)
Table 52 Rest Of Asia-Pacific: Market Size, By Type, 2012-2019($Million)
Table 53 Rest Of Asia-Pacific: Market Size, By Product Category, 2012-2019 ($Million)
Table 54 Africa: Market Size, By Country, 2012-2019 ($Million)
Table 55 South Africa: Market Size, By Type, 2012-2019($Million)
Table 56 South Africa: Market Size, By Product Category, 2012-2019 ($Million)
Table 57 Rest Of Africa: Market Size, By Type, 2012-2019($Million)
Table 58 Rest Of Africa: Market Size, By Product Category, 2012-2019($Million)
Table 59 New Product Launch, 2011-2014
Table 60 Contracts & Agreements, 2011-2014
Table 61 Mergers & Acquisitions, 2011-2014
Table 62 Expansion, 2011-2014
Table 63 Recent Developments
List Of Figures (46 Figures)
Figure 1 Global Market Segmentations
Figure 2 Global Market: Research Methodology
Figure 3 Market Size Estimation Methodology: Bottom-Up Approach
Figure 4 Market Size Estimation Methodology: Top-Down Approach
Figure 5 Cementing Servicess Market Snapshot (2013 Vs 2018): Onshore Well Cementing Services To Lead The Market In The Next Five Years
Figure 6 Cementing Servicess Market Size, By Application, 2014 ($Million)
Figure 7 Cementing Servicess Market Share, By Geography, 2014
Figure 8 Increasing E&P Activities Driving The Well Cementing Services Market
Figure 9 Offshore Well Cementing Growing At A Higher Rate In Well Cementing Services
Figure 10 Onshore Well Cementing Has Majority Share In The North American Market
Figure 11 Europe Will Remain The Fastest Growing Market
Figure 12 Primary Well Cementing Services Will Continue To Dominate The Cementing Servicess Market In The Next Five Years
Figure 13 Largest Markets For Well Cementing Services
Figure 14 North America Will Continure To Dominate The Well Cementing Services Market
Figure 15 Shale Boom Is U.S. Is Expected To Further Drive The Growth In The Market
Figure 16 Well Cementing Services Evolution: Timeline
Figure 17 Market Segmentation: By End-User
Figure 18 Market Segmentation: By Product Categories
Figure 19 Market Segmentation: By Geography
Figure 20 Cementing Servicess: Selection Parameters
Figure 21 Supply Chain:
Figure 22 Porter�S Five Forces Analysis (2014)
Figure 23 Geographic Snapshot (2013) � Rapid Growth Markets Are Emerging As New Hot Spots
Figure 24 China � An Attractive Destination For All Applications
Figure 25 Companies Adopted Product Innovation As The Key Growth Strategy Over The Last Three Years
Figure 26 Market Share Analysis Of The Top Players, 2013
Figure 27 Battle For Market Share: New Product Launch Is The Key Strategy (2011-2014)
Figure 28 Geographic Revenue Mix Of Top Five Players
Figure 29 Halliburton: Company Snapshot
Figure 30 Halliburton: Swot Analysis
Figure 31 Schlumberger, Ltd.: Company Snapshot
Figure 32 Schlumberger, Ltd.: Swot Analysis
Figure 33 Baker Hughes Inc.: Company Snapshot
Figure 34 Baker Hughes Inc.: Swot Analysis
Figure 35 Trican Well Services Ltd.: Company Snapshot
Figure 36 Calfrac Well Services Ltd.: Company Snapshot
Figure 37 Calfrac Well Services Ltd.: Swot Analysis
Figure 38 Nabors Industries Ltd.: Company Snapshot
Figure 39 Sanjel Corp.: Company Snapshot
Figure 40 Condor Energy Services Ltd.: Company Snapshot
Figure 41 Gulf Energy Llc: Company Snapshot
Figure 42 China Oilfield Services Ltd.: Company Snapshot
Figure 43 Top-Co: Company Snapshot
Figure 44 Tenaris: Company Snapshot
Figure 45 Valluorec: Company Snapshot
Figure 46 Tmk: Company Snapshot


Growth opportunities and latent adjacency in Well Cementing Services Market