Modular Data Center Market by Solution (All-in-one and Prefabricated Modules [IT, Power, Cooling]), Form Factor (ISO Containers [20 feet, 40 feet], Enclosures, Skid-mounted), Build Type (Semi-prefabricated, Fully-prefabricated) – Global Forecast to 2031

icon1
USD 93.6 BN
MARKET SIZE, 2031
icon2
CAGR 18.0%
(2026-2031)
icon3
384
REPORT PAGES
icon4
358
MARKET TABLES

OVERVIEW

modular-data-centers-market Overview

Source: Secondary Research, Interviews with Experts, MarketsandMarkets Analysis

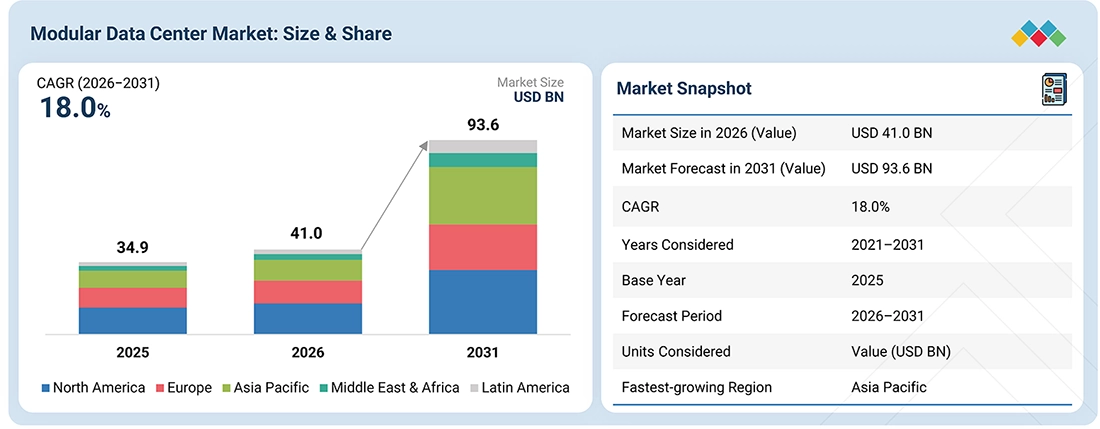
The global modular data center market is expected to witness significant growth from USD 41.0 billion in 2026 to USD 93.6 billion in the year 2031, with a CAGR of 18% during the forecast period 2026 to 2031, driven by the increasing demand for scalable and rapidly deployable digital infrastructure, growing adoption of cloud computing, and the proliferation of AI-driven applications. Rising data generation and processing requirements are compelling organizations to expand data center capacity while minimizing deployment timelines, capital expenditure, and operational complexity. These factors are accelerating the adoption of prefabricated and modular data center solutions, which offer standardized designs, flexible capacity expansion, and faster installation compared with conventional data center infrastructure. In addition, the increasing deployment of edge computing facilities and the growing need for energy-efficient and advanced cooling solutions are creating opportunities for modular data center providers. The continued expansion of hyperscale cloud infrastructure and investments in digital infrastructure across developed and emerging economies are further supporting market growth. As data center operators increasingly prioritize scalability, deployment speed, operational efficiency, and adaptability to evolving workloads, demand for modular data center solutions is expected to increase significantly during the forecast period.

Market Size and Forecast:

  • Market Size Value in 2025: USD 34.9 Billion
  • Market Size Value in 2026: USD 41.0 Billion
  • Revenue Forecast in 2031: USD 93.6 Billion
  • Growth Rate: CAGR of 18.0% from 2026 to 2031
  • Data available from 2021 to 2031
  • Base year: 2025
  • Forecast period: 2026-2031
  • Fastest Growing Region: Asia Pacific
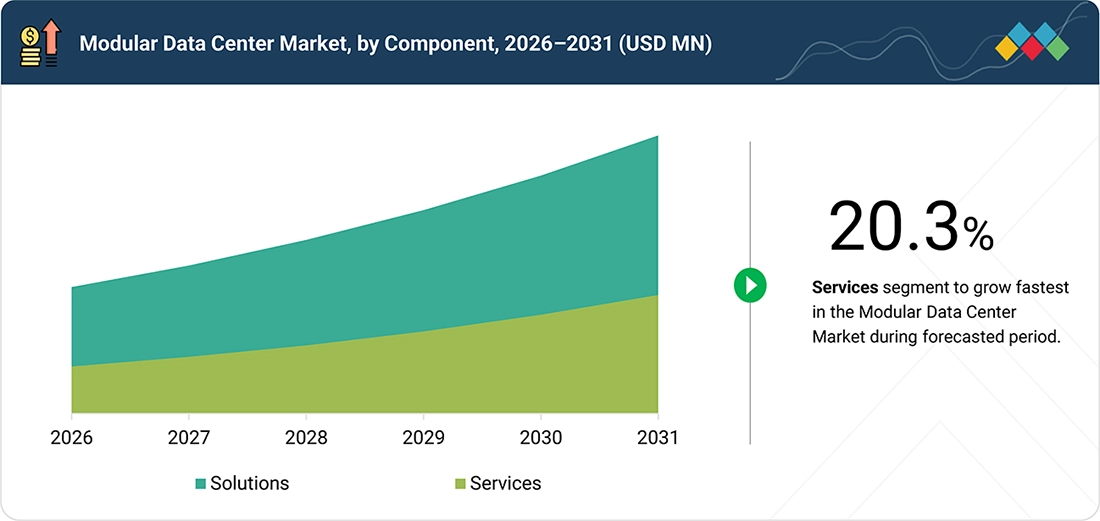
  • Services segment is expected to grow at the highest CAGR of 20.3% during the forecast period.

Key Market Trends and Insights

  • Future Outlook: The Modular Data Center Market is driven by demand for scalable infrastructure, cloud computing, and AI applications.
  • Key Growth Drivers: Cloud adoption, scalable data center infrastructure, and investments in AI, IoT, 5G, and edge computing are driving market growth.
  • Latest Trends: Growing adoption of prefabricated infrastructure, edge computing, and energy-efficient power and cooling solutions.
  • Growth Opportunities: Rising AI, IoT, 5G, and edge computing deployments are creating opportunities for modular data center providers.

KEY TAKEAWAYS

  • By Component
    The solution segment is expected to hold the largest market value of USD 29,852.4 million by 2026.
  • By Build Type
    The all-in-one data center segment is projected to grow at the highest CAGR of 19.6% during the forecast period.
  • By Form Factor
    The skid-mounted systems segment is projected to grow at the fastest rate at a CAGR of 21.2% during the forecast period.
  • By Data Center Size
    Large-sized data center is expected to dominate the market in 2026.
  • By Deployment Type
    Outdoor is expected to grow at the fastest CAGR during the forecast period.
  • By End User
    By end user, the enterprise data center is expected to account for USD 7,993.1 million in 2025.
  • Competitive Landscape - Key Players
    Vertiv, Schneider Electric, Huawei, ABB, and Stulz were identified as some of the star players in the global modular data center market, given their strong market share and product footprint.
  • Competitive Landscape - Startups/SMEs
    TAS, Total Site Solutions, Industrial ElectriC Mfg-(IEM), Modular Power Solutions, and Cannon Technologies have distinguished themselves among startups and SMEs by securing strong footholds in the Global modular data center market.

The global modular data center market is gaining significant momentum as organizations increasingly seek infrastructure solutions that can be deployed rapidly, scaled efficiently, and operated with greater flexibility. The growing adoption of cloud computing, edge computing, 5G networks, and AI-driven workloads is driving demand for modular data center solutions across enterprises, cloud service providers, telecom operators, and government organizations. In parallel, increasing emphasis on energy efficiency and sustainability is encouraging data center operators to adopt modular designs incorporating energy-efficient power and cooling systems. Modular data centers enable organizations to reduce deployment timelines, optimize capital expenditure, enhance operational resilience, and accommodate incremental capacity requirements. As digital transformation initiatives and data-intensive workloads continue to expand globally, the demand for flexible, scalable, and efficient modular data center infrastructure is expected to increase during the forecast period.

TRENDS & DISRUPTIONS IMPACTING CUSTOMERS' CUSTOMERS

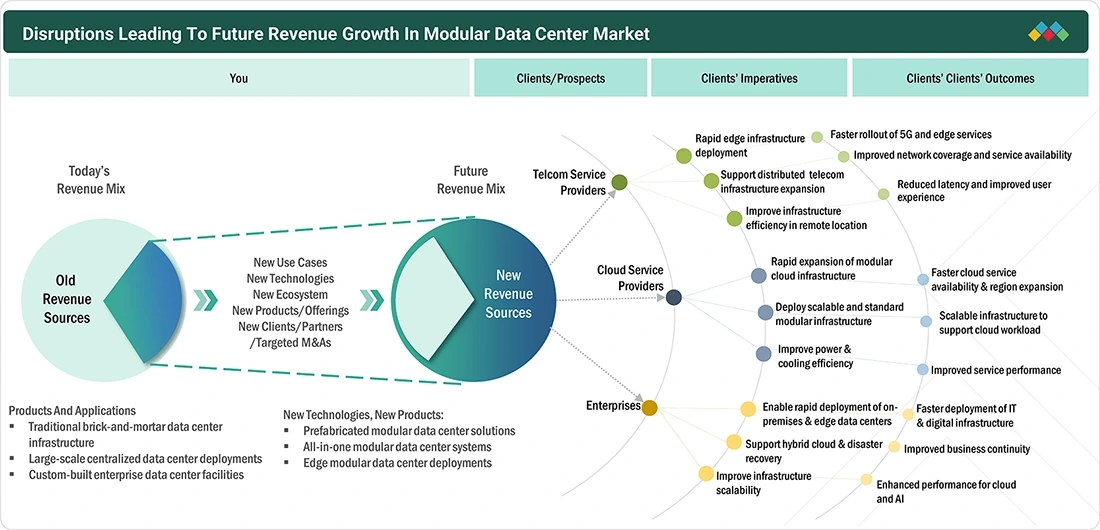
The global modular data center market is being shaped by the rapid proliferation of artificial intelligence (AI), cloud computing, and hyperscale data center investments, which are driving demand for faster, scalable, and more efficient infrastructure deployment. The increasing adoption of edge computing and distributed data center architectures is further supporting market growth, particularly for low-latency applications and real-time data processing. In addition, growing emphasis on energy efficiency and sustainability is encouraging data center operators to deploy advanced cooling technologies, optimized power infrastructure, and energy-efficient modular designs. Government-led digitalization initiatives, smart city developments, and investments in digital infrastructure across developed and emerging economies are further accelerating data center capacity expansion. These trends are driving a shift toward modular data center solutions that offer rapid deployment, scalability, operational efficiency, and flexibility to accommodate evolving workloads and infrastructure requirements.

modular-data-centers-market Disruptions

Source: Secondary Research, Interviews with Experts, MarketsandMarkets Analysis

MARKET DYNAMICS

Drivers
Impact
Level
  • Rising Adoption of Cloud Computing and Services
  • Mobility, scalability, and disaster recovery benefits
RESTRAINTS
Impact
Level
  • High Initial Capital Expenditure
  • High electricity consumption and power infrastructure requirements
OPPORTUNITIES
Impact
Level
  • Rising Demand for IoT, AI, and 5G-Driven Data Infrastructure
  • Growth in edge computing deployment
CHALLENGES
Impact
Level
  • Scalability in Large Data Center Projects
  • Limited customization for specialized needs & increased maintenance complexity

Source: Secondary Research, Interviews with Experts, MarketsandMarkets Analysis

Driver: Rising Adoption of Cloud Computing and Services

The growing adoption of cloud computing and cloud-based services is a key driver of the global modular data center market. The increasing migration of workloads to cloud environments, particularly among small and medium-sized enterprises (SMEs), is creating demand for scalable, flexible, and rapidly deployable data center infrastructure. Modular data centers enable organizations to expand IT capacity in a phased manner and deploy infrastructure more quickly than traditional data center facilities. This flexibility allows cloud service providers and enterprises to efficiently accommodate increasing data volumes, changing workload requirements, and new service deployments while optimizing capital and operational expenditures.

Restraint: High Initial Capital Expenditure

High initial capital expenditure can act as a significant restraint on the growth of the global modular data center market, particularly for SMEs and organizations with constrained investment budgets. Although modular data centers can deliver long-term cost savings through faster deployment, standardized designs, and operational efficiencies, the upfront costs associated with purchasing, transporting, installing, integrating, and commissioning modular infrastructure can be substantial. The financial burden may discourage organizations from adopting modular solutions, especially when conventional data center infrastructure or incremental capacity expansion appears more cost-effective in the short term. In addition, investments in supporting power, cooling, networking, and monitoring infrastructure can further increase initial deployment costs. This challenge is particularly pronounced among budget-sensitive end users, where emphasis on near-term capital expenditure may outweigh the long-term benefits of scalability, flexibility, and operational efficiency offered by modular data centers, thereby limiting market adoption.

Opportunity: Rising Demand for IoT, AI, and 5G-Driven Data Infrastructure

The growing adoption of artificial intelligence (AI), Internet of Things (IoT), and 5G technologies is creating significant opportunities for the global modular data center market. The rapid deployment of AI and machine learning applications is increasing demand for high-performance computing and scalable data center infrastructure capable of supporting growing processing and storage requirements. At the same time, the expansion of IoT applications and 5G networks is driving the need for distributed and localized data processing to enable low-latency connectivity and real-time decision-making across industries. Modular data centers, with their standardized architecture, rapid deployment capabilities, and flexible scalability, are well positioned to support these evolving infrastructure requirements. The increasing deployment of edge computing environments to bring processing capabilities closer to end users and connected devices is further creating opportunities for modular data center solutions. As AI, IoT, and 5G ecosystems continue to expand, the demand for reliable, scalable, and rapidly deployable data center infrastructure is expected to create significant growth opportunities for modular data center providers.

Challenge: Scalability in Large Data Center Projects

Scalability in large-scale data center projects remains a key challenge for the global modular data center market. Although modular solutions offer flexibility and faster deployment, scaling multiple modules to accommodate rapidly increasing capacity requirements can involve significant planning, coordination, and integration complexities. Ensuring seamless interoperability among multiple modules is essential to maintain consistent performance, reliability, and operational efficiency as infrastructure expands. Large-scale deployments can also face logistical challenges related to the transportation, installation, commissioning, and integration of modular components, particularly across geographically dispersed or constrained sites. In addition, variations in module designs, technologies, interfaces, and infrastructure standards can create interoperability and standardization challenges when integrating modules from different suppliers or expanding existing facilities. These factors can increase project complexity and deployment costs, potentially limiting the scalability of modular solutions for large and rapidly expanding data center projects.

MODULAR DATA CENTER MARKET: COMMERCIAL USE CASES ACROSS INDUSTRIES

COMPANY USE CASE DESCRIPTION BENEFITS
company logo
Luzhou’s Smart City program required a rapidly deployable, energy-efficient, and highly reliable data center to support large-scale municipal digitalization. Huawei’s modular data center addressed challenges related to tight timelines, limited construction experience, and stringent PUE requirements, enabling seamless cloud migration and strengthening the city’s technology-driven urban development. The modular deployment reduced implementation time by nearly 50%, ensuring faster project readiness while achieving a low PUE for substantial energy savings. High-redundancy design delivered 99.999% power uptime for critical services, and Huawei’s NetEco platform automated O&M tasks, reducing maintenance labor by 80% and improving operational efficiency.
company logo
MEEZA required rapid, scalable data center expansion to support Qatar’s 2030 Digital Transformation goals and meet the immediate infrastructure demands of the FIFA World Cup 2022. Vertiv delivered modular and hybrid solutions that integrated seamlessly with existing facilities, enabling fast deployment, high capacity, and efficient project execution under tight timelines. The collaboration enabled the timely delivery of a scalable hybrid data center, significantly reducing deployment time through parallel module preparation. Evaporative cooling improved energy efficiency, lowering power consumption, while seamless integration with existing infrastructure and contractor training ensured smooth implementation and enhanced long-term operational performance.
company logo
Animal Logic required a high-density, low-latency data center to support growing rendering demands and accelerate production workflows. With a tight four-and-a-half-month timeline, Schneider Electric delivered a customized prefabricated modular solution with optimized power, cooling, and real-time monitoring to enhance performance and meet future high-performance computing needs. The solution boosted animation productivity with render performance reaching 1.25 petaflops, eliminating latency bottlenecks and accelerating production. Seamless on-premise integration improved operational reliability, while 24/7 remote monitoring ensured continuous uptime and rapid issue resolution, strengthening overall efficiency and supporting long-term scalability.

Logos and trademarks shown above are the property of their respective owners. Their use here is for informational and illustrative purposes only.

MARKET ECOSYSTEM

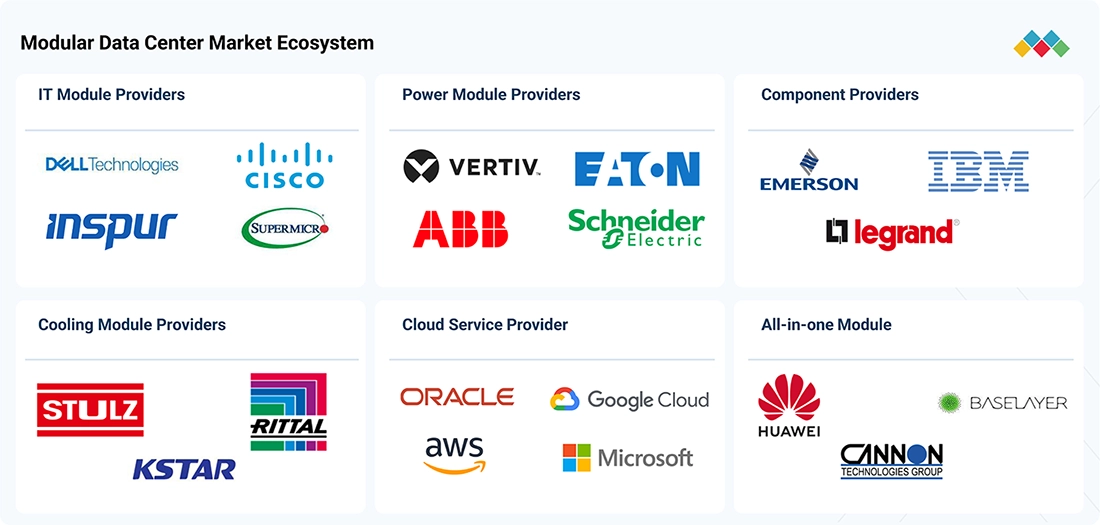
The market operates through a collaborative ecosystem, which includes technology providers, infrastructure specialists, and system integrators who work together to deliver complete solutions. Modular data center manufacturers design their products to use prefabricated and containerized systems, which enable quicker deployment and expansion capabilities. IT infrastructure providers deliver computing and networking equipment while power and cooling experts maintain system performance and efficiency throughout operational periods. The deployment process requires engineering firms and integrators to provide installation and execution support, which enables system installation across hyperscale, enterprise, and edge environments across the globe.

modular-data-centers-market Ecosystem

Logos and trademarks shown above are the property of their respective owners. Their use here is for informational and illustrative purposes only.

MARKET SEGMENTS

modular-data-centers-market Segments

Source: Secondary Research, Interviews with Experts, MarketsandMarkets Analysis

Global Modular Data Center Market, By Component

The solutions segment accounts for the largest share because modular data center deployments globally are typically implemented as fully integrated infrastructure packages rather than individual components. Hyperscale cloud, AI, and digital transformation projects require the coordinated deployment of critical infrastructure, including power, cooling, racks, and monitoring, to minimize integration risks and accelerate deployment. This approach enables rapid system activation while maintaining operational efficiency across diverse locations, particularly where data center capacity is expanded in phases. In this context, integrated solutions are preferred over individual components to support faster, standardized, repeatable, and scalable data center deployments.

Global Modular Data Center Market, By Solution

Prefabricated modules dominate this segment because they directly address the growing need for rapid deployment, standardization, and reduced on-site complexity. Globally, large-scale data center projects are often implemented within stringent timelines and under diverse environmental conditions, making prefabricated modules well suited for infrastructure that needs to be assembled, tested, and deployed within defined schedules. This approach helps minimize construction delays while ensuring consistent quality and performance across deployments. In addition, prefabrication enables standardized replication of infrastructure, which is particularly important for hyperscale cloud, edge computing, and large digital infrastructure projects requiring multiple data center facilities. As a result, prefabricated modules are increasingly preferred over conventional construction methods due to their ability to support faster, repeatable, scalable, and efficient data center development.

Global Modular Data Center Market, By Service

Support and maintenance services are growing steadily due to the increasing installed base of modular data centers operating in high-temperature and dust-prone environments. The system needs constant monitoring to maintain operational performance in its cooling systems, power infrastructure, and environmental assessment capabilities. The expansion of telecom networks, enterprise facilities, and cloud infrastructure requires organizations to increase their use of predictive maintenance, remote monitoring, and lifecycle management services. The current market trend shows a transition from deployment activities toward the development of operational efficiency and system reliability management.

Global Modular Data Center Market, By Form Factor

Support and maintenance services are expected to grow steadily due to the expanding installed base of modular data centers across diverse operating environments. These facilities require continuous monitoring and maintenance to ensure optimal performance of critical cooling systems, power infrastructure, environmental controls, and monitoring systems. The increasing deployment of modular data centers by telecom operators, cloud service providers, colocation providers, and enterprises is driving demand for predictive maintenance, remote monitoring, and lifecycle management services. As the installed base expands, market participants are increasingly shifting their focus from initial deployment toward maintaining operational efficiency, system availability, and long-term reliability. This transition is expected to support the growing adoption of support and maintenance services across the global modular data center market.

Global Modular Data Center Market, By Deployment Type

Outdoor modular data centers are gaining traction because they enable infrastructure deployment in locations where conventional data center construction may be challenging or impractical. Globally, the expansion of telecom infrastructure, industrial facilities, remote operations, and government digitalization initiatives is increasing the need for data center infrastructure across geographically distributed locations. The growing adoption of 5G networks, industrial IoT systems, and edge computing applications is further supporting demand for outdoor modular data centers, as these solutions can be deployed without requiring permanent building infrastructure. Their ability to support rapid deployment, flexible capacity expansion, and reliable operation across diverse and demanding environmental conditions makes outdoor modular data centers increasingly suitable for non-traditional and distributed deployment environments.

Global Modular Data Center Market, By Build Type

Semi-prefabricated modular data centers have a significant market share due to their balance in standardization and customization. Many projects in global are focused on expanding existing data centers or integrating with existing infrastructure in urban areas. The semi-prefabricated solution offers customization opportunities for various components, such as power and cooling, while still benefiting from prefabricated modules, which are manufactured in a factory environment. This provides opportunities for expansion while allowing for customization to suit specific needs, which is critical in data centers due to scalability needs.

Global Modular Data Center Market, By Data Center Size

Small modular data centers are witnessing increasing demand as organizations expand digital infrastructure beyond major urban centers into secondary cities, remote locations, and emerging markets. These solutions address localized data processing requirements associated with edge computing, IoT, 5G, and distributed cloud services, where low latency and proximity to end users are critical. Their compact footprint, rapid deployment capabilities, and ability to operate independently make small modular data centers well suited for geographically distributed digital infrastructure. In addition, the growing adoption of decentralized data processing models is encouraging organizations to deploy computing resources closer to end users, connected devices, and operational sites. This trend is expected to create further opportunities for small modular data centers across diverse applications and deployment environments globally.

Global Modular Data Center Market, By End User

Hyperscale operators represent the largest segment because they are driving substantial investments in cloud regions, AI infrastructure, and large-scale digital platforms across global markets. These operators require infrastructure that enables incremental capacity expansion while maintaining standardized architectures, high performance, and operational efficiency. Modular data centers address these requirements by offering faster deployment, flexible scalability, and standardized infrastructure compared with conventional data center construction. The continued growth of cloud computing across government, financial services, healthcare, manufacturing, and other industries is further driving hyperscale infrastructure investments. As hyperscale operators expand their global data center footprints to accommodate growing cloud and AI workloads, they are expected to remain a key contributor to demand for large-scale modular data center solutions.

REGION

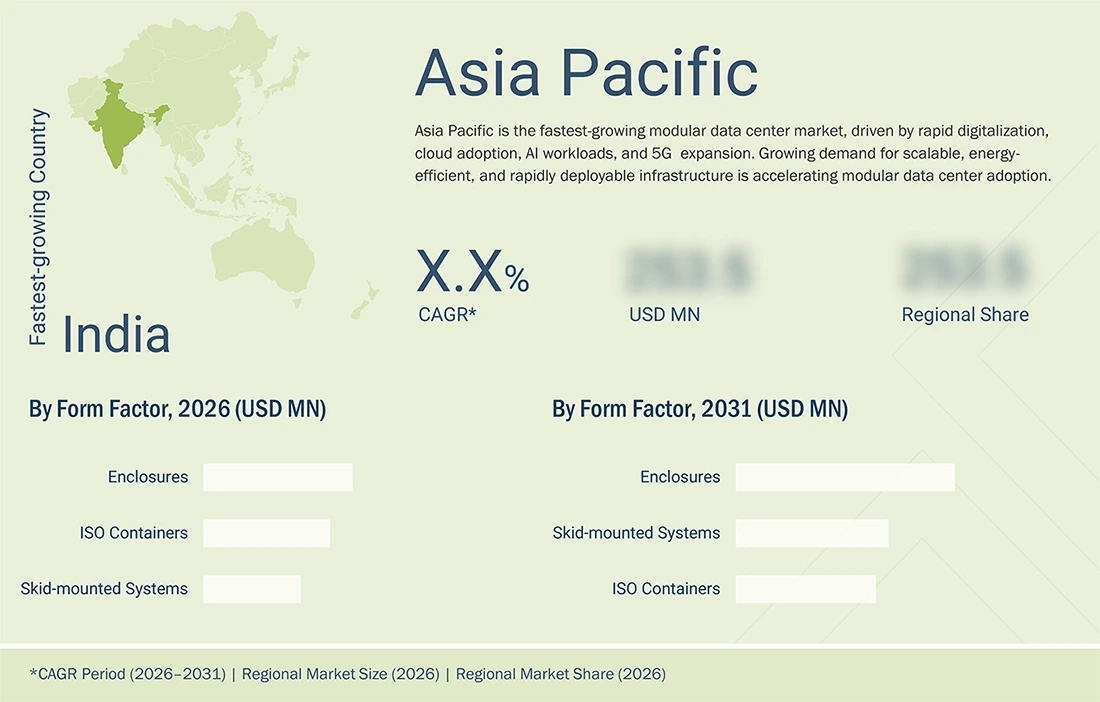
Asia Pacific to be the fastest growing region in the Modular Data Center Market during forecast period

The Asia Pacific modular data center market is expected to witness significant growth during the forecast period, driven by rapid digital transformation, increasing cloud adoption, rising internet penetration, and growing investments in data center infrastructure across countries such as China, India, Japan, Australia, Singapore, and Southeast Asian economies. The proliferation of AI, IoT, 5G, and edge computing applications is increasing demand for scalable and rapidly deployable computing infrastructure, particularly in locations where conventional data center development can involve longer construction timelines and higher costs. Hyperscale cloud service providers, colocation operators, telecom companies, and enterprises are increasingly adopting modular data centers to expand capacity in response to growing data generation and processing requirements. In addition, the development of digital economies, smart cities, and national cloud infrastructure is supporting investments in distributed and edge data center facilities. Growing emphasis on energy efficiency and sustainability is also encouraging the deployment of modular solutions incorporating advanced cooling, power management, and energy-efficient technologies. However, land availability, power constraints, regulatory requirements, and differences in infrastructure standards across countries may create challenges for market expansion. Overall, the region is expected to remain a key growth market for modular data center solutions.

modular-data-centers-market Region

MODULAR DATA CENTER MARKET: COMPANY EVALUATION MATRIX

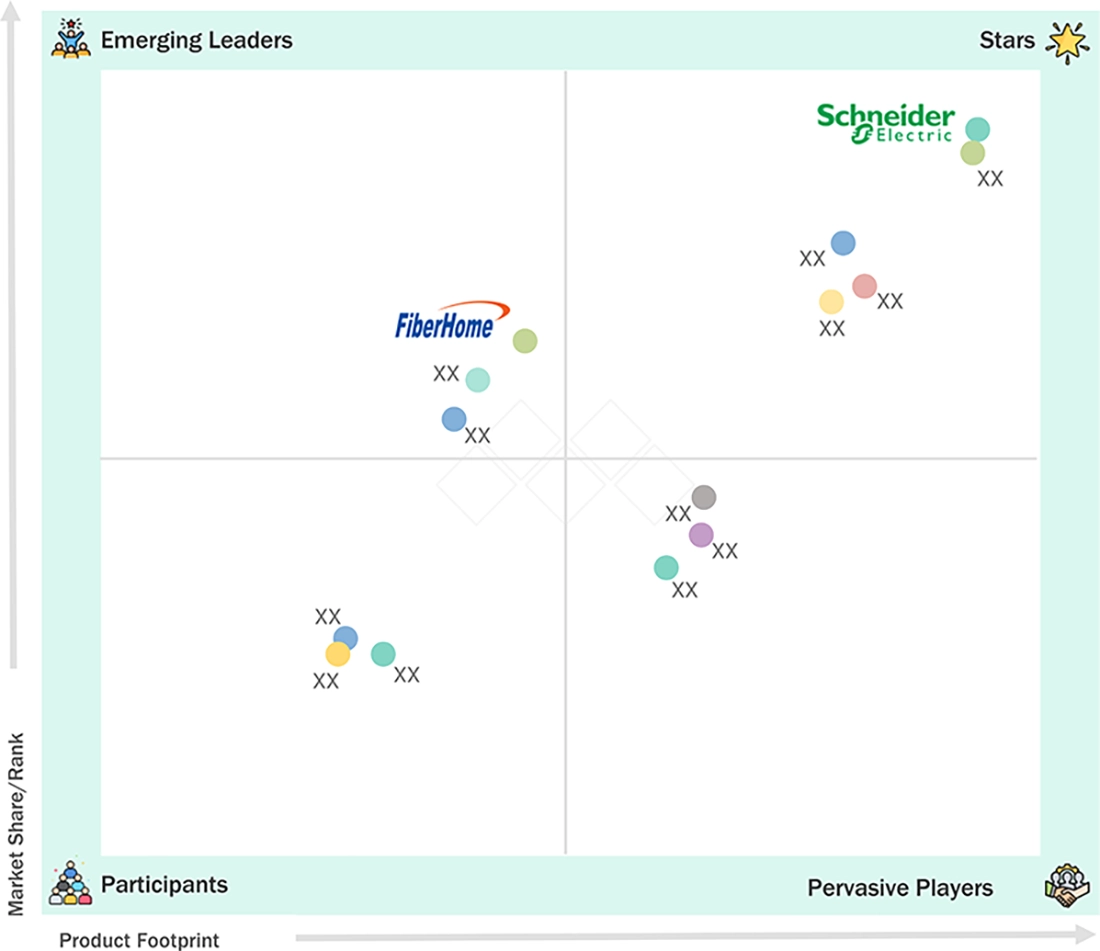
The competitive analysis in the modular data center market in Global includes both existing leaders and emerging leaders, based on the depth of their solutions and execution capabilities in the region. Schneider Electric is identified as a Star player due to its depth of prefabricated modular solutions and existing footprint in large-scale digital infrastructure projects in the region. The solutions based on EcoStruxure technology have a high potential to meet customer requirements in the hyperscale, enterprise, and government segments in the country. On the other hand, FiberHome is placed in the Emerging Leader position owing to its increasing footprint in the telecom and network infrastructure space and its potential to offer cost-effective and deployable modular solutions. The market is slowly transitioning to companies that can deliver on the promise of integrated infrastructure solutions, execution capabilities within the region, and adaptability to harsh environments. A clear differentiation is emerging between existing solution players and emerging players in the region.

modular-data-centers-market Evaluation Metrics

Source: Secondary Research, Interviews with Experts, MarketsandMarkets Analysis

KEY MARKET PLAYERS

MARKET SCOPE

REPORT METRIC DETAILS
Market Size, 2026 (Value) USD 41 Billion
Market Forecast, 2031 (Value) USD 93.6 Billion
CAGR 18.0%
Years Considered 2021–2031
Base Year 2025
Forecast Period 2026–2031
Units Considered Value (USD Million)
Report Coverage Revenue forecast, company ranking, competitive landscape, growth factors, and trends
Segments Covered
  • By Component:
    • Solutions
    • Services
  • By Solution:
    • All-in-one Solutions
    • Prefabricated Modules
  • By Service:
    • Design & Consulting
    • Integration & Deployment
    • Support & Maintenance
  • By Form Factor:
    • ISO Containers
    • Skid Mounted System
    • Enclosures
  • By Build Type:
    • Semi-prefabricated Data Center
    • Fully Prefabricated Data Center
    • All-In-One Data Center
  • By Data Center Size:
    • Small Data Center
    • Mid-sized Data Center
    • Large Data Center
  • By Deployment Type:
    • Indoor
    • Outdoor
  • By End User:
    • Telecom Service Provider
    • Cloud Service Provider
    • Enterprises
Regions North America, Europe, Asia Pacific, Middle East & Africa, and Latin America

WHAT IS IN IT FOR YOU: MODULAR DATA CENTER MARKET REPORT CONTENT GUIDE

modular-data-centers-market Content Guide

DELIVERED CUSTOMIZATIONS

We have successfully delivered the following deep-dive customizations:

CLIENT REQUEST CUSTOMIZATION DELIVERED VALUE ADDS
Competitive benchmarking of modular data center vendors globally
  • Global benchmarking of modular data center vendors across international deployment capability, prefabrication maturity, and multi-climate operational design
  • Evaluation of vendor expertise in high-density power management, liquid/hybrid cooling, and energy-efficient architectures
  • Benchmarking global manufacturing capacity, supply chain resilience, and partner ecosystems supporting hyperscale and edge deployments
  • Assessment of vendor compliance with international standards, regional data sovereignty regulations, and environmental sustainability mandates
  • Identify leading global and regional vendors
  • Improve vendor selection accuracy for large-scale international projects
  • Reduce vendor and deployment risk through region-specific performance metrics
  • Inform global sourcing strategies to align with enterprise expansion timelines
Market sizing across modular form factors, deployment models, and end-user segments globally
  • Global market sizing of containerized (ISO), skid-mounted, and fully prefabricated modular units tailored for diverse regional deployments
  • Revenue and unit forecasts across hyperscale cloud, telecom (5G/edge), enterprise, BFSI, government, and healthcare segments
  • Demand projection driven by global AI workload expansion, cloud repatriation, edge computing requirements, and ESG mandates
  • Geographical mapping of demand across North America, Europe, Asia-Pacific, Latin America, and MEA with sensitivity analysis for power costs and site availability
  • Prioritize high-growth market segments and geographies globally
  • Optimize capital allocation and capacity planning for regional market conditions
  • Support targeted go-to-market and sales coverage strategies aligned with global public and private sector demand drivers
Assessment of deployment services, systems integration, and O&M models for global modular deployments
  • Benchmarking vendor capabilities in modular engineering, global transport logistics, field integration, and rapid commissioning under varying international regulatory regimes
  • Evaluation of remote monitoring, predictive maintenance readiness, and multi-site operations adapted for varied environmental conditions
  • Comparison of service delivery models (global original equipment manufacturers vs. regional integrators) and alignment with local labor, cybersecurity, and operational compliance expectations
  • Analysis of energy-efficiency practices, renewable power integration potential, and lifecycle OPEX scenarios across key global regions
  • Strengthen selection of service and integration partners globally
  • Improve operational quality and compliance assessment
  • Enable differentiated service offerings (resilient O&M, green power options) that meet global commercial and public-sector requirements
  • Reduce total cost of ownership (TCO) and deployment timelines through tailored logistics and regional partner strategies

RECENT DEVELOPMENTS

  • April 2026 : Vertiv acquired BMarko Structures, a US-based provider of custom-engineered structural fabrication. The acquisition was aimed at strengthening Vertiv’s manufacturing and engineering capabilities and expanding its ability to deliver scalable, prefabricated, and converged infrastructure solutions. The move supports the growing demand for faster and more flexible data center deployment driven by AI workloads and enables Vertiv to improve capacity, customization, and execution for large-scale data center projects.
  • June 2026 : Schneider Electric and Hon Hai Technology Group (Foxconn) announced a strategic collaboration to accelerate the development and deployment of next-generation AI data centers. The partnership focuses on developing integrated, ready-to-deploy infrastructure by combining Foxconn’s AI rack integration and manufacturing capabilities with Schneider Electric’s expertise in power, cooling, and energy management. The companies also plan to explore modular power and cooling skids and standardized design frameworks, supporting faster, repeatable, and scalable AI data center deployments globally.


Table of Contents

checkmarkExclusive indicates content/data unique to MarketsandMarkets and not available with any competitors.

TITLE
PAGE NO
1
INTRODUCTION


37
2
EXECUTIVE SUMMARY


42
3
PREMIUM INSIGHTS


48
4
MARKET OVERVIEW AND INDUSTRY TRENDS
Cloud and mobility trends drive rapid, scalable data infrastructure growth, unlocking edge computing opportunities.


55
 
4.1
INTRODUCTION


4.2
MARKET DYNAMICS


4.2.1
DRIVERS


4.2.1.1
ACCELERATING ADOPTION OF CLOUD COMPUTING AND MOBILITY BENEFITS ENABLES ORGANIZATIONS TO ACHIEVE RAPID DEPLOYMENT AND SCALABLE INFRASTRUCTURE


4.2.1.2
EXPANDING CLOUD AND MOBILITY REQUIREMENTS DRIVE THE RAPID DEPLOYMENT OF SCALABLE AND FLEXIBLE DATA CENTER SOLUTIONS


4.2.1.3
INCREASING RELIANCE ON CLOUD SERVICES AND DISASTER RECOVERY CAPABILITIES EMPOWERS BUSINESSES TO DEPLOY INFRASTRUCTURE WITH UNPRECEDENTED SPEED


4.2.2
RESTRAINTS


4.2.2.1
HEAVY INITIAL CAPITAL EXPENDITURES ON MODULAR SOLUTIONS RESTRICT ORGANIZATIONS FROM ACHIEVING RAPID MARKET ADOPTION


4.2.3
OPPORTUNITIES


4.2.3.1
SURGING MARKET DEMAND FOR IOT, AI, AND 5G TECHNOLOGIES NECESSITATES ADVANCED DATA INFRASTRUCTURE, OPENING GROWTH AVENUES IN EDGE COMPUTING


4.2.3.2
EXPANDING DEPLOYMENT OF EDGE COMPUTING DRIVEN BY IOT AND AI TRENDS CREATES LUCRATIVE OPPORTUNITIES FOR SPECIALIZED MODULAR INFRASTRUCTURE


4.2.4
CHALLENGES


4.2.4.1
ENCOUNTERING COMPLEX MAINTENANCE REQUIREMENTS AND RIGID CUSTOMIZATION LIMITS HAMPERS THE SEAMLESS SCALING OF LARGE DATA CENTER PROJECTS


4.2.4.2
MANAGING INTRICATE MAINTENANCE PROCEDURES AND RESTRICTED CUSTOMIZATION OPTIONS OBSTRUCTS THE SMOOTH EXPANSION OF MAJOR DATA CENTER INITIATIVES


4.3
UNMET NEEDS AND WHITE SPACES


4.3.1
UNMET NEEDS IN MODULAR DATA CENTER MARKET


4.3.2
WHITE SPACE OPPORTUNITIES


4.4
INTERCONNECTED MARKETS AND CROSS-SECTOR OPPORTUNITIES


4.4.1
CROSS-SECTOR OPPORTUNITIES


4.5
STRATEGIC MOVES BY TIER-1/2/3 PLAYERS


4.6
PORTER’S FIVE FORCES ANALYSIS


4.6.1
THREAT OF NEW ENTRANTS


4.6.2
THREAT OF SUBSTITUTES


4.6.3
BARGAINING POWER OF BUYERS


4.6.4
BARGAINING POWER OF SUPPLIERS


4.6.5
INTENSITY OF COMPETITIVE RIVALRY


4.7
MACROECONOMIC INDICATORS


4.7.1
INTRODUCTION


4.7.2
GDP TRENDS & FORECASTS


4.7.3
TRENDS IN GLOBAL DATA CENTER SOLUTIONS INDUSTRY


4.7.4
TRENDS IN MODULAR DATA CENTER UPS MARKET


4.8
SUPPLY CHAIN ANALYSIS


4.9
ECOSYSTEM ANALYSIS


4.10
PRICING ANALYSIS


4.10.1
AVERAGE SELLING PRICE TREND OF KEY PLAYERS, BY SOLUTION


4.10.2
AVERAGE SELLING PRICE TREND, BY REGION


4.11
KEY CONFERENCES AND EVENTS, 2026–2027


4.12
TRENDS/DISRUPTIONS IMPACTING CUSTOMER BUSINESS


4.13
INVESTMENT AND FUNDING SCENARIO


4.14
CASE STUDY ANALYSIS


4.14.1
T-SYSTEMS AND VERTIV: RAPID DEPLOYMENT OF MODULAR DATA CENTER IN BARCELONA


4.14.2
LUZHOU GOVERNMENT PARTNERED WITH HUAWEI TO BUILD EFFICIENT MODULAR DATA CENTER FOR SMART CITY DEVELOPMENT


4.14.3
BASILICA DE LA SAGRADA FAMILIA PARTNERED WITH SCHNEIDER ELECTRIC FOR STATE-OF-THE-ART MOBILE DATA CENTER


4.14.4
MEEZA COLLABORATED WITH VERTIV TO RAPIDLY SCALE MODULAR DATA CENTERS


4.14.5
ANIMAL LOGIC PARTNERED WITH SCHNEIDER ELECTRIC TO DEPLOY SCALABLE, HIGH-PERFORMANCE PREFABRICATED MODULAR DATA CENTER


4.14.6
KEY TARIFF RATES


4.14.7
PRICE IMPACT ANALYSIS


4.14.8
IMPACT ON COUNTRIES/REGIONS


4.14.8.1
US


4.14.8.2
EUROPE


4.14.8.3
ASIA PACIFIC


4.14.9
IMPACT ON VERTICALS


4.14.9.1
BFSI


4.14.9.2
CLOUD SERVICES PROVIDERS & HYPERSCALERS


4.14.9.3
MANUFACTURING


4.14.9.4
GOVERNMENT & PUBLIC SECTOR


4.15
TECHNOLOGY ANALYSIS


4.15.1
KEY TECHNOLOGIES


4.15.1.1
MODULAR DESIGN


4.15.1.2
POWER DISTRIBUTION UNITS (PDUS)


4.15.1.3
DATA CENTER INFRASTRUCTURE MANAGEMENT (DCIM) SOFTWARE


4.15.1.4
COOLING SYSTEMS


4.15.2
COMPLEMENTARY TECHNOLOGIES


4.15.2.1
VIRTUALIZATION


4.15.2.2
SOFTWARE-DEFINED NETWORKING


4.15.2.3
STORAGE AREA NETWORKS


4.15.2.4
ADVANCED BATTERY STORAGE


4.15.3
ADJACENT TECHNOLOGIES


4.15.3.1
EDGE COMPUTING


4.15.3.2
ARTIFICIAL INTELLIGENCE & MACHINE LEARNING


4.15.3.3
DIGITAL TWINS


4.15.3.4
AUGMENTED REALITY


4.16
TRADE ANALYSIS


4.17
TECHNOLOGY/PRODUCT ROADMAP


4.17.1
SHORT-TERM (2026–2028) | PREFABRICATION, RAPID DEPLOYMENT & AI-READY INFRASTRUCTURE


4.17.2
MID-TERM (2028–2031) | HIGH-DENSITY, ENERGY-INTEGRATED & INTELLIGENT MODULAR DATA CENTERS


4.17.3
LONG-TERM (2031–2036+) | AUTONOMOUS, SUSTAINABLE & ADAPTIVE MODULAR DATA CENTERS


4.18
PATENT ANALYSIS


4.19
FUTURE APPLICATIONS


4.19.1
AI-DRIVEN MODULAR DATA CENTER DESIGN & CAPACITY PLANNING


4.19.2
AUTONOMOUS DEPLOYMENT & WORKLOAD OPTIMIZATION


4.19.3
INTELLIGENT POWER & COOLING MANAGEMENT


4.19.4
AI-ENABLED REMOTE MONITORING & PREDICTIVE MAINTENANCE


4.19.5
ENERGY-EFFICIENT & SUSTAINABLE MODULAR DATA CENTER OPERATIONS


4.20
IMPACT OF AI/GENERATIVE AI ON MODULAR DATA CENTER MARKET


4.20.1
TOP USE CASES AND MARKET POTENTIAL


4.20.2
BEST PRACTICES IN MODULAR DATA CENTER MARKET


4.20.3
CASE STUDY OF AI IMPLEMENTATION IN MODULAR DATA CENTER MARKET


4.20.3.1
LEADING RETAILER ENHANCED DISTRIBUTION EFFICIENCY WITH AI-DRIVEN VERTIV’S SMARTROW SOLUTION


4.20.4
TOP VENDORS ADOPTING AI/GEN AI


4.20.4.1
VERTIV


4.20.4.2
ALIBABA CLOUD


4.21
APPLICATIONS OF MODULAR DATA CENTER


4.21.1
CAPACITY EXPANSION


4.21.2
DATA CENTER EXPANSION


4.21.3
DISASTER RECOVERY


4.21.4
EMERGENCY & TEMPORARY DEPLOYMENT


4.21.5
EDGE COMPUTING


4.21.6
INTERCONNECTED ADJACENT ECOSYSTEM AND IMPACT ON MARKET PLAYERS


4.21.7
CLIENT READINESS TO ADOPT GENERATIVE AI IN MODULAR DATA CENTER MARKET


4.22
REGULATORY LANDSCAPE


4.22.1
REGULATORY BODIES, GOVERNMENT AGENCIES, AND OTHER ORGANIZATIONS


4.22.2
REGULATIONS, BY REGION


4.23
DECISION-MAKING PROCESS


4.24
KEY STAKEHOLDERS AND BUYING CRITERIA


4.24.1
KEY STAKEHOLDERS IN BUYING PROCESS


4.24.2
BUYING CRITERIA


4.25
ADOPTION BARRIERS AND INTERNAL CHALLENGES


4.26
UNMET NEEDS IN VARIOUS END-USER INDUSTRIES


4.27
MARKET PROFITABILITY


4.27.1
REVENUE POTENTIAL


4.27.2
COST DYNAMICS


4.27.3
MARGIN OPPORTUNITIES IN KEY APPLICATIONS


4.28
BUSINESS MODEL ANALYSIS


4.28.1
PRODUCT OFFERING


4.28.2
REVENUE STREAMS


4.28.3
REVENUE MODEL TRENDS


4.28.4
CHANNELS


4.28.5
CUSTOMER SEGMENTS


4.29
APPLICATIONS OF MODULAR DATA CENTER


4.29.1
CAPACITY EXPANSION


4.29.2
DATA CENTER EXPANSION


4.29.3
DISASTER RECOVERY


4.29.4
EMERGENCY & TEMPORARY DEPLOYMENT


4.29.5
EDGE COMPUTING


5
MODULAR DATA CENTER MARKET, BY COMPONENT
Market Size & Growth Rate Forecast Analysis to 2031 in USD Million | 28 Data Tables


114
 
5.1
INTRODUCTION


5.1.1
COMPONENT: MODULAR DATA CENTER MARKET DRIVERS


5.2
SOLUTIONS


5.2.1
ALL-IN-ONE SOLUTIONS


5.2.1.1
RISING EDGE-COMPUTING DEMAND TO FUEL ADOPTION


5.2.2
PREFABRICATED MODULES


5.2.2.1
RAPID SCALABILITY TO DRIVE ADOPTION OF PREFABRICATED MODULES


5.2.2.2
PREFABRICATED IT MODULES


5.2.2.2.1
OPTIMIZED IT INFRASTRUCTURE FOR RAPID DEPLOYMENT TO PROPEL MARKET


5.2.2.2.2
SERVERS


5.2.2.2.3
NETWORKS


5.2.2.2.4
STORAGE


5.2.2.2.5
OTHERS


5.2.2.3
PREFABRICATED POWER MODULES


5.2.2.3.1
IMPROVED POWER DISTRIBUTION FOR CRITICAL LOADS TO DRIVE MARKET


5.2.2.3.2
POWER DISTRIBUTION UNITS


5.2.2.3.3
SWITCHGEAR


5.2.2.3.4
UNINTERRUPTIBLE POWER SUPPLIES


5.2.2.3.5
GENERATORS


5.2.2.3.6
OTHERS


5.2.2.4
PREFABRICATED COOLING MODULES


5.2.2.4.1
ENHANCED ENERGY EFFICIENCY TO DRIVE ADOPTION IN MODULAR DATA CENTERS


5.2.2.4.2
CHILLER MODULES


5.2.2.4.3
AIR HANDLING UNITS


5.2.2.4.4
DIRECT EXPANSION COOLING


5.2.2.4.5
OTHERS
 
 
5.3
SERVICES


5.3.1
DESIGN & CONSULTING


5.3.1.1
GROWING DEMAND FOR END-TO-END SOLUTIONS TO DRIVE MARKET


5.3.2
INTEGRATION & DEPLOYMENT


5.3.2.1
INTEGRATION AND DEPLOYMENT SERVICES TO STREAMLINE SETUP AND OPERATION OF PREFABRICATED DATA CENTERS


5.3.3
SUPPORT & MAINTENANCE


5.3.3.1
SUPPORT AND MAINTENANCE SERVICES TO ENSURE OPTIMAL PERFORMANCE, RELIABILITY, AND LONGEVITY OF INFRASTRUCTURE


6
MODULAR DATA CENTER MARKET, BY FORM FACTOR
Market Size & Growth Rate Forecast Analysis to 2031 in USD Million | 28 Data Tables


134
 
6.1
INTRODUCTION


6.1.1
FORM FACTOR: MODULAR DATA CENTER MARKET DRIVERS


6.2
ISO CONTAINERS


6.2.1
20-FEET CONTAINERS


6.2.1.1
20-FEET CONTAINERS TO PROVIDE FLEXIBLE, SMALL-SCALE MODULAR SOLUTIONS FOR RAPID IT CAPACITY EXPANSION


6.2.2
40-FEET CONTAINERS


6.2.2.1
40-FEET CONTAINERS TO OFFER HIGH-DENSITY COMPUTING AND STORAGE CAPACITY FOR LARGE-SCALE DATA CENTERS


6.3
SKID-MOUNTED SYSTEMS


6.3.1
FIXED SKID-MOUNTED SYSTEMS


6.3.1.1
COST-EFFECTIVE MODULAR DEPLOYMENT FOR LONG-TERM SCALABILITY TO DRIVE MARKET


6.3.2
PORTABLE SKID-MOUNTED SYSTEMS


6.3.2.1
PORTABLE SKID-MOUNTED SYSTEMS TO OFFER RAPIDLY DEPLOYABLE SOLUTIONS FOR TEMPORARY OR REMOTE DATA CENTER APPLICATIONS


6.4
ENCLOSURES


6.4.1
LOW-DENSITY ENCLOSURES


6.4.1.1
LOW-DENSITY ENCLOSURES TO SUIT ENVIRONMENTS WHERE EQUIPMENT DENSITY STAYS LOW PRIORITY


6.4.2
MEDIUM-DENSITY ENCLOSURES


6.4.2.1
MEDIUM-DENSITY ENCLOSURES TO PROVIDE BALANCED PERFORMANCE FOR SCALABLE GROWTH IN MID-RANGE APPLICATIONS


6.4.3
HIGH-DENSITY ENCLOSURES


6.4.3.1
HIGH-DENSITY ENCLOSURES TO OFFER ADVANCED INFRASTRUCTURE FOR HIGH-DENSITY COMPUTING AND STORAGE DEMANDS


7
MODULAR DATA CENTER MARKET, BY BUILD TYPE
Market Size & Growth Rate Forecast Analysis to 2031 in USD Million | 8 Data Tables


150
 
7.1
INTRODUCTION


7.1.1
BUILD TYPE: MODULAR DATA CENTER MARKET DRIVERS


7.2
SEMI PREFABRICATED DATA CENTERS


7.2.1
FLEXIBILITY AND ENERGY EFFICIENCY TO DRIVE DEMAND FOR SEMI-PREFABRICATED DATA CENTERS IN VARIOUS INDUSTRIES


7.3
FULLY PREFABRICATED DATA CENTERS


7.3.1
RAPID DEPLOYMENT AND SCALABILITY TO FUEL MARKET GROWTH


7.4
ALL-IN-ONE DATA CENTERS


7.4.1
ALL-IN-ONE DATA CENTERS TO MEET DIVERSE NEEDS OF BUSINESSES


8
MODULAR DATA CENTER MARKET, BY DATA CENTER SIZE
Market Size & Growth Rate Forecast Analysis to 2031 in USD Million | 8 Data Tables


156
 
8.1
INTRODUCTION


8.1.1
DATA CENTER SIZE: MODULAR DATA CENTER MARKET DRIVERS


8.2
SMALL DATA CENTERS


8.2.1
LOCALIZED COMPUTING NEEDS TO DRIVE GROWTH


8.3
MID-SIZED DATA CENTERS


8.3.1
MID-SIZED DATA CENTERS TO ACCOMMODATE INCREASING DEMAND FOR PROCESSING POWER AND STORAGE


8.4
LARGE DATA CENTERS


8.4.1
LARGE DATA CENTERS TO HANDLE SIGNIFICANT WORKLOADS AND HIGH-DENSITY COMPUTING REQUIREMENTS


9
MODULAR DATA CENTER MARKET, BY DEPLOYMENT TYPE
Market Size & Growth Rate Forecast Analysis to 2031 in USD Million | 6 Data Tables


162
 
9.1
INTRODUCTION


9.1.1
DATA CENTER SIZE: MODULAR DATA CENTER MARKET DRIVERS


9.2
INDOOR


9.2.1
INDOOR DEPLOYMENT TO HELP ORGANIZATIONS MAXIMIZE EXISTING SPACE


9.3
OUTDOOR


9.3.1
RAPID SCALABILITY AND LOCATION FLEXIBILITY TO DRIVE GROWTH


10
MODULAR DATA CENTER MARKET, BY END USER
Market Size & Growth Rate Forecast Analysis to 2031 in USD Million | 26 Data Tables


166
 
10.1
INTRODUCTION


10.1.1
END USER: MODULAR DATA CENTER MARKET DRIVERS


10.2
TELCOM SERVICE PROVIDERS


10.2.1
RAPID SCALABILITY AND FLEXIBILITY TO PROPEL ADOPTION OF MODULAR DATA CENTERS


10.3
CLOUD SERVICE PROVIDERS


10.3.1
SCALABILITY AND FLEXIBILITY TO DRIVE ADOPTION OF MODULAR DATA CENTERS


10.4
ENTERPRISES


10.4.1
GROWING DATA DEMAND TO DRIVE MARKET


10.4.2
BFSI


10.4.2.1
GROWING DIGITAL ECONOMY TO DRIVE ADOPTION


10.4.2.2
BFSI: USE CASES


10.4.2.2.1
DISASTER RECOVERY & BUSINESS CONTINUITY


10.4.2.2.2
SCALABLE DATA PROCESSING


10.4.2.2.3
COMPLIANCE & SECURITY


10.4.2.2.4
OTHERS


10.4.3
IT & TELECOM


10.4.3.1
ACCELERATING DIGITAL TRANSFORMATION TO DRIVE MARKET


10.4.3.2
IT & TELECOM: USE CASES


10.4.3.2.1
EDGE COMPUTING


10.4.3.2.2
DISASTER RECOVERY


10.4.3.2.3
DATA CENTER EXPANSION


10.4.3.2.4
OTHERS


10.4.4
GOVERNMENT & DEFENSE


10.4.4.1
RISING NATIONAL SECURITY DEMAND TO DRIVE GROWTH


10.4.4.2
GOVERNMENT & DEFENSE: USE CASES


10.4.4.2.1
TACTICAL DATA CENTERS


10.4.4.2.2
DISASTER RECOVERY & CONTINUITY OF OPERATIONS


10.4.4.2.3
SECURE & CLASSIFIED INFORMATION PROCESSING & STORAGE


10.4.4.2.4
OTHERS


10.4.5
HEALTHCARE & LIFE SCIENCES


10.4.5.1
GROWING DIGITAL HEALTH DEMAND TO FUEL ADOPTION


10.4.5.2
HEALTHCARE & LIFE SCIENCES: USE CASES


10.4.5.2.1
HEALTH INFORMATION MANAGEMENT


10.4.5.2.2
TELEMEDICINE & REMOTE HEALTH SERVICES


10.4.5.2.3
OTHERS


10.4.6
RETAIL & E-COMMERCE


10.4.6.1
SURGE IN ONLINE SHOPPING TO DRIVE RETAIL ADOPTION FOR EFFICIENCY


10.4.6.2
RETAIL & E-COMMERCE: USE CASES


10.4.6.2.1
E-COMMERCE & ONLINE RETAIL PLATFORMS


10.4.6.2.2
POINT-OF-SALE SYSTEMS


10.4.6.2.3
INVENTORY MANAGEMENT


10.4.6.2.4
OTHERS


10.4.7
MEDIA & ENTERTAINMENT


10.4.7.1
ENHANCED CONTENT DELIVERY AND USER EXPERIENCE TO SUPPORT MARKET GROWTH


10.4.7.2
MEDIA & ENTERTAINMENT: USE CASES


10.4.7.2.1
CONTENT DELIVERY NETWORKS


10.4.7.2.2
POST-PRODUCTION & VIDEO EDITING


10.4.7.2.3
BROADCASTING & LIVE STREAMING


10.4.7.2.4
OTHERS


10.4.8
MANUFACTURING


10.4.8.1
OPERATIONAL EFFICIENCY AND DIGITAL TRANSFORMATION TO DRIVE ADOPTION


10.4.8.2
MANUFACTURING: USE CASES


10.4.8.2.1
MANUFACTURING PROCESS CONTROL


10.4.8.2.2
SUPPLY CHAIN MANAGEMENT


10.4.8.2.3
QUALITY CONTROL & TESTING


10.4.8.2.4
OTHERS


10.4.9
OTHER VERTICALS


11
MODULAR DATA CENTER MARKET, BY REGION
Comprehensive coverage of 8 Regions with country-level deep-dive of 15 Countries | 178 Data Tables.


190
 
11.1
INTRODUCTION


11.2
NORTH AMERICA


11.2.1
NORTH AMERICA: MODULAR DATA CENTER MARKET DRIVERS


11.2.2
NORTH AMERICA: MACROECONOMIC OUTLOOK


11.2.3
US


11.2.3.1
TECHNOLOGICAL ADVANCEMENTS AND LARGE-SCALE INVESTMENTS TO PROPEL MARKET GROWTH


11.2.4
CANADA


11.2.4.1
TAX INCENTIVES AND INFRASTRUCTURE INVESTMENTS TO SPUR MARKET GROWTH


11.3
EUROPE


11.3.1
EUROPE: MODULAR DATA CENTER MARKET DRIVERS


11.3.2
EUROPE: MACROECONOMIC OUTLOOK


11.3.3
UK


11.3.3.1
INVESTMENTS BY CLOUD VENDORS AND HYPERSCALERS TO BOOST MARKET GROWTH


11.3.4
GERMANY


11.3.4.1
ENERGY EFFICIENCY AND HEAVY INVESTMENT TO POWER MARKET GROWTH


11.3.5
FRANCE


11.3.5.1
GOVERNMENT INCENTIVES AND SUSTAINABILITY INITIATIVES TO SUPPORT MARKET GROWTH


11.3.6
ITALY


11.3.6.1
SURGE IN INVESTMENTS AND PARTNERSHIPS TO GALVANIZE GROWTH


11.3.7
REST OF EUROPE


11.4
ASIA PACIFIC


11.4.1
ASIA PACIFIC: MODULAR DATA CENTER MARKET DRIVERS


11.4.2
ASIA PACIFIC: MACROECONOMIC OUTLOOK


11.4.3
CHINA


11.4.3.1
SURGING AI DEMAND AND GOVERNMENT INVESTMENTS TO IGNITE MARKET GROWTH


11.4.4
JAPAN


11.4.4.1
RISING AI DEMAND AND MAJOR INVESTMENTS TO DRIVE MARKET


11.4.5
AUSTRALIA & NEW ZEALAND


11.4.5.1
GROWING DATA DEMAND AND INNOVATION INCENTIVES TO ACCELERATE EXPANSION AND SUSTAINABILITY


11.4.6
REST OF ASIA PACIFIC


11.5
MIDDLE EAST & AFRICA


11.5.1
MIDDLE EAST & AFRICA: MODULAR DATA CENTER MARKET DRIVERS


11.5.2
MIDDLE EAST & AFRICA: MACROECONOMIC OUTLOOK


11.5.3
GULF COOPERATION COUNCIL (GCC) COUNTRIES


11.5.3.1
KINGDOM OF SAUDI ARABIA (KSA)


11.5.3.1.1
DIGITAL TRANSFORMATION AND INVESTMENT INCENTIVES TO PROPEL MARKET


11.5.3.2
UAE


11.5.3.2.1
SUBSTANTIAL INVESTMENTS IN ADVANCED TECHNOLOGIES TO DRIVE MARKET


11.5.3.3
REST OF GCC COUNTRIES


11.5.4
SOUTH AFRICA


11.5.4.1
RISING CLOUD DEMAND AND ENERGY RESILIENCE TO STRENGTHEN GROWTH AND INNOVATION


11.5.5
REST OF MIDDLE EAST & AFRICA


11.6
LATIN AMERICA


11.6.1
LATIN AMERICA: MODULAR DATA CENTER MARKET DRIVERS


11.6.2
LATIN AMERICA: MACROECONOMIC OUTLOOK


11.6.3
BRAZIL


11.6.3.1
GROWING INDUSTRY DEMAND AND INVESTMENTS TO FUEL MARKET GROWTH


11.6.4
MEXICO


11.6.4.1
RISING CLOUD DEMAND AND INVESTMENTS TO CATALYZE GROWTH AND INNOVATION


11.6.5
REST OF LATIN AMERICA


12
COMPETITIVE LANDSCAPE
Decipher market dominance through strategic insights and competitive positioning of industry leaders and innovators.


253
 
12.1
INTRODUCTION


12.2
STRATEGIES ADOPTED BY KEY PLAYERS/RIGHT TO WIN


12.3
MARKET SHARE ANALYSIS


12.4
VENDOR PRODUCT/BRAND COMPARISON


12.4.1
DELL TECHNOLOGIES - EMC MDC


12.4.2
SCHNEIDER ELECTRIC - ECOSTRUXURE


12.4.3
VERTIV - MEGAMOD


12.4.4
HUAWEI – FUSIONMODULE2000


12.4.5
EATON - SMARTRACK


12.5
REVENUE ANALYSIS


12.6
COMPANY EVALUATION MATRIX: KEY PLAYERS, 2025


12.6.1
STARS


12.6.2
EMERGING LEADERS


12.6.3
PERVASIVE PLAYERS


12.6.4
PARTICIPANTS


12.6.5
COMPANY FOOTPRINT: KEY PLAYERS, 2025


12.6.5.1
COMPANY FOOTPRINT


12.6.5.2
REGION FOOTPRINT


12.6.5.3
COMPONENT FOOTPRINT


12.6.5.4
END-USER FOOTPRINT


12.7
COMPANY EVALUATION MATRIX: STARTUPS/SMES, 2025


12.7.1
PROGRESSIVE COMPANIES


12.7.2
RESPONSIVE COMPANIES


12.7.3
DYNAMIC COMPANIES


12.7.4
STARTING BLOCKS


12.7.5
COMPETITIVE BENCHMARKING: STARTUPS/SMES, 2025


12.7.5.1
DETAILED LIST OF KEY STARTUPS/SMES


12.7.5.2
COMPETITIVE BENCHMARKING OF STARTUPS/SMES


12.8
COMPANY VALUATION AND FINANCIAL METRICS OF KEY VENDORS


12.8.1
COMPANY VALUATION


12.8.2
FINANCIAL METRICS


12.9
COMPETITIVE SCENARIO


12.9.1
PRODUCT LAUNCHES


12.9.2
DEALS


13
COMPANY PROFILES
In-depth Company Profiles of Leading Market Players with detailed Business Overview, Product and Service Portfolio, Recent Developments, and Unique Analyst Perspective (MnM View)


290
 
13.1
INTRODUCTION


13.2
KEY PLAYERS


13.2.1
DELL


13.2.1.1
BUSINESS OVERVIEW


13.2.1.2
PRODUCTS/SOLUTIONS/SERVICES OFFERED


13.2.1.3
RECENT DEVELOPMENTS


13.2.1.3.1
PRODUCT LAUNCHES


13.2.1.3.2
DEALS


13.2.1.4
MNM VIEW


13.2.1.4.1
KEY STRENGTHS


13.2.1.4.2
STRATEGIC CHOICES


13.2.1.4.3
WEAKNESSES AND COMPETITIVE THREATS


13.2.2
VERTIV


13.2.3
SCHNEIDER ELECTRIC


13.2.4
HUAWEI


13.2.5
EATON


13.2.6
RITTAL


13.2.7
JOHNSON CONTROLS


13.2.8
ABB


13.2.9
DELTA ELECTRONICS


13.2.10
STULZ


13.2.11
HUBBELL (PCX)


13.3
OTHER PLAYERS


13.3.1
IE CORP.


13.3.2
CANNON TECHNOLOGIES


13.3.3
EDGE MCS


13.3.4
ASPERITAS


13.3.5
RETEX


13.3.6
BOX MODUL


13.3.7
BLADEROOM


13.3.8
WESCO INTERNATIONAL, INC.


13.3.9
FIBERHOME


13.3.10
SCALEMATRIX


13.3.11
EQUINIX


13.3.12
365 DATA CENTERS


13.3.13
CUPERTINO ELECTRIC (QUANTA SERVICES)


13.3.14
K-STAR


13.3.15
IEM


13.3.16
MODULAR POWER SOLUTIONS


13.3.17
FAITH TECHNOLOGIES INCORPORATED (FTI)


13.3.18
M.C. DEAN


13.3.19
DATA SPECIALTIES INC.


13.3.20
TOTAL SITE SOLUTIONS


13.3.21
ENVIRONMENTAL AIR SYSTEMS


13.3.22
TAS


13.3.23
AWS


13.3.24
META


13.3.25
ORACLE


13.3.26
MICROSOFT


13.3.27
APPLE


13.3.28
INTEL


13.3.29
NVIDIA


13.3.30
IBM


13.3.31
SIEMENS


13.3.32
HPE


14
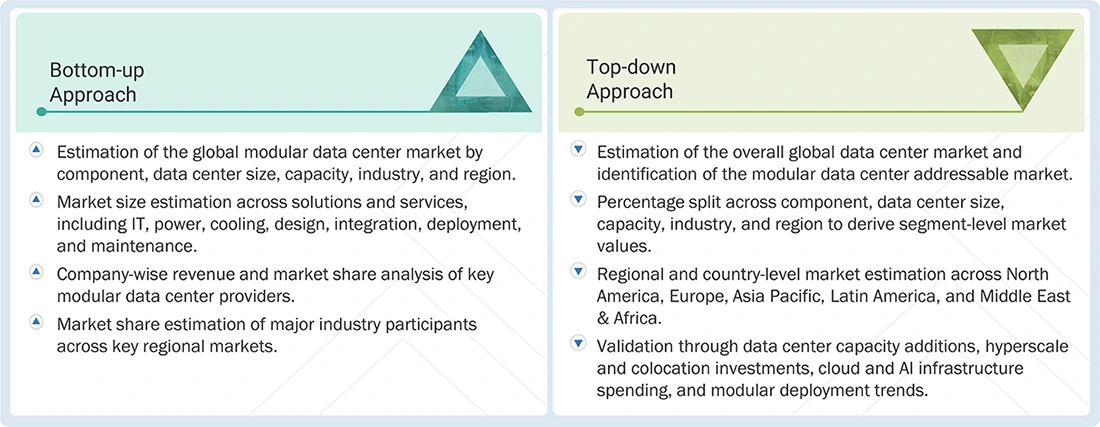
RESEARCH METHODOLOGY


383
 
14.1
RESEARCH APPROACH


14.1.1
SECONDARY DATA


14.1.2
PRIMARY DATA


14.1.2.1
BREAKUP OF PRIMARY PROFILES


14.1.2.2
KEY INDUSTRY INSIGHTS


14.2
DATA TRIANGULATION


14.3
MARKET SIZE ESTIMATION


14.4
MARKET FORECAST


14.5
RESEARCH ASSUMPTIONS


14.6
RESEARCH LIMITATIONS


15
APPENDIX


395
 
15.1
DISCUSSION GUIDE


15.2
KNOWLEDGESTORE: MARKETSANDMARKETS’ SUBSCRIPTION PORTAL


15.3
CUSTOMIZATION OPTIONS


15.4
RELATED REPORTS


15.5
AUTHOR DETAILS


LIST OF TABLES


TABLE 1
USD EXCHANGE RATES, 2020–2025


TABLE 2
INTERCONNECTED MARKETS


TABLE 3
KEY MOVES AND STRATEGIC FOCUS


TABLE 4
MODULAR DATA CENTER MARKET: PORTER’S FIVE FORCES ANALYSIS


TABLE 5
GDP PERCENTAGE CHANGE, BY KEY COUNTY, 2021–2029


TABLE 6
INDICATIVE PRICING ANALYSIS OF MODULAR UPS SOLUTIONS


TABLE 7
AVERAGE SELLING PRICE TREND, BY REGION


TABLE 8
MODULAR DATA CENTER MARKET: LIST OF KEY CONFERENCES AND EVENTS, 2026–2027


TABLE 9
US ADJUSTED RECIPROCAL TARIFF RATES


TABLE 10
LIST OF GRANTED PATENTS IN MODULAR DATA CENTER


TABLE 11
TOP USE CASES AND MARKET POTENTIAL


TABLE 12
BEST PRACTICES: COMPANIES IMPLEMENTING AI IN MODULAR DATA CENTERS


TABLE 13
INTERCONNECTED ADJACENT ECOSYSTEMS AND IMPLICATIONS FOR MARKET PLAYERS


TABLE 14
NORTH AMERICA: LIST OF REGULATORY BODIES, GOVERNMENT AGENCIES, AND OTHER ORGANIZATIONS


TABLE 15
EUROPE: LIST OF REGULATORY BODIES, GOVERNMENT AGENCIES, AND OTHER ORGANIZATIONS


TABLE 16
ASIA PACIFIC: LIST OF REGULATORY BODIES, GOVERNMENT AGENCIES, AND OTHER ORGANIZATIONS


TABLE 17
REST OF THE WORLD: LIST OF REGULATORY BODIES, GOVERNMENT AGENCIES, AND OTHER ORGANIZATIONS


TABLE 18
REGULATIONS, BY REGION


TABLE 19
INFLUENCE OF STAKEHOLDERS ON BUYING PROCESS FOR END USERS


TABLE 20
KEY BUYING CRITERIA FOR END USERS


TABLE 21
MODULAR DATA CENTER MARKET: UNMET NEEDS IN KEY END-USER INDUSTRIES


TABLE 22
MODULAR DATA CENTER MARKET, BY COMPONENT, 2021–2025 (USD MILLION)


TABLE 23
MODULAR DATA CENTER MARKET, BY COMPONENT, 2026–2031 (USD MILLION)


TABLE 24
MODULAR DATA CENTER SOLUTIONS MARKET, BY TYPE, 2021–2025 (USD MILLION)


TABLE 25
MODULAR DATA CENTER SOLUTIONS MARKET, BY TYPE, 2026–2031 (USD MILLION)


TABLE 26
MODULAR DATA CENTER SOLUTIONS MARKET, BY REGION, 2021–2025 (USD MILLION)


TABLE 27
MODULAR DATA CENTER SOLUTIONS MARKET, BY REGION, 2026–2031 (USD MILLION)


TABLE 28
MODULAR DATA CENTER MARKET FOR ALL-IN-ONE MODULES, BY REGION, 2021–2025 (USD MILLION)


TABLE 29
MODULAR DATA CENTER MARKET FOR ALL-IN-ONE MODULES, BY REGION, 2026–2031 (USD MILLION)


TABLE 30
MODULAR DATA CENTER MARKET FOR PREFABRICATED MODULES, BY TYPE, 2021–2025 (USD MILLION)


TABLE 31
MODULAR DATA CENTER MARKET FOR PREFABRICATED MODULES, BY TYPE, 2026–2031 (USD MILLION)


TABLE 32
MODULAR DATA CENTER MARKET FOR PREFABRICATED MODULES, BY REGION, 2021–2025 (USD MILLION)


TABLE 33
MODULAR DATA CENTER MARKET FOR PREFABRICATED MODULES, BY REGION, 2026–2031 (USD MILLION)


TABLE 34
MODULAR DATA CENTER MARKET FOR PREFABRICATED IT MODULES, BY REGION, 2021–2025 (USD MILLION)


TABLE 35
MODULAR DATA CENTER MARKET FOR PREFABRICATED IT MODULES, BY REGION, 2026–2031 (USD MILLION)


TABLE 36
MODULAR DATA CENTER MARKET FOR PREFABRICATED POWER MODULES, BY REGION, 2021–2025 (USD MILLION)


TABLE 37
MODULAR DATA CENTER MARKET FOR PREFABRICATED POWER MODULES, BY REGION, 2026–2031 (USD MILLION)


TABLE 38
MODULAR DATA CENTER MARKET FOR PREFABRICATED COOLING MODULES, BY REGION, 2021–2025 (USD MILLION)


TABLE 39
MODULAR DATA CENTER MARKET FOR PREFABRICATED COOLING MODULES, BY REGION, 2026–2031 (USD MILLION)


TABLE 40
MODULAR DATA CENTER SERVICES MARKET, BY TYPE, 2021–2025 (USD MILLION)


TABLE 41
MODULAR DATA CENTER SERVICES MARKET, BY TYPE, 2026–2031 (USD MILLION)


TABLE 42
MODULAR DATA CENTER SERVICES MARKET, BY REGION, 2021–2025 (USD MILLION)


TABLE 43
MODULAR DATA CENTER SERVICES MARKET, BY REGION, 2026–2031 (USD MILLION)


TABLE 44
MODULAR DATA CENTER MARKET FOR DESIGN & CONSULTING SERVICES, BY REGION, 2021–2025 (USD MILLION)


TABLE 45
MODULAR DATA CENTER MARKET FOR DESIGN & CONSULTING SERVICES, BY REGION, 2026–2031 (USD MILLION)


TABLE 46
MODULAR DATA CENTER MARKET FOR INTEGRATION & DEPLOYMENT SERVICES, BY REGION, 2021–2025 (USD MILLION)


TABLE 47
MODULAR DATA CENTER MARKET FOR INTEGRATION & DEPLOYMENT SERVICES, BY REGION, 2026–2031 (USD MILLION)


TABLE 48
MODULAR DATA CENTER MARKET FOR SUPPORT & MAINTENANCE SERVICES, BY REGION, 2021–2025 (USD MILLION)


TABLE 49
MODULAR DATA CENTER MARKET FOR SUPPORT & MAINTENANCE SERVICES, BY REGION, 2026–2031 (USD MILLION)


TABLE 50
MODULAR DATA CENTER MARKET, BY FORM FACTOR, 2021–2025 (USD MILLION)


TABLE 51
MODULAR DATA CENTER MARKET, BY FORM FACTOR, 2026–2031 (USD MILLION)


TABLE 52
MODULAR DATA CENTER MARKET FOR ISO CONTAINERS, BY TYPE, 2021–2025 (USD MILLION)


TABLE 53
MODULAR DATA CENTER MARKET FOR ISO CONTAINERS, BY TYPE, 2026–2031 (USD MILLION)


TABLE 54
MODULAR DATA CENTER MARKET FOR ISO CONTAINERS, BY REGION, 2021–2025 (USD MILLION)


TABLE 55
MODULAR DATA CENTER MARKET FOR ISO CONTAINERS, BY REGION, 2026–2031 (USD MILLION)


TABLE 56
MODULAR DATA CENTER MARKET FOR 20-FEET CONTAINERS, BY REGION, 2021–2025 (USD MILLION)


TABLE 57
MODULAR DATA CENTER MARKET FOR 20-FEET CONTAINERS, BY REGION, 2026–2031 (USD MILLION)


TABLE 58
MODULAR DATA CENTER MARKET FOR 40-FEET CONTAINERS, BY REGION, 2021–2025 (USD MILLION)


TABLE 59
MODULAR DATA CENTER MARKET FOR 40-FEET CONTAINERS, BY REGION, 2026–2031 (USD MILLION)


TABLE 60
MODULAR DATA CENTER MARKET FOR SKID-MOUNTED SYSTEMS, BY TYPE, 2021–2025 (USD MILLION)


TABLE 61
MODULAR DATA CENTER MARKET FOR SKID-MOUNTED SYSTEMS, BY TYPE, 2026–2031 (USD MILLION)


TABLE 62
MODULAR DATA CENTER MARKET FOR SKID-MOUNTED SYSTEMS, BY REGION, 2021–2025 (USD MILLION)


TABLE 63
MODULAR DATA CENTER MARKET FOR SKID-MOUNTED SYSTEMS, BY REGION, 2026–2031 (USD MILLION)


TABLE 64
MODULAR DATA CENTER MARKET FOR FIXED SKID-MOUNTED SYSTEMS, BY REGION, 2021–2025 (USD MILLION)


TABLE 65
MODULAR DATA CENTER MARKET FOR FIXED SKID-MOUNTED SYSTEMS, BY REGION, 2026–2031 (USD MILLION)


TABLE 66
MODULAR DATA CENTER MARKET FOR PORTABLE SKID-MOUNTED SYSTEMS, BY REGION, 2021–2025 (USD MILLION)


TABLE 67
MODULAR DATA CENTER MARKET FOR PORTABLE SKID-MOUNTED SYSTEMS, BY REGION, 2026–2031 (USD MILLION)


TABLE 68
MODULAR DATA CENTER MARKET FOR ENCLOSURES, BY TYPE, 2021–2025 (USD MILLION)


TABLE 69
MODULAR DATA CENTER MARKET FOR ENCLOSURES, BY TYPE, 2026–2031 (USD MILLION)


TABLE 70
MODULAR DATA CENTER MARKET FOR ENCLOSURES, BY REGION, 2021–2025 (USD MILLION)


TABLE 71
MODULAR DATA CENTER MARKET FOR ENCLOSURES, BY REGION, 2026–2031 (USD MILLION)


TABLE 72
MODULAR DATA CENTER MARKET FOR LOW-DENSITY ENCLOSURES, BY REGION, 2021–2025 (USD MILLION)


TABLE 73
MODULAR DATA CENTER MARKET FOR LOW-DENSITY ENCLOSURES, BY REGION, 2026–2031 (USD MILLION)


TABLE 74
MODULAR DATA CENTER MARKET FOR MEDIUM-DENSITY ENCLOSURES, BY REGION, 2021–2025 (USD MILLION)


TABLE 75
MODULAR DATA CENTER MARKET FOR MEDIUM-DENSITY ENCLOSURES, BY REGION, 2026–2031 (USD MILLION)


TABLE 76
MODULAR DATA CENTER MARKET FOR HIGH-DENSITY ENCLOSURES, BY REGION, 2021–2025 (USD MILLION)


TABLE 77
MODULAR DATA CENTER MARKET FOR HIGH -DENSITY ENCLOSURES, BY REGION, 2026–2031 (USD MILLION)


TABLE 78
MODULAR DATA CENTER MARKET, BY BUILD TYPE, 2021–2025 (USD MILLION)


TABLE 79
MODULAR DATA CENTER MARKET, BY BUILD TYPE, 2026–2031 (USD MILLION)


TABLE 80
MODULAR DATA CENTER MARKET FOR SEMI PREFABRICATED DATA CENTERS, BY REGION, 2021–2025 (USD MILLION)


TABLE 81
MODULAR DATA CENTER MARKET FOR SEMI PREFABRICATED DATA CENTERS, BY REGION, 2026–2031 (USD MILLION)


TABLE 82
MODULAR DATA CENTER MARKET FOR FULLY PREFABRICATED DATA CENTERS, BY REGION, 2021–2025 (USD MILLION)


TABLE 83
MODULAR DATA CENTER MARKET FOR FULLY PREFABRICATED DATA CENTERS, BY REGION, 2026–2031 (USD MILLION)


TABLE 84
MODULAR DATA CENTER MARKET FOR ALL-IN-ONE DATA CENTERS, BY REGION, 2021–2025 (USD MILLION)


TABLE 85
MODULAR DATA CENTER MARKET FOR ALL-IN-ONE DATA CENTERS, BY REGION, 2026–2031 (USD MILLION)


TABLE 86
MODULAR DATA CENTER MARKET, BY DATA CENTER SIZE, 2021–2025 (USD MILLION)


TABLE 87
MODULAR DATA CENTER MARKET, BY DATA CENTER SIZE, 2026–2031 (USD MILLION)


TABLE 88
MODULAR DATA CENTER MARKET FOR SMALL DATA CENTERS, BY REGION, 2021–2025 (USD MILLION)


TABLE 89
MODULAR DATA CENTER MARKET FOR SMALL DATA CENTERS, BY REGION, 2026–2031 (USD MILLION)


TABLE 90
MODULAR DATA CENTER MARKET FOR MID-SIZED DATA CENTERS, BY REGION, 2021–2025 (USD MILLION)


TABLE 91
MODULAR DATA CENTER MARKET FOR MID-SIZED DATA CENTERS, BY REGION, 2026–2031 (USD MILLION)


TABLE 92
MODULAR DATA CENTER MARKET FOR LARGE DATA CENTERS, BY REGION, 2021–2025 (USD MILLION)


TABLE 93
MODULAR DATA CENTER MARKET FOR LARGE DATA CENTERS, BY REGION, 2026–2031 (USD MILLION)


TABLE 94
MODULAR DATA CENTER MARKET, BY DEPLOYMENT TYPE, 2021–2025 (USD MILLION)


TABLE 95
MODULAR DATA CENTER MARKET, BY DEPLOYMENT TYPE, 2026–2031 (USD MILLION)


TABLE 96
MODULAR DATA CENTER MARKET FOR INDOOR DEPLOYMENT, BY REGION, 2021–2025 (USD MILLION)


TABLE 97
MODULAR DATA CENTER MARKET FOR INDOOR DEPLOYMENT, BY REGION, 2026–2031 (USD MILLION)


TABLE 98
MODULAR DATA CENTER MARKET FOR OUTDOOR DEPLOYMENT, BY REGION, 2021–2025 (USD MILLION)


TABLE 99
MODULAR DATA CENTER MARKET FOR OUTDOOR DEPLOYMENT, BY REGION, 2026–2031 (USD MILLION)


TABLE 100
MODULAR DATA CENTER MARKET, BY END USER, 2021–2025 (USD MILLION)


TABLE 101
MODULAR DATA CENTER MARKET, BY END USER, 2026–2031 (USD MILLION)


TABLE 102
MODULAR DATA CENTER MARKET FOR TELECOM SERVICE PROVIDERS, BY REGION, 2021–2025 (USD MILLION)


TABLE 103
MODULAR DATA CENTER MARKET FOR TELECOM SERVICE PROVIDERS, BY REGION, 2026–2031 (USD MILLION)


TABLE 104
MODULAR DATA CENTER MARKET FOR CLOUD SERVICE PROVIDERS, BY REGION, 2021–2025 (USD MILLION)


TABLE 105
MODULAR DATA CENTER MARKET FOR CLOUD SERVICE PROVIDERS, BY REGION, 2026–2031 (USD MILLION)


TABLE 106
MODULAR DATA CENTER MARKET, BY ENTERPRISES, 2021–2025 (USD MILLION)


TABLE 107
MODULAR DATA CENTER MARKET, BY ENTERPRISES, 2026–2031 (USD MILLION)


TABLE 108
MODULAR DATA CENTER MARKET FOR ENTERPRISES, BY REGION, 2021–2025 (USD MILLION)


TABLE 109
MODULAR DATA CENTER MARKET FOR ENTERPRISES, BY REGION, 2026–2031 (USD MILLION)


TABLE 110
BFSI: MODULAR DATA CENTER MARKET FOR ENTERPRISES, BY REGION, 2021–2025 (USD MILLION)


TABLE 111
BFSI: MODULAR DATA CENTER MARKET FOR ENTERPRISES, BY REGION, 2026–2031 (USD MILLION)


TABLE 112
IT & TELECOM: MODULAR DATA CENTER MARKET FOR ENTERPRISES, BY REGION, 2021–2025 (USD MILLION)


TABLE 113
IT & TELECOM: MODULAR DATA CENTER MARKET FOR ENTERPRISES, BY REGION, 2026–2031 (USD MILLION)


TABLE 114
GOVERNMENT & DEFENSE: MODULAR DATA CENTER MARKET FOR ENTERPRISES, BY REGION, 2021–2025 (USD MILLION)


TABLE 115
GOVERNMENT & DEFENSE: MODULAR DATA CENTER MARKET FOR ENTERPRISES, BY REGION, 2026–2031 (USD MILLION)


TABLE 116
HEALTHCARE & LIFE SCIENCES: MODULAR DATA CENTER MARKET FOR ENTERPRISES, BY REGION, 2021–2025 (USD MILLION)


TABLE 117
HEALTHCARE & LIFE SCIENCES: MODULAR DATA CENTER MARKET FOR ENTERPRISES, BY REGION, 2026–2031 (USD MILLION)


TABLE 118
RETAIL & E-COMMERCE: MODULAR DATA CENTER MARKET FOR ENTERPRISES, BY REGION, 2021–2025 (USD MILLION)


TABLE 119
RETAIL & E-COMMERCE: MODULAR DATA CENTER MARKET FOR ENTERPRISES, BY REGION, 2026–2031 (USD MILLION)


TABLE 120
MEDIA & ENTERTAINMENT: MODULAR DATA CENTER MARKET FOR ENTERPRISES, BY REGION, 2021–2025 (USD MILLION)


TABLE 121
MEDIA & ENTERTAINMENT: MODULAR DATA CENTER MARKET FOR ENTERPRISES, BY REGION, 2026–2031 (USD MILLION)


TABLE 122
MANUFACTURING: MODULAR DATA CENTER MARKET FOR ENTERPRISES, BY REGION, 2021–2025 (USD MILLION)


TABLE 123
MANUFACTURING: MODULAR DATA CENTER MARKET FOR ENTERPRISES, BY REGION, 2026–2031 (USD MILLION)


TABLE 124
OTHER VERTICALS: MODULAR DATA CENTER MARKET FOR ENTERPRISES, BY REGION, 2021–2025 (USD MILLION)


TABLE 125
OTHER VERTICALS: MODULAR DATA CENTER MARKET FOR ENTERPRISES, BY REGION, 2026–2031 (USD MILLION)


TABLE 126
MODULAR DATA CENTER MARKET, BY REGION, 2021–2025 (USD MILLION)


TABLE 127
MODULAR DATA CENTER MARKET, BY REGION, 2026–2031 (USD MILLION)


TABLE 128
NORTH AMERICA: MODULAR DATA CENTER MARKET, BY COMPONENT, 2021–2025 (USD MILLION)


TABLE 129
NORTH AMERICA: MODULAR DATA CENTER MARKET, BY COMPONENT, 2026–2031 (USD MILLION)


TABLE 130
NORTH AMERICA: MODULAR DATA CENTER SOLUTIONS MARKET, BY TYPE, 2021–2025 (USD MILLION)


TABLE 131
NORTH AMERICA: MODULAR DATA CENTER SOLUTIONS MARKET, BY TYPE, 2026–2031 (USD MILLION)


TABLE 132
NORTH AMERICA: MODULAR DATA CENTER MARKET FOR PREFABRICATED MODULES, BY TYPE, 2021–2025 (USD MILLION)


TABLE 133
NORTH AMERICA: MODULAR DATA CENTER MARKET FOR PREFABRICATED MODULES, BY TYPE, 2026–2031 (USD MILLION)


TABLE 134
NORTH AMERICA: MODULAR DATA CENTER SERVICES MARKET, BY TYPE, 2021–2025 (USD MILLION)


TABLE 135
NORTH AMERICA: MODULAR DATA CENTER SERVICES MARKET, BY TYPE, 2026–2031 (USD MILLION)


TABLE 136
NORTH AMERICA: MODULAR DATA CENTER MARKET, BY FORM FACTOR, 2021–2025 (USD MILLION)


TABLE 137
NORTH AMERICA: MODULAR DATA CENTER MARKET, BY FORM FACTOR, 2026–2031 (USD MILLION)


TABLE 138
NORTH AMERICA: MODULAR DATA CENTER MARKET FOR ENCLOSURES, BY TYPE, 2021–2025 (USD MILLION)


TABLE 139
NORTH AMERICA: MODULAR DATA CENTER MARKET FOR ENCLOSURES, BY TYPE, 2026–2031 (USD MILLION)


TABLE 140
NORTH AMERICA: MODULAR DATA CENTER MARKET FOR ISO CONTAINERS, BY TYPE, 2021–2025 (USD MILLION)


TABLE 141
NORTH AMERICA: MODULAR DATA CENTER MARKET FOR ISO CONTAINERS, BY TYPE, 2026–2031 (USD MILLION)


TABLE 142
NORTH AMERICA: MODULAR DATA CENTER MARKET FOR SKID-MOUNTED SYSTEMS, BY TYPE, 2021–2025 (USD MILLION)


TABLE 143
NORTH AMERICA: MODULAR DATA CENTER MARKET FOR SKID-MOUNTED SYSTEMS, BY TYPE, 2026–2031 (USD MILLION)


TABLE 144
NORTH AMERICA: MODULAR DATA CENTER MARKET, BY DEPLOYMENT TYPE, 2021–2025 (USD MILLION)


TABLE 145
NORTH AMERICA: MODULAR DATA CENTER MARKET, BY DEPLOYMENT TYPE, 2026–2031 (USD MILLION)


TABLE 146
NORTH AMERICA: MODULAR DATA CENTER MARKET, BY BUILD TYPE, 2021–2025 (USD MILLION)


TABLE 147
NORTH AMERICA: MODULAR DATA CENTER MARKET, BY BUILD TYPE, 2026–2031 (USD MILLION)


TABLE 148
NORTH AMERICA: MODULAR DATA CENTER MARKET, BY DATA CENTER SIZE, 2021–2025 (USD MILLION)


TABLE 149
NORTH AMERICA: MODULAR DATA CENTER MARKET, BY DATA CENTER SIZE, 2026–2031 (USD MILLION)


TABLE 150
NORTH AMERICA: MODULAR DATA CENTER MARKET, BY END USER, 2021–2025 (USD MILLION)


TABLE 151
NORTH AMERICA: MODULAR DATA CENTER MARKET, BY END USER, 2026–2031 (USD MILLION)


TABLE 152
NORTH AMERICA: MODULAR DATA CENTER MARKET FOR ENTERPRISES, BY TYPE, 2021–2025 (USD MILLION)


TABLE 153
NORTH AMERICA: MODULAR DATA CENTER MARKET FOR ENTERPRISES, BY TYPE, 2026–2031 (USD MILLION)


TABLE 154
NORTH AMERICA: MODULAR DATA CENTER MARKET, BY COUNTRY, 2021–2025 (USD MILLION)


TABLE 155
NORTH AMERICA: MODULAR DATA CENTER MARKET, BY COUNTRY, 2026–2031 (USD MILLION)


TABLE 156
US: MODULAR DATA CENTER MARKET, BY COMPONENT, 2021–2025 (USD MILLION)


TABLE 157
US: MODULAR DATA CENTER MARKET, BY COMPONENT, 2026–2031 (USD MILLION)


TABLE 158
CANADA: MODULAR DATA CENTER MARKET, BY COMPONENT, 2021–2025 (USD MILLION)


TABLE 159
CANADA: MODULAR DATA CENTER MARKET, BY COMPONENT, 2026–2031 (USD MILLION)


TABLE 160
EUROPE: MODULAR DATA CENTER MARKET, BY COMPONENT, 2021–2025 (USD MILLION)


TABLE 161
EUROPE: MODULAR DATA CENTER MARKET, BY COMPONENT, 2026–2031 (USD MILLION)


TABLE 162
EUROPE: MODULAR DATA CENTER SOLUTIONS MARKET, BY TYPE, 2021–2025 (USD MILLION)


TABLE 163
EUROPE: MODULAR DATA CENTER SOLUTIONS MARKET, BY TYPE, 2026–2031 (USD MILLION)


TABLE 164
EUROPE: MODULAR DATA CENTER MARKET FOR PREFABRICATED MODULES, BY TYPE, 2021–2025 (USD MILLION)


TABLE 165
EUROPE: MODULAR DATA CENTER MARKET FOR PREFABRICATED MODULES, BY TYPE, 2026–2031 (USD MILLION)


TABLE 166
EUROPE: MODULAR DATA CENTER SERVICES MARKET, BY TYPE, 2021–2025 (USD MILLION)


TABLE 167
EUROPE: MODULAR DATA CENTER SERVICES MARKET, BY TYPE, 2026–2031 (USD MILLION)


TABLE 168
EUROPE: MODULAR DATA CENTER MARKET, BY FORM FACTOR, 2021–2025 (USD MILLION)


TABLE 169
EUROPE: MODULAR DATA CENTER MARKET, BY FORM FACTOR, 2026–2031 (USD MILLION)


TABLE 170
EUROPE: MODULAR DATA CENTER MARKET FOR ENCLOSURES, BY TYPE, 2021–2025 (USD MILLION)


TABLE 171
EUROPE: MODULAR DATA CENTER MARKET FOR ENCLOSURES, BY TYPE, 2026–2031 (USD MILLION)


TABLE 172
EUROPE: MODULAR DATA CENTER MARKET FOR ISO CONTAINERS, BY TYPE, 2021–2025 (USD MILLION)


TABLE 173
EUROPE: MODULAR DATA CENTER MARKET FOR ISO CONTAINERS, BY TYPE, 2026–2031 (USD MILLION)


TABLE 174
EUROPE: MODULAR DATA CENTER MARKET FOR SKID-MOUNTED SYSTEMS, BY TYPE, 2021–2025 (USD MILLION)


TABLE 175
EUROPE: MODULAR DATA CENTER MARKET FOR SKID-MOUNTED SYSTEMS, BY TYPE, 2026–2031 (USD MILLION)


TABLE 176
EUROPE: MODULAR DATA CENTER MARKET, BY DEPLOYMENT TYPE, 2021–2025 (USD MILLION)


TABLE 177
EUROPE: MODULAR DATA CENTER MARKET, BY DEPLOYMENT TYPE, 2026–2031 (USD MILLION)


TABLE 178
EUROPE: MODULAR DATA CENTER MARKET, BY BUILD TYPE, 2021–2025 (USD MILLION)


TABLE 179
EUROPE: MODULAR DATA CENTER MARKET, BY BUILD TYPE, 2026–2031 (USD MILLION)


TABLE 180
EUROPE: MODULAR DATA CENTER MARKET, BY DATA CENTER SIZE, 2021–2025 (USD MILLION)


TABLE 181
EUROPE: MODULAR DATA CENTER MARKET, BY DATA CENTER SIZE, 2026–2031 (USD MILLION)


TABLE 182
EUROPE: MODULAR DATA CENTER MARKET, BY END USER, 2021–2025 (USD MILLION)


TABLE 183
EUROPE: MODULAR DATA CENTER MARKET, BY END USER, 2026–2031 (USD MILLION)


TABLE 184
EUROPE: MODULAR DATA CENTER MARKET FOR ENTERPRISES, BY TYPE, 2021–2025 (USD MILLION)


TABLE 185
EUROPE: MODULAR DATA CENTER MARKET FOR ENTERPRISES, BY TYPE, 2026–2031 (USD MILLION)


TABLE 186
EUROPE: MODULAR DATA CENTER MARKET, BY COUNTRY, 2021–2025 (USD MILLION)


TABLE 187
EUROPE: MODULAR DATA CENTER MARKET, BY COUNTRY, 2026–2031 (USD MILLION)


TABLE 188
UK: MODULAR DATA CENTER MARKET, BY COMPONENT, 2021–2025 (USD MILLION)


TABLE 189
UK: MODULAR DATA CENTER MARKET, BY COMPONENT, 2026–2031 (USD MILLION)


TABLE 190
GERMANY: MODULAR DATA CENTER MARKET, BY COMPONENT, 2021–2025 (USD MILLION)


TABLE 191
GERMANY: MODULAR DATA CENTER MARKET, BY COMPONENT, 2026–2031 (USD MILLION)


TABLE 192
FRANCE: MODULAR DATA CENTER MARKET, BY COMPONENT, 2021–2025 (USD MILLION)


TABLE 193
FRANCE: MODULAR DATA CENTER MARKET, BY COMPONENT, 2026–2031 (USD MILLION)


TABLE 194
ITALY: MODULAR DATA CENTER MARKET, BY COMPONENT, 2021–2025 (USD MILLION)


TABLE 195
ITALY: MODULAR DATA CENTER MARKET, BY COMPONENT, 2026–2031 (USD MILLION)


TABLE 196
REST OF EUROPE: MODULAR DATA CENTER MARKET, BY COMPONENT, 2021–2025 (USD MILLION)


TABLE 197
REST OF EUROPE: MODULAR DATA CENTER MARKET, BY COMPONENT, 2026–2031 (USD MILLION)


TABLE 198
ASIA PACIFIC: MODULAR DATA CENTER MARKET, BY COMPONENT, 2021–2025 (USD MILLION)


TABLE 199
ASIA PACIFIC: MODULAR DATA CENTER MARKET, BY COMPONENT, 2026–2031 (USD MILLION)


TABLE 200
ASIA PACIFIC: MODULAR DATA CENTER SOLUTIONS MARKET, BY TYPE, 2021–2025 (USD MILLION)


TABLE 201
ASIA PACIFIC: MODULAR DATA CENTER SOLUTIONS MARKET, BY TYPE, 2026–2031 (USD MILLION)


TABLE 202
ASIA PACIFIC: MODULAR DATA CENTER MARKET FOR PREFABRICATED MODULES, BY TYPE, 2021–2025 (USD MILLION)


TABLE 203
ASIA PACIFIC: MODULAR DATA CENTER MARKET FOR PREFABRICATED MODULES, BY TYPE, 2026–2031 (USD MILLION)


TABLE 204
ASIA PACIFIC: MODULAR DATA CENTER SERVICES MARKET, BY TYPE, 2021–2025 (USD MILLION)


TABLE 205
ASIA PACIFIC: MODULAR DATA CENTER SERVICES MARKET, BY TYPE, 2026–2031 (USD MILLION)


TABLE 206
ASIA PACIFIC: MODULAR DATA CENTER MARKET, BY FORM FACTOR, 2021–2025 (USD MILLION)


TABLE 207
ASIA PACIFIC: MODULAR DATA CENTER MARKET, BY FORM FACTOR, 2026–2031 (USD MILLION)


TABLE 208
ASIA PACIFIC: MODULAR DATA CENTER MARKET FOR ENCLOSURES, BY TYPE, 2021–2025 (USD MILLION)


TABLE 209
ASIA PACIFIC: MODULAR DATA CENTER MARKET FOR ENCLOSURES, BY TYPE, 2026–2031 (USD MILLION)


TABLE 210
ASIA PACIFIC: MODULAR DATA CENTER MARKET FOR ISO CONTAINERS, BY TYPE, 2021–2025 (USD MILLION)


TABLE 211
ASIA PACIFIC: MODULAR DATA CENTER MARKET FOR ISO CONTAINERS, BY TYPE, 2026–2031 (USD MILLION)


TABLE 212
ASIA PACIFIC: MODULAR DATA CENTER MARKET FOR SKID-MOUNTED SYSTEMS, BY TYPE, 2021–2025 (USD MILLION)


TABLE 213
ASIA PACIFIC: MODULAR DATA CENTER MARKET FOR SKID-MOUNTED SYSTEMS, BY TYPE, 2026–2031 (USD MILLION)


TABLE 214
ASIA PACIFIC: MODULAR DATA CENTER MARKET, BY DEPLOYMENT TYPE, 2021–2025 (USD MILLION)


TABLE 215
ASIA PACIFIC: MODULAR DATA CENTER MARKET, BY DEPLOYMENT TYPE, 2026–2031 (USD MILLION)


TABLE 216
ASIA PACIFIC: MODULAR DATA CENTER MARKET, BY BUILD TYPE, 2021–2025 (USD MILLION)


TABLE 217
ASIA PACIFIC: MODULAR DATA CENTER MARKET, BY BUILD TYPE, 2026–2031 (USD MILLION)


TABLE 218
ASIA PACIFIC: MODULAR DATA CENTER MARKET, BY DATA CENTER SIZE, 2021–2025 (USD MILLION)


TABLE 219
ASIA PACIFIC: MODULAR DATA CENTER MARKET, BY DATA CENTER SIZE, 2026–2031 (USD MILLION)


TABLE 220
ASIA PACIFIC: MODULAR DATA CENTER MARKET, BY END USER, 2021–2025 (USD MILLION)


TABLE 221
ASIA PACIFIC: MODULAR DATA CENTER MARKET, BY END USER, 2026–2031 (USD MILLION)


TABLE 222
ASIA PACIFIC: MODULAR DATA CENTER MARKET FOR ENTERPRISES, BY TYPE, 2021–2025 (USD MILLION)


TABLE 223
ASIA PACIFIC: MODULAR DATA CENTER MARKET FOR ENTERPRISES, BY TYPE, 2026–2031 (USD MILLION)


TABLE 224
ASIA PACIFIC: MODULAR DATA CENTER MARKET, BY COUNTRY, 2021–2025 (USD MILLION)


TABLE 225
ASIA PACIFIC: MODULAR DATA CENTER MARKET, BY COUNTRY, 2026–2031 (USD MILLION)


TABLE 226
CHINA: MODULAR DATA CENTER MARKET, BY COMPONENT, 2021–2025 (USD MILLION)


TABLE 227
CHINA: MODULAR DATA CENTER MARKET, BY COMPONENT, 2026–2031 (USD MILLION)


TABLE 228
JAPAN: MODULAR DATA CENTER MARKET, BY COMPONENT, 2021–2025 (USD MILLION)


TABLE 229
JAPAN: MODULAR DATA CENTER MARKET, BY COMPONENT, 2026–2031 (USD MILLION)


TABLE 230
AUSTRALIA & NEW ZEALAND: MODULAR DATA CENTER MARKET, BY COMPONENT, 2021–2025 (USD MILLION)


TABLE 231
AUSTRALIA & NEW ZEALAND: MODULAR DATA CENTER MARKET, BY COMPONENT, 2026–2031 (USD MILLION)


TABLE 232
REST OF ASIA PACIFIC: MODULAR DATA CENTER MARKET, BY COMPONENT, 2021–2025 (USD MILLION)


TABLE 233
REST OF ASIA PACIFIC: MODULAR DATA CENTER MARKET, BY COMPONENT, 2026–2031 (USD MILLION)


TABLE 234
MIDDLE EAST & AFRICA: MODULAR DATA CENTER MARKET, BY COMPONENT, 2021–2025 (USD MILLION)


TABLE 235
MIDDLE EAST & AFRICA: MODULAR DATA CENTER MARKET, BY COMPONENT, 2026–2031 (USD MILLION)


TABLE 236
MIDDLE EAST & AFRICA: MODULAR DATA CENTER SOLUTIONS MARKET, BY TYPE, 2021–2025 (USD MILLION)


TABLE 237
MIDDLE EAST & AFRICA: MODULAR DATA CENTER SOLUTIONS MARKET, BY TYPE, 2026–2031 (USD MILLION)


TABLE 238
MIDDLE EAST & AFRICA: MODULAR DATA CENTER MARKET FOR PREFABRICATED MODULES, BY TYPE, 2021–2025 (USD MILLION)


TABLE 239
MIDDLE EAST & AFRICA: MODULAR DATA CENTER MARKET FOR PREFABRICATED MODULES, BY TYPE, 2026–2031 (USD MILLION)


TABLE 240
MIDDLE EAST & AFRICA: MODULAR DATA CENTER SERVICES MARKET, BY TYPE, 2021–2025 (USD MILLION)


TABLE 241
MIDDLE EAST & AFRICA: MODULAR DATA CENTER SERVICES MARKET, BY TYPE, 2026–2031 (USD MILLION)


TABLE 242
MIDDLE EAST & AFRICA: MODULAR DATA CENTER MARKET, BY FORM FACTOR, 2021–2025 (USD MILLION)


TABLE 243
MIDDLE EAST & AFRICA: MODULAR DATA CENTER MARKET, BY FORM FACTOR, 2026–2031 (USD MILLION)


TABLE 244
MIDDLE EAST & AFRICA: MODULAR DATA CENTER MARKET FOR ENCLOSURES, BY TYPE, 2021–2025 (USD MILLION)


TABLE 245
MIDDLE EAST & AFRICA: MODULAR DATA CENTER MARKET FOR ENCLOSURES, BY TYPE, 2026–2031 (USD MILLION)


TABLE 246
MIDDLE EAST & AFRICA: MODULAR DATA CENTER MARKET FOR ISO CONTAINERS, BY TYPE, 2021–2025 (USD MILLION)


TABLE 247
MIDDLE EAST & AFRICA: MODULAR DATA CENTER MARKET FOR ISO CONTAINERS, BY TYPE, 2026–2031 (USD MILLION)


TABLE 248
MIDDLE EAST & AFRICA: MODULAR DATA CENTER MARKET FOR SKID-MOUNTED SYSTEMS, BY TYPE, 2021–2025 (USD MILLION)


TABLE 249
MIDDLE EAST & AFRICA: MODULAR DATA CENTER MARKET FOR SKID-MOUNTED SYSTEMS, BY TYPE, 2026–2031 (USD MILLION)


TABLE 250
MIDDLE EAST & AFRICA: MODULAR DATA CENTER MARKET, BY DEPLOYMENT TYPE, 2021–2025 (USD MILLION)


TABLE 251
MIDDLE EAST & AFRICA: MODULAR DATA CENTER MARKET, BY DEPLOYMENT TYPE, 2026–2031 (USD MILLION)


TABLE 252
MIDDLE EAST & AFRICA: MODULAR DATA CENTER MARKET, BY BUILD TYPE, 2021–2025 (USD MILLION)


TABLE 253
MIDDLE EAST & AFRICA: MODULAR DATA CENTER MARKET, BY BUILD TYPE, 2026–2031 (USD MILLION)


TABLE 254
MIDDLE EAST & AFRICA: MODULAR DATA CENTER MARKET, BY DATA CENTER SIZE, 2021–2025 (USD MILLION)


TABLE 255
MIDDLE EAST & AFRICA: MODULAR DATA CENTER MARKET, BY DATA CENTER SIZE, 2026–2031 (USD MILLION)


TABLE 256
MIDDLE EAST & AFRICA: MODULAR DATA CENTER MARKET, BY END USER, 2021–2025 (USD MILLION)


TABLE 257
MIDDLE EAST & AFRICA: MODULAR DATA CENTER MARKET, BY END USER, 2026–2031 (USD MILLION)


TABLE 258
MIDDLE EAST & AFRICA: MODULAR DATA CENTER MARKET FOR ENTERPRISES, BY TYPE, 2021–2025 (USD MILLION)


TABLE 259
MIDDLE EAST & AFRICA: MODULAR DATA CENTER MARKET FOR ENTERPRISES, BY TYPE, 2026–2031 (USD MILLION)


TABLE 260
MIDDLE EAST & AFRICA: MODULAR DATA CENTER MARKET, BY COUNTRY, 2021–2025 (USD MILLION)


TABLE 261
MIDDLE EAST & AFRICA: MODULAR DATA CENTER MARKET, BY COUNTRY, 2026–2031 (USD MILLION)


TABLE 262
GCC COUNTRIES: MODULAR DATA CENTER MARKET, BY COMPONENT, 2021–2025 (USD MILLION)


TABLE 263
GCC COUNTRIES: MODULAR DATA CENTER MARKET, BY COMPONENT, 2026–2031 (USD MILLION)


TABLE 264
GCC COUNTRIES: MODULAR DATA CENTER MARKET, BY COUNTRY, 2021–2025 (USD MILLION)


TABLE 265
GCC COUNTRIES: MODULAR DATA CENTER MARKET, BY COUNTRY, 2026–2031 (USD MILLION)


TABLE 266
SOUTH AFRICA: MODULAR DATA CENTER MARKET, BY COMPONENT, 2021–2025 (USD MILLION)


TABLE 267
SOUTH AFRICA: MODULAR DATA CENTER MARKET, BY COMPONENT, 2026–2031 (USD MILLION)


TABLE 268
REST OF MIDDLE EAST & AFRICA: MODULAR DATA CENTER MARKET, BY COMPONENT, 2021–2025 (USD MILLION)


TABLE 269
REST OF MIDDLE EAST & AFRICA: MODULAR DATA CENTER MARKET, BY COMPONENT, 2026–2031 (USD MILLION)


TABLE 270
LATIN AMERICA: MODULAR DATA CENTER MARKET, BY COMPONENT, 2021–2025 (USD MILLION)


TABLE 271
LATIN AMERICA: MODULAR DATA CENTER MARKET, BY COMPONENT, 2026–2031 (USD MILLION)


TABLE 272
LATIN AMERICA: MODULAR DATA CENTER SOLUTIONS MARKET, BY TYPE, 2021–2025 (USD MILLION)


TABLE 273
LATIN AMERICA: MODULAR DATA CENTER SOLUTIONS MARKET, BY TYPE, 2026–2031 (USD MILLION)


TABLE 274
LATIN AMERICA: MODULAR DATA CENTER MARKET FOR PREFABRICATED MODULES, BY TYPE, 2021–2025 (USD MILLION)


TABLE 275
LATIN AMERICA: MODULAR DATA CENTER MARKET FOR PREFABRICATED MODULES, BY TYPE, 2026–2031 (USD MILLION)


TABLE 276
LATIN AMERICA: MODULAR DATA CENTER SERVICES MARKET, BY TYPE, 2021–2025 (USD MILLION)


TABLE 277
LATIN AMERICA: MODULAR DATA CENTER SERVICES MARKET, BY TYPE, 2026–2031 (USD MILLION)


TABLE 278
LATIN AMERICA: MODULAR DATA CENTER MARKET, BY FORM FACTOR, 2021–2025 (USD MILLION)


TABLE 279
LATIN AMERICA: MODULAR DATA CENTER MARKET, BY FORM FACTOR, 2026–2031 (USD MILLION)


TABLE 280
LATIN AMERICA: MODULAR DATA CENTER MARKET FOR ENCLOSURES, BY TYPE, 2021–2025 (USD MILLION)


TABLE 281
LATIN AMERICA: MODULAR DATA CENTER MARKET FOR ENCLOSURES, BY TYPE, 2026–2031 (USD MILLION)


TABLE 282
LATIN AMERICA: MODULAR DATA CENTER MARKET FOR ISO CONTAINERS, BY TYPE, 2021–2025 (USD MILLION)


TABLE 283
LATIN AMERICA: MODULAR DATA CENTER MARKET FOR ISO CONTAINERS, BY TYPE, 2026–2031 (USD MILLION)


TABLE 284
LATIN AMERICA: MODULAR DATA CENTER MARKET FOR SKID-MOUNTED SYSTEMS, BY TYPE, 2021–2025 (USD MILLION)


TABLE 285
LATIN AMERICA: MODULAR DATA CENTER MARKET FOR SKID-MOUNTED SYSTEMS, BY TYPE, 2026–2031 (USD MILLION)


TABLE 286
LATIN AMERICA: MODULAR DATA CENTER MARKET, BY DEPLOYMENT TYPE, 2021–2025 (USD MILLION)


TABLE 287
LATIN AMERICA: MODULAR DATA CENTER MARKET, BY DEPLOYMENT TYPE, 2026–2031 (USD MILLION)


TABLE 288
LATIN AMERICA: MODULAR DATA CENTER MARKET, BY BUILD TYPE, 2021–2025 (USD MILLION)


TABLE 289
LATIN AMERICA: MODULAR DATA CENTER MARKET, BY BUILD TYPE, 2026–2031 (USD MILLION)


TABLE 290
LATIN AMERICA: MODULAR DATA CENTER MARKET, BY DATA CENTER SIZE, 2021–2025 (USD MILLION)


TABLE 291
LATIN AMERICA: MODULAR DATA CENTER MARKET, BY DATA CENTER SIZE, 2026–2031 (USD MILLION)


TABLE 292
LATIN AMERICA: MODULAR DATA CENTER MARKET, BY END USER, 2021–2025 (USD MILLION)


TABLE 293
LATIN AMERICA: MODULAR DATA CENTER MARKET, BY END USER, 2026–2031 (USD MILLION)


TABLE 294
LATIN AMERICA: MODULAR DATA CENTER MARKET FOR ENTERPRISES, BY TYPE, 2021–2025 (USD MILLION)


TABLE 295
LATIN AMERICA: MODULAR DATA CENTER MARKET FOR ENTERPRISES, BY TYPE, 2026–2031 (USD MILLION)


TABLE 296
LATIN AMERICA: MODULAR DATA CENTER MARKET, BY COUNTRY, 2021–2025 (USD MILLION)


TABLE 297
LATIN AMERICA: MODULAR DATA CENTER MARKET, BY COUNTRY, 2026–2031 (USD MILLION)


TABLE 298
BRAZIL: MODULAR DATA CENTER MARKET, BY COMPONENT, 2021–2025 (USD MILLION)


TABLE 299
BRAZIL: MODULAR DATA CENTER MARKET, BY COMPONENT, 2026–2031 (USD MILLION)


TABLE 300
MEXICO: MODULAR DATA CENTER MARKET, BY COMPONENT, 2021–2025 (USD MILLION)


TABLE 301
MEXICO: MODULAR DATA CENTER MARKET, BY COMPONENT, 2026–2031 (USD MILLION)


TABLE 302
REST OF LATIN AMERICA: MODULAR DATA CENTER MARKET, BY COMPONENT, 2021–2025 (USD MILLION)


TABLE 303
REST OF LATIN AMERICA: MODULAR DATA CENTER MARKET, BY COMPONENT, 2026–2031 (USD MILLION)


TABLE 304
OVERVIEW OF STRATEGIES ADOPTED BY KEY PLAYERS IN MODULAR DATA CENTER MARKET


TABLE 305
MARKET SHARE OF KEY VENDORS IN MODULAR DATA CENTER MARKET, 2023


TABLE 306
MODULAR DATA CENTER MARKET: REGION FOOTPRINT


TABLE 307
MODULAR DATA CENTER MARKET: COMPONENT FOOTPRINT


TABLE 308
MODULAR DATA CENTER MARKET: END-USER FOOTPRINT


TABLE 309
MODULAR DATA CENTER MARKET: LIST OF KEY STARTUPS/SMES


TABLE 310
MODULAR DATA CENTER MARKET: COMPETITIVE BENCHMARKING OF STARTUPS/SMES


TABLE 311
MODULAR DATA CENTER MARKET: PRODUCT LAUNCHES, JANUARY 2021–OCTOBER 2024


TABLE 312
MODULAR DATA CENTER MARKET: DEALS, JANUARY 2022–AUGUST 2026


TABLE 313
DELL: COMPANY OVERVIEW


TABLE 314
DELL: PRODUCTS/SOLUTIONS/SERVICES OFFERED


TABLE 315
DELL: PRODUCT LAUNCHES


TABLE 316
DELL: DEALS


TABLE 317
VERTIV: COMPANY OVERVIEW


TABLE 318
VERTIV: PRODUCTS/SOLUTIONS/SERVICES OFFERED


TABLE 319
VERTIV: PRODUCT LAUNCHES


TABLE 320
VERTIV: DEALS


TABLE 321
SCHNEIDER ELECTRIC: COMPANY OVERVIEW


TABLE 322
SCHNEIDER ELECTRIC: PRODUCTS/SOLUTIONS/SERVICES OFFERED


TABLE 323
SCHNEIDER ELECTRIC: PRODUCT LAUNCHES


TABLE 324
SCHNEIDER ELECTRIC: DEALS


TABLE 325
HUAWEI: COMPANY OVERVIEW


TABLE 326
HUAWEI: PRODUCTS/SOLUTIONS/SERVICES OFFERED


TABLE 327
HUAWEI: PRODUCT LAUNCHES


TABLE 328
HUAWEI: DEALS


TABLE 329
EATON: COMPANY OVERVIEW


TABLE 330
EATON: PRODUCTS/SOLUTIONS/SERVICES OFFERED


TABLE 331
EATON: PRODUCT LAUNCHES


TABLE 332
EATON: DEALS


TABLE 333
EATON: EXPANSIONS


TABLE 334
RITTAL: COMPANY OVERVIEW


TABLE 335
RITTAL: PRODUCTS/SOLUTIONS/SERVICES OFFERED


TABLE 336
RITTAL: PRODUCT LAUNCHES


TABLE 337
RITTAL: DEALS


TABLE 338
JOHNSON CONTROLS: COMPANY OVERVIEW


TABLE 339
JOHNSON CONTROLS: PRODUCTS/SOLUTIONS/SERVICES OFFERED


TABLE 340
JOHNSON CONTROLS: DEALS


TABLE 341
ABB: COMPANY OVERVIEW


TABLE 342
ABB: PRODUCTS/SOLUTIONS/SERVICES OFFERED


TABLE 343
ABB: DEALS


TABLE 344
DELTA ELECTRONICS: COMPANY OVERVIEW


TABLE 345
DELTA ELECTRONICS: PRODUCTS/SOLUTIONS/SERVICES OFFERED


TABLE 346
DELTA ELECTRONICS: DEALS


TABLE 347
STULZ: COMPANY OVERVIEW


TABLE 348
STULZ: PRODUCTS/SOLUTIONS/SERVICES OFFERED


TABLE 349
STULZ: PRODUCT LAUNCHES


TABLE 350
STULZ: DEALS


TABLE 351
HUBBELL (PCX): COMPANY OVERVIEW


TABLE 352
HUBBELL (PCX): PRODUCTS/SOLUTIONS/SERVICES OFFERED


TABLE 353
HUBBELL (PCX): DEALS


TABLE 354
FACTOR ANALYSIS


LIST OF FIGURES


FIGURE 1
MARKET SCENARIO


FIGURE 2
MODULAR DATA CENTER MARKET SNAPSHOT, 2021–2031 (USD MILLION)


FIGURE 3
MAJOR STRATEGIES ADOPTED BY KEY PLAYERS IN MODULAR DATA CENTER MARKET, 2023–2026


FIGURE 4
DISRUPTIONS INFLUENCING GROWTH OF MODULAR DATA CENTER MARKET


FIGURE 5
HIGH-GROWTH SEGMENTS IN MODULAR DATA CENTER MARKET, 2026–2031


FIGURE 6
ASIA PACIFIC TO REGISTER HIGHEST CAGR IN MODULAR DATA CENTER MARKET DURING FORECAST PERIOD


FIGURE 7
GROWING NEED FOR FLEXIBLE, SCALABLE SOLUTIONS TO ACCELERATE DEMAND


FIGURE 8
SOLUTIONS TO ACCOUNT FOR LARGER MARKET SHARE IN 2025


FIGURE 9
PREFABRICATED MODULES SEGMENT TO ACCOUNT FOR LARGER MARKET SHARE IN 2025


FIGURE 10
PREFABRICATED IT MODULES SEGMENT TO ACCOUNT FOR LARGEST MARKET SHARE IN 2025


FIGURE 11
SUPPORT & MAINTENANCE SERVICES TO ACCOUNT FOR LARGEST MARKET SHARE IN 2025


FIGURE 12
ENCLOSURES SEGMENT TO ACCOUNT FOR LARGEST MARKET SHARE IN 2025


FIGURE 13
MEDIUM-DENSITY ENCLOSURES SEGMENT TO ACCOUNT FOR LARGEST MARKET SHARE IN 2025


FIGURE 14
40-FEET CONTAINERS SEGMENT TO ACCOUNT FOR LARGEST MARKET SHARE IN 2025


FIGURE 15
FIXED SKID-MOUNTED SYSTEMS SEGMENT TO ACCOUNT FOR LARGER MARKET SHARE IN 2031


FIGURE 16
INDOOR SEGMENT TO ACCOUNT FOR LARGER MARKET SHARE IN 2025


FIGURE 17
SEMI PREFABRICATED DATA CENTERS SEGMENT TO ACCOUNT FOR LARGEST MARKET SHARE IN 2025


FIGURE 18
LARGE DATA CENTERS SEGMENT TO ACCOUNT FOR LARGEST MARKET SHARE IN 2025


FIGURE 19
CLOUD SERVICE PROVIDERS SEGMENT TO ACCOUNT FOR LARGEST MARKET SHARE IN 2025


FIGURE 20
ASIA PACIFIC TO BE BEST MARKET FOR INVESTMENTS IN NEXT FIVE YEARS


FIGURE 21
MODULAR DATA CENTER MARKET: DRIVERS, RESTRAINTS, OPPORTUNITIES, AND CHALLENGES


FIGURE 22
MODULAR DATA CENTER MARKET: PORTER’S FIVE FORCES ANALYSIS


FIGURE 23
MODULAR DATA CENTER MARKET: SUPPLY CHAIN ANALYSIS


FIGURE 24
MODULAR DATA CENTER MARKET: ECOSYSTEM ANALYSIS


FIGURE 25
TRENDS/DISRUPTIONS IMPACTING CUSTOMER BUSINESS


FIGURE 26
INVESTMENT AND FUNDING SCENARIO OF MAJOR MODULAR DATA CENTER COMPANIES


FIGURE 27
IMPORT DATA, BY COUNTRY, 2021–2025 (USD MILLION)


FIGURE 28
EXPORT DATA, BY COUNTRY, 2021–2025 (USD MILLION)


FIGURE 29
MODULAR DATA CENTER MARKET: PATENT ANALYSIS, 2015–2025


FIGURE 30
FUTURE APPLICATIONS OF MODULAR DATA CENTERS


FIGURE 31
MODULAR DATA CENTER MARKET: DECISION-MAKING FACTOR


FIGURE 32
INFLUENCE OF STAKEHOLDERS ON BUYING PROCESS FOR END USERS


FIGURE 33
KEY BUYING CRITERIA FOR END USERS


FIGURE 34
ADOPTION BARRIERS AND INTERNAL CHALLENGES


FIGURE 35
SERVICES SEGMENT TO REGISTER HIGHEST GROWTH DURING FORECAST PERIOD


FIGURE 36
ALL-IN-ONE MODULES SEGMENT TO REGISTER HIGHER CAGR DURING FORECAST PERIOD


FIGURE 37
PREFABRICATED COOLING MODULES SEGMENT TO REGISTER HIGHEST GROWTH DURING FORECAST PERIOD


FIGURE 38
SUPPORT & MAINTENANCE SEGMENT TO REGISTER HIGHEST GROWTH DURING FORECAST PERIOD


FIGURE 39
SKID-MOUNTED SYSTEMS SEGMENT TO REGISTER HIGHEST GROWTH DURING FORECAST PERIOD


FIGURE 40
20-FEET CONTAINERS SEGMENT TO REGISTER HIGHER CAGR DURING FORECAST PERIOD


FIGURE 41
PORTABLE SKID-MOUNTED SYSTEMS SEGMENT TO REGISTER HIGHER CAGR DURING FORECAST PERIOD


FIGURE 42
HIGH-DENSITY ENCLOSURES SEGMENT TO REGISTER HIGHEST CAGR DURING FORECAST PERIOD


FIGURE 43
FULLY PREFABRICATED DATA CENTERS SEGMENT TO REGISTER HIGHEST CAGR DURING FORECAST PERIOD


FIGURE 44
SMALL DATA CENTERS SEGMENT TO REGISTER HIGHEST CAGR DURING FORECAST PERIOD


FIGURE 45
OUTDOOR SEGMENT TO DOMINATE MARKET IN 2030


FIGURE 46
TELECOM SERVICE PROVIDERS SEGMENT TO REGISTER HIGHEST CAGR DURING FORECAST PERIOD


FIGURE 47
IT & ITES SEGMENT TO ACCOUNT FOR LARGEST MARKET SIZE IN 2024


FIGURE 48
NORTH AMERICA TO DOMINATE MARKET DURING FORECAST PERIOD


FIGURE 49
NORTH AMERICA: MODULAR DATA CENTER MARKET SNAPSHOT


FIGURE 50
ASIA PACIFIC: MODULAR DATA CENTER MARKET SNAPSHOT


FIGURE 51
MODULAR DATA CENTER MARKET SHARE ANALYSIS, 2025


FIGURE 52
MODULAR DATA CENTER MARKET: VENDOR PRODUCT/BRAND COMPARISON


FIGURE 53
MODULAR DATA CENTER MARKET: REVENUE ANALYSIS OF KEY PLAYERS, 2021–2025 (USD MILLION)


FIGURE 54
COMPANY EVALUATION MATRIX FOR KEY PLAYERS: CRITERIA WEIGHTAGE


FIGURE 55
MODULAR DATA CENTER MARKET: COMPANY EVALUATION MATRIX (KEY PLAYERS), 2025


FIGURE 56
MODULAR DATA CENTER MARKET: COMPANY FOOTPRINT


FIGURE 57
EVALUATION MATRIX FOR STARTUPS/SMES: CRITERIA WEIGHTAGE


FIGURE 58
MODULAR DATA CENTER MARKET: COMPANY EVALUATION MATRIX (STARTUPS/SMES), 2025


FIGURE 59
COMPANY VALUATION OF KEY VENDORS


FIGURE 60
EV/EBITDA ANALYSIS OF KEY VENDORS


FIGURE 61
YEAR-TO-DATE (YTD) PRICE TOTAL RETURN AND 5-YEAR STOCK BETA OF KEY VENDORS


FIGURE 62
DELL: COMPANY SNAPSHOT


FIGURE 63
VERTIV: COMPANY SNAPSHOT


FIGURE 64
SCHNEIDER ELECTRIC: COMPANY SNAPSHOT


FIGURE 65
HUAWEI: COMPANY SNAPSHOT


FIGURE 66
EATON: COMPANY SNAPSHOT


FIGURE 67
JOHNSON CONTROLS: COMPANY SNAPSHOT


FIGURE 68
ABB: COMPANY SNAPSHOT


FIGURE 69
DELTA ELECTRONICS: COMPANY SNAPSHOT


FIGURE 70
HUBBELL (PCX): COMPANY SNAPSHOT


FIGURE 71
MODULAR DATA CENTER MARKET: RESEARCH DESIGN


FIGURE 72
BREAKUP OF PRIMARY INTERVIEWS: BY COMPANY TYPE, DESIGNATION, AND REGION


FIGURE 73
MODULAR DATA CENTER MARKET: TOP-DOWN AND BOTTOM-UP APPROACHES


FIGURE 74
MARKET SIZE ESTIMATION METHODOLOGY: SUPPLY-SIDE ANALYSIS


FIGURE 75
MARKET SIZE ESTIMATION METHODOLOGY - BOTTOM-UP APPROACH (SUPPLY SIDE): COLLECTIVE REVENUE OF MODULAR DATA CENTER VENDORS


FIGURE 76
MARKET SIZE ESTIMATION METHODOLOGY – (SUPPLY SIDE): ILLUSTRATION OF VENDOR REVENUE ESTIMATION


FIGURE 77
MARKET SIZE ESTIMATION METHODOLOGY – APPROACH 2 (DEMAND SIDE): REVENUE GENERATED FROM END USERS


FIGURE 78
MARKET SIZE ESTIMATION METHODOLOGY – APPROACH 2 (DEMAND SIDE): MODULAR DATA CENTER MARKET


Methodology

The study involved four major activities in estimating the modular data center market. We conducted secondary research to gather information on the market, competitors, and parent market. The next stage was to validate these findings and assumptions and size them with industry professionals across the value chain using primary research. Top-down and bottom-up methodologies were used to determine the total market size. We used the market breakup and data triangulation techniques to estimate the market size of the modular data center market segments.

Secondary Research

Multiple sources were utilized to find and gather data for this research project in the secondary research phase. Other sources used were annual reports, press releases, investor presentations, white papers, journals, publications, and articles from reputable sources, directories, and databases. Information was also collected from additional secondary sources like academic journals, official government sites, blogs, and online platforms of vendors.

Primary Research

Primary sources included industry experts from the core and associated industries, preferred software suppliers, hardware manufacturers, distributors, service providers, technology developers, alliances, and organizations representing all parts of the industry's value chain. In-depth interviews were conducted with primary respondents, including major industry participants, subject-matter experts, C-level executives of important market companies, and industry consultants, to acquire and verify critical qualitative and quantitative data and analyze the market's potential.

We performed primary interviews to gain insights such as market statistics, the current trends disrupting the industry, new use cases applied, revenue data collected from products and services, market breakdowns, market size projections, market predictions, and data triangulation. Primary research has helped us grasp different technology trends, segmentation types, industry trends, and geographies. Demand-side stakeholders, such as Chief Information Officers (CIOs), Chief Technology Officers (CTOs), and Chief Security Officers (CSOs); installation teams of governments/end users using modular data center solutions and services; and digital initiatives project teams, were interviewed to understand the buyer's perspective on suppliers, products, service providers, and their current use of services, which will affect the overall modular data center market.

Breakup of Primary Profiles:

Modular Data Center Market Size, and Share

*Others include sales managers, marketing managers, and product managers
Note: Tier 1 – recorded overall annual revenues of more than USD 10 billion; Tier 2 company – USD 1–10 billion; and Tier 3 company – USD 500 million – 1 billion of the overall revenues

To know about the assumptions considered for the study, download the pdf brochure

Market Size Estimation

We estimated and forecasted the modular data center market. And other related submarkets using top-down and bottom-up methodologies. We used a bottom-up approach to calculate the overall market size by analyzing the revenues and offerings of significant market players. This study used data triangulation methods and validation through primary interviews to determine and confirm the precise worth of the whole parent market. We used the overall market size in the top-down process to estimate the size of other particular markets using percentage splits of market segments.

We used top-down and bottom-up approaches to estimate and validate the modular data center market and other dependent subsegments.  
The research methodology used to estimate the market size included the following details:    

  • We identified key players in the market through secondary research. We then determined their revenue contributions in the respective countries through primary and secondary research.
  • This procedure included studying top market players' annual and financial reports and extensive interviews for key insights from industry leaders, such as Chief Executive Officers (CEOs), VPs, directors, and marketing executives.
  • All percentage splits and breakups were determined using secondary sources and verified through primary sources.

Using top-down and bottom-up methodologies, we estimated and forecasted the modular data center market and related submarkets. We used a bottom-up approach to calculate the overall market size by analyzing the revenues and offerings of significant market players. This study used data triangulation methods and validation through primary interviews to determine and confirm the precise worth of the whole parent market. We used the overall market size in the top-down process to estimate the size of other particular markets using percentage splits of market segments.

Modular Data Center Market: Top-Down and Bottom-Up Approach

Modular Data Center Market Top Down and Bottom Up Approach

Data Triangulation

After determining the overall market size, the market was divided into segments and subsegments using the previously described market size estimating techniques. Where applicable, data triangulation and market breakup methods were used to complete the whole market engineering process and ascertain the exact numbers for each market segment and subsegment. The data was triangulated by evaluating many elements and trends on the demand and supply sides of the modular data center market. 

Market Definition

Considering the views of various sources and associations, MarketsandMarkets defines modular data center as "a deployment method and engineered solution for assembling a portable data center out of prefabricated modular components (commonly ISO standard container dimensions) that enable scalability and a rapid delivery schedule. Characteristics of modular data centers include standardization, rapid time to market, multiple power and cooling options, ease of deployment, greater reliability, location flexibility, smaller footprint, minimal construction dependencies, ease of scale, reduced stranded capacity, and lower cost, among others."

According to Subird, "A modular data center is a self-contained, prefabricated, and portable data center that can be easily transported and deployed where additional data center capacity is needed."

Key Stakeholders

  • Cloud Service Providers (CSPs)
  • Original Equipment Manufacturers (OEMs)
  • Data Center Equipment Suppliers
  • Colocation Providers
  • Technology Services Providers
  • Data Center Managed Services Providers
  • Government Organizations
  • Networking Companies
  • Consultants/Consultancies/Advisory Firms
  • Support and Maintenance Service Providers
  • Telecom Service Providers
  • Information Technology (IT) Infrastructure Providers
  • System Integrators (SIs)
  • Regional Associations
  • Independent Software Vendors
  • Value-added Resellers and Distributors 

Report Objectives

  • To define, describe, and forecast the Modular Data Center market based on component, form factor, deployment type, build type, data center size, end user, and region
  • To forecast the market size of the five major regional segments: North America, Europe, Asia Pacific, Middle East & Africa, and Latin America
  • To strategically analyze the market subsegments with respect to individual growth trends, prospects, and contributions to the total market
  • To provide detailed information related to the major factors influencing the growth of the market (drivers, restraints, opportunities, and challenges)
  • To strategically analyze macro and micro markets with respect to growth trends, prospects, and their contribution to the overall market
  • To analyze industry trends, patents and innovations, and pricing data related to the market
  • To analyze the opportunities in the market for stakeholders and provide details of the competitive landscape for major players.
  • To profile key players in the market and comprehensively analyze their market share/ranking and core competencies.
  • To track and analyze competitive developments, such as mergers & acquisitions, product developments, and partnerships & collaborations in the market.

Available customizations:

With the given market data, MarketsandMarkets offers customizations per the company's specific needs. The following customization options are available for the report:

Product Analysis

  • The product matrix provides a detailed comparison of each company's product portfolio.

Geographic Analysis

  • Further breakdown of the Asia Pacific market into countries contributing 75% to the regional market size
  • Further breakup of the North American market into countries contributing 75% to the regional market size
  • Further breakup of the Latin American market into countries contributing 75% to the regional market size
  • Further breakup of the Middle Eastern & African market into countries contributing 75% to the regional market size
  • Further breakup of the European market into countries contributing 75% to the regional market size  

Company Information

  • Detailed analysis and profiling of additional market players (up to 5)


Key Questions Addressed by the Report

What is the projected size and growth rate of the Modular Data Center Market?

The Modular Data Center Market is projected to grow from USD 41.0 billion in 2026 to USD 93.6 billion by 2031, registering a CAGR of 18.0% during the 2026–2031 forecast period.

What is driving the growth of the Modular Data Center Market?

Growth is driven by rising cloud computing adoption, increasing AI workloads, demand for scalable and rapidly deployable infrastructure, and expanding edge computing, IoT, and 5G deployments.

What are the key trends shaping the Modular Data Center Market?

Key trends include wider adoption of prefabricated modules, edge data center deployments, and energy-efficient power and cooling solutions that support faster installation and flexible capacity expansion.

Which solution types are covered in the Modular Data Center Market?

The market covers all-in-one solutions and prefabricated modules, including IT, power, and cooling modules, along with related design, integration, deployment, support, and maintenance services.

Which region is expected to grow fastest in the Modular Data Center Market?

Asia Pacific is expected to be the fastest-growing region, supported by digital transformation, increasing cloud adoption, and investment in AI, IoT, 5G, and edge computing infrastructure.

What opportunities are emerging in the Modular Data Center Market?

Opportunities are emerging from growing demand for AI-ready infrastructure, edge computing, and rapidly deployable data center capacity, as well as the need for energy-efficient power and cooling systems.

Personalize This Research

  • Triangulate with your Own Data
  • Get Data as per your Format and Definition
  • Gain a Deeper Dive on a Specific Application, Geography, Customer or Competitor
  • Any level of Personalization
Request A Free Customisation

Let Us Help You

  • What are the Known and Unknown Adjacencies Impacting the Modular Data Center Market
  • What will your New Revenue Sources be?
  • Who will be your Top Customer; what will make them switch?
  • Defend your Market Share or Win Competitors
  • Get a Scorecard for Target Partners
Customized Workshop Request

Custom Market Research Services

We Will Customise The Research For You, In Case The Report Listed Above Does Not Meet With Your Requirements

Get 10% Free Customisation

TESTIMONIALS

Growth opportunities and latent adjacency in Modular Data Center Market

DMCA.com Protection Status
popup img