Micro Mobile Data Center Market

Micro Mobile Data Center Market by Application (Instant Data Center, Remote Office and Branch Office, and Edge Computing), Rack Unit (Up to 20 RU, 20 RU to 40 RU, and Above 40 RU), Organization Size, Vertical, and Region - Global Forecast to 2025

Report Code: TC 2575 Oct, 2020, by marketsandmarkets.com

Micro mobile data center Market Forecast, Size, Global Trends

The global Micro Mobile Data Center Market size was crossed $3.0 billion in 2020 and is anticipated to exhibit a CAGR of 16.6% to reach $6.5 billion by the end of 2025.

The micro mobile data center is a self-contained infrastructural design achieved by integrating the storage, processing, and networking modules required to run indoor and outdoor applications in a secure computing environment. Micro mobile data centers are available in standardized prefabricated sizes that enable the data center owners to save their capital investment and the time needed in building data centers by the traditional approach. The size and flexibility features of micro mobile data centers make them ideal for use in applications, such as instant data centers, remote office and branch office, and edge computing. The growing requirement for high performing, energy efficient, and cost-effective data center solutions is the major growth driver of the micro mobile data center market.

Micro Mobile Data Center Market

To know about the assumptions considered for the study, Request for Free Sample Report

COVID-19 impact on global micro mobile data center market

In the COVID-19 pandemic situation, data centers and micro mobile data center plays a vital role for organizations worldwide. The exponential growth in the amount of data consumed and generated by various organizations and individuals has pushed the rise in demand for data storage leading to the increase in number of reliable and highly available data centers. Globally data centers are emerging as computational hubs for end-users and enterprises as the number of work-from-home jobs has highly surged. However, In an Uptime Institute survey of over 200 critical IT/facility infrastructure operators around the world, a third of operators said a reduced level of IT infrastructure operations staff due to COVID-19 poses the single biggest risk to operations. There are many project delays as the supply chain has taken a hit due to the COVID-19 pandemic. Due to supply chain disruption of hardware components from major IT vendors, the market is expected to grow slowly in 2020. However, the demand is expected to grow due to edge computing, remote office and branch office, and instant data center, and therefore, the market will grow steadily in the coming few years. Edge computing will be the major driver that will pick up the micro mobile data center market. Moreover, data center modernization has become a critical need, as organizations are looking to reduce their CAPEX due to increasing pressure on company financials.

Micro mobile data center Market Dynamics

Driver: Growing demand for plug-and-play data centers

The data center is the heart of an organization. It is the location where crucial information is stored and from where it is distributed. With advancements in the current technological landscape and businesses becoming more centralized, the need for investments in traditional data centers has reduced. As a result, the demand for more compact and efficient data centers to be installed across offices has begun to emerge. Plug–and-play micro data centers offer fully integrated and pre-tested solutions. These data centers can easily scale up as per the growing needs of an organization. However, the most attractive thing is the fact that micro mobile data centers enable faster deployment. The plug-and-play approach has proven to be brilliant, thus helping in the deployment of data centers in just a few days rather than weeks or even months.

Restraint: Vendor lock-ins limit customer purchase options

Traditional data centers are often built-to-order and offer the option of customization as per the user’s environment. These functionalities enable data center users to deploy data center components from different vendors and adapt them as per their requirements and their overall operating environment. However, micro mobile data center vendors do not offer fully customized solutions and the flexibility of letting the vendor choose their service provider due to their standardized nature and prefabricated modules. These data centers are equipped with components that are standardized by their vendors. Thus, organizations adopting micro mobile data centers are restricted to a single vendor, restraining them from adding new solutions from different vendors to optimize the functioning of their data centers. This lack of customization and limitations in buying options may hinder the growth of the global micro mobile data center market.

Opportunities: Opportunities in the deployment of edge computing applications

The demand for computing power is increasing in various sectors, including industries, offices, distribution warehouses, telecom clouds, and others. Telecommunication companies are deploying higher-density micro mobile data centers with 8kW to 10kW per cabinet. Distribution centers that need high computing power to manage inventory, transactions and shipping data prefer micro mobile data centers to process orders more efficiently and quickly. Moreover, retail outlets are now focusing on growing their in-store computing power to help provide customers with real-time discounts and advertise products that customers are most likely to purchase. This surge in demand for real-time computing is anticipated to drive the growth of the micro mobile data center market. Micro mobile data centers are easy-to-procure, simple-to-deploy, and are integrated systems that are easily scalable. With the benefits that micro mobile data centers offer, customers are able to expand network edges and provide more computing.

Challenge: Integration with traditional data centers

Data center managers take into consideration how well a micro mobile data center will work with existing traditional data center infrastructure. For example, data center infrastructure management applications provide a central console for monitoring a range of resources, including physical and virtual servers and cooling and power distribution systems. If a micro mobile data center solution comes with its own Data Center Infrastructure Management (DCIM) capabilities, it should support standard interfaces for sharing information with an organization’s existing DCIM program or other systems management applications. If the organization decides to install an external cooling setup, its integration with traditional data centers can complicate the existing situation. This hampers the overall efficiency of the data center infrastructure and increases the overall operational costs.

Edge computing application to grow at the highest CAGR during the forecast period

With an accelerated demand for instantaneous access to data anytime and anywhere, edge computing and micro mobile data centers are becoming more abundant and increasingly valuable. The cost factor plays a major role in most businesses. Traditional data centers and server closets usually come with high upfront fees, whereas micro mobile data centers are more affordable and do not occupy unnecessary room. Connecting billions of devices to the cloud presents numerous challenges, bandwidth restrictions, data security risks, and reduced communication between computing infrastructure. Edge computing has the potential to prevent such issues from arising as the physical infrastructure is located closer to the source data. Micro mobile data centers are a perfect fit for organizations that wish to leverage low latency edge computing.

Large enterprises to hold a larger market size during the forecast period

Large enterprises face various issues related to higher power consumption and higher carbon footprint, among others. Micro mobile data centers are highly efficient in terms of power and cooling that are fit in the box instead of the entire physical infrastructure as required in traditional data centers. Micro mobile data centers placed at the edge of the network facilitate faster a response time and reduce bottlenecks. Micro mobile data centers further help enterprises with easy and quick deployments, thus helping them to expand their existing data centers, instead of constructing a new one. They save a lot of time and reduce the cost involved in building and maintenance. These benefits and features of micro mobile data centers have favored their adoption among large enterprises.

Asia Pacific to grow the highest during the forecast period

The global micro mobile data center market by region covers 5 major geographic regions, namely, North America, Asia Pacific (APAC), Europe, Middle East and Africa (MEA), and Latin America. Asia Pacific is expected to grow the highest owing to the rising adoption of advanced technologies, such as IoT and edge computing.

Micro Mobile Data Center Market by Region

To know about the assumptions considered for the study, download the pdf brochure

Key Market Players

The micro mobile data center market comprises major solution providers, such as Schneider Electric (France), HPE (US), Dell Technologies (US), Vertiv (US), Eaton (Ireland), Huawei (China), IBM (US), Rittal (Germany), Panduit (US), STULZ (Germany), Delta Electronics (Taiwan), Zella DC (Australia), ScaleMatrix (US), Canovate (Turkey), DataRacks (UK), Altron (Czech Republic), Cannon Technologies (UK), KSTAR (China), SICON (China), and Hanley Energy (Ireland). Some startups includes Axellio (US), EdgeMicro (US), MetroEDGE (US), Vapor IO (US), and EdgePresence (US).

The study includes an in-depth competitive analysis of these key players in the micro mobile data center market with their company profiles, recent developments, and key market strategies.

Get online access to the report on the World's First Market Intelligence Cloud

  • Easy to Download Historical Data & Forecast Numbers
  • Company Analysis Dashboard for high growth potential opportunities
  • Research Analyst Access for customization & queries
  • Competitor Analysis with Interactive dashboard
  • Latest News, Updates & Trend analysis
Request Sample

Scope of the Report

Report Metric

Details

Market size available for years

2016–2025

Base year considered

2019

Forecast period

2020–2025

Forecast units

 (USD)

Segments covered

Application, Rack unit, Organization size, Vertical and Region

Geographies covered

North America, APAC, Europe, Latin America, and MEA

Companies covered

Schneider Electric (France), HPE (US), Dell Technologies (US), Vertiv (US), Eaton (Ireland), Huawei (China), IBM (US), Rittal (Germany), Panduit (US), STULZ (Germany), Delta Electronics (Taiwan), Zella DC (Australia), ScaleMatrix (US), Canovate (Turkey), DataRacks (UK), Altron (Czech Republic), Cannon Technologies (UK), KSTAR (China), SICON (China), and Hanley Energy (Ireland). Some startups includes Axellio (US), EdgeMicro (US), MetroEDGE (US), Vapor IO (US), and EdgePresence (US).

This research report categorizes the micro mobile data center market based on applications, rack unit, organization size, vertical, and region.

Based on applications, the market has been segmented as follows:

  • Instant Data Center
  • Remote Office and Branch Office
  • Edge Computing

Based on Rack Unit (RU), the micro mobile data center market has been segmented as follows:

  • Up to 20 RU
  • 20 RU to 40 RU
  • Above 40 RU

Based on organization size, the market has been segmented as follows

  • Small and Medium-sized Enterprises
  • Large Enterprises

Based on verticals, the micro mobile data center market has been segmented as follows

  • BFSI
  • IT and Telecommunication
  • Media and Entertainment
  • Healthcare
  • Government and Defense
  • Retail
  • Manufacturing
  • Others (Energy, education, and transportation and  logistics)

Based on regions, the micro mobile data center market has been segmented as follows:

  • North America
    • US
    • Canada
  • Europe
    • UK
    • Germany
    • France
    • Rest of Europe
  • APAC
    • China
    • Japan
    • Australia and New Zealand
    • Rest of APAC
  • MEA
    • KSA (Kingdom of Saudi Arabia)
    • United Arab Emirates (UAE)
    • South Africa
    • Rest of MEA
  • Latin America
    • Brazil
    • Mexico
    • Rest of Latin America

Recent Developments

  • In March 2020, Schneider Electric launched a cooling solution for edge and micro data centers. This new solution aims to make cooling more efficient and ultimately reduce operational costs.
  • In August 2019, Rittal partnered with ABB and HPE to provide turnkey resilient micro-modular datacenters purpose-built for rough environments, which would help customers turn their data into action in real time.
  • In august 2020, Vertiv introduced Vertiv Environet Alert, a new software offering that brings enterprise-level infrastructure monitoring and management capabilities to micro mobile data centers and edge facilities.

Frequently Asked Questions (FAQ):

To speak to our analyst for a discussion on the above findings, click Speak to Analyst


TABLE OF CONTENTS

1 INTRODUCTION (Page No. - 24)
    1.1 INTRODUCTION TO COVID-19
    1.2 COVID-19 HEALTH ASSESSMENT
        FIGURE 1 COVID-19: GLOBAL PROPAGATION
        FIGURE 2 COVID-19 PROPAGATION: SELECT COUNTRIES
    1.3 COVID-19 ECONOMIC ASSESSMENT
        FIGURE 3 REVISED GROSS DOMESTIC PRODUCT FORECASTS FOR SELECT G20 COUNTRIES IN 2020
           1.3.1 COVID-19 ECONOMIC IMPACT—SCENARIO ASSESSMENT
                 FIGURE 4 FACTORS IMPACTING THE GLOBAL ECONOMY
                 FIGURE 5 SCENARIOS IN TERMS OF RECOVERY OF GLOBAL ECONOMY
    1.4 OBJECTIVES OF THE STUDY
    1.5 MARKET DEFINITION
           1.5.1 INCLUSIONS AND EXCLUSIONS
    1.6 MARKET SCOPE
           1.6.1 MARKET SEGMENTATION
                 FIGURE 6 MICRO MOBILE DATA CENTER MARKET: MARKET SEGMENTATION
           1.6.2 REGIONS COVERED
           1.6.3 YEARS CONSIDERED FOR THE STUDY
    1.7 CURRENCY CONSIDERED
        TABLE 1 UNITED STATES DOLLAR EXCHANGE RATE, 2016–2019
    1.8 STAKEHOLDERS
    1.9 SUMMARY OF CHANGES

2 RESEARCH METHODOLOGY (Page No. - 34)
    2.1 RESEARCH DATA
        FIGURE 7 MICRO MOBILE DATA CENTER MARKET: RESEARCH DESIGN
           2.1.1 SECONDARY DATA
           2.1.2 PRIMARY DATA
                    2.1.2.1 Breakup of primaries
                            FIGURE 8 BREAKUP OF PRIMARY INTERVIEWS: BY COMPANY TYPE, DESIGNATION, AND REGION
                    2.1.2.2 Key industry insights
    2.2 MARKET BREAKUP AND DATA TRIANGULATION
    2.3 MARKET SIZE ESTIMATION
        FIGURE 9 MARKET SIZE ESTIMATION METHODOLOGY: REVENUE GENERATION FROM MICRO MOBILE DATA CENTER VENDORS
        FIGURE 10 MICRO MOBILE DATA CENTER MARKET: TOP-DOWN AND BOTTOM-UP APPROACHES
           2.3.1 BOTTOM-UP APPROACH
           2.3.2 TOP-DOWN APPROACH
    2.4 MARKET FORECAST
        TABLE 2 FACTOR ANALYSIS
    2.5 ASSUMPTIONS OF THE STUDY
           2.5.1 SUPPLY SIDE
                 FIGURE 11 MARKET PROJECTIONS FROM THE SUPPLY SIDE
           2.5.2 DEMAND SIDE
                 FIGURE 12 MARKET PROJECTIONS FROM THE DEMAND SIDE
    2.6 LIMITATIONS OF THE STUDY

3 EXECUTIVE SUMMARY (Page No. - 43)
  TABLE 3 MICRO MOBILE DATA CENTER MARKET SIZE AND GROWTH RATE, 2018–2025 (USD MILLION)
  FIGURE 13 NORTH AMERICA TO HOLD THE HIGHEST MARKET SHARE IN THE GLOBAL MARKET IN 2020

4 PREMIUM INSIGHTS (Page No. - 45)
    4.1 ATTRACTIVE OPPORTUNITIES IN THE MARKET
        FIGURE 14 GROWTH TREND OF THE MARKET  (2020–2025)
    4.2 MARKET: MARKET SHARE OF APPLICATIONS, 2020
        FIGURE 15 REMOTE OFFICE AND BRANCH OFFICE SEGMENT TO HOLD THE HIGHEST MARKET SHARE IN 2020
    4.3 MARKET INVESTMENT SCENARIO
        FIGURE 16 ASIA PACIFIC TO EMERGE AS THE BEST MARKET FOR INVESTMENTS IN THE NEXT FIVE YEARS
    4.4 MICRO MOBILE DATA CENTER MARKET: MARKET SHARE OF VERTICALS, 2020
        FIGURE 17 BANKING, FINANCIAL SERVICES, AND INSURANCE SEGMENT TO GROW AT THE HIGHEST CAGR DURING THE FORECAST PERIOD

5 MARKET OVERVIEW AND INDUSTRY TRENDS (Page No. - 48)
    5.1 INTRODUCTION
    5.2 MARKET DYNAMICS
        FIGURE 18 MICRO MOBILE DATA CENTER MARKET: DRIVERS, RESTRAINTS, OPPORTUNITIES, AND CHALLENGES
           5.2.1 DRIVERS
                    5.2.1.1 Increasing demand for rugged data centers
                    5.2.1.2 Growing demand for plug-and-play data centers
                    5.2.1.3 Rising number of branch office automation
           5.2.2 RESTRAINTS
                    5.2.2.1 Lack of customized solutions in micro mobile data center deployments
                    5.2.2.2 Vendor lock-ins limit customer purchase options
           5.2.3 OPPORTUNITIES
                    5.2.3.1 Opportunities in the deployment of edge computing applications
           5.2.4 CHALLENGES
                    5.2.4.1 Limited cooling options
                            TABLE 4 AMERICAN SOCIETY OF HEATING, REFRIGERATION, AND AIR CONDITIONING ENGINEERS THERMAL GUIDELINES VALUES
                    5.2.4.2 Security and management issues of micro mobile data centers
                    5.2.4.3 Integration with traditional data centers
    5.3 CUMULATIVE GROWTH ANALYSIS
        TABLE 5 COVID-19 ANALYSIS
    5.4 AVERAGE SELLING PRICE
    5.5 VALUE CHAIN ANALYSIS
        FIGURE 19 MICRO MOBILE DATA CENTER MARKET: VALUE CHAIN ANALYSIS
    5.6 ECOSYSTEM
        FIGURE 20 MARKET: ECOSYSTEM
    5.7 TECHNOLOGY ANALYSIS
           5.7.1 TECHNOLOGIES IN MONITORING
                    5.7.1.1 Data center infrastructure management
                    5.7.1.2 Biometric security and surveillance
           5.7.2 TECHNOLOGIES IN COOLING AND THERMAL MANAGEMENT
                    5.7.2.1 In-rack cooling
                    5.7.2.2 Air cooling
                    5.7.2.3 Liquid cooling
                               5.7.2.3.1 Direct-to-chip liquid cooling
                               5.7.2.3.2 Immersive liquid cooling
                    5.7.2.4 Fire suppression
    5.8 INDUSTRY STANDARDS
           5.8.1 INTERNATIONAL ORGANIZATION FOR STANDARDIZATION
           5.8.2 THE EUROPEAN STANDARD
           5.8.3 UPTIME INSTITUTE
           5.8.4 ENERGY STAR CERTIFIED PRODUCTS
           5.8.5 NATIONAL ELECTRICAL MANUFACTURERS ASSOCIATION
           5.8.6 CANADIAN STANDARDS ASSOCIATION GROUP
           5.8.7 TELECOMMUNICATION INDUSTRY ASSOCIATION
           5.8.8 ELECTRONIC INDUSTRY ALLIANCE
           5.8.9 LEADERSHIP IN ENERGY AND ENVIRONMENTAL DESIGN
    5.9 CASE STUDY ANALYSIS
           5.9.1 USE CASE 1: TRANSPORTATION
           5.9.2 USE CASE 2: RETAIL
           5.9.3 USE CASE 3: INFORMATION TECHNOLOGY
           5.9.4 USE CASE 4: MINING
           5.9.5 USE CASE 5: HEALTHCARE
    5.10 PATENT ANALYSIS

6 MICRO MOBILE DATA CENTER MARKET ANALYSIS, BY APPLICATION (Page No. - 62)
    6.1 INTRODUCTION
           6.1.1 APPLICATION: MARKET DRIVERS
           6.1.2 APPLICATION: COVID-19 IMPACT
                 FIGURE 21 EDGE COMPUTING APPLICATION TO RECORD THE HIGHEST GROWTH DURING THE FORECAST PERIOD
                 TABLE 6 MARKET SIZE, BY APPLICATION, 2016-2019 (USD MILLION)
                 TABLE 7 MARKET SIZE, BY APPLICATION, 2020-2025 (USD MILLION)
    6.2 INSTANT DATA CENTER
        TABLE 8 INSTANT DATA CENTER: MARKET SIZE, BY REGION 2016–2019 (USD MILLION)
        TABLE 9 INSTANT DATA CENTER: MARKET SIZE, BY REGION, 2020–2025 (USD MILLION)
    6.3 REMOTE OFFICE AND BRANCH OFFICE
        TABLE 10 REMOTE OFFICE AND BRANCH OFFICE SUPPORT: MICRO MOBILE DATA CENTER MARKET SIZE, BY REGION 2016–2019 (USD MILLION)
        TABLE 11 REMOTE OFFICE AND BRANCH OFFICE SUPPORT, MARKET SIZE, BY REGION, 2020–2025 (USD MILLION)
    6.4 EDGE COMPUTING
        TABLE 12 EDGE COMPUTING: MARKET, BY REGION 2016–2019 (USD MILLION)
        TABLE 13 EDGE COMPUTING: MARKET SIZE, BY REGION, 2020–2025 (USD MILLION)

7 MICRO MOBILE DATA CENTER MARKET ANALYSIS, BY RACK UNIT (Page No. - 68)
    7.1 INTRODUCTION
           7.1.1 RACK UNIT: MARKET DRIVERS
           7.1.2 RACK UNIT: COVID-19 IMPACT
                 FIGURE 22 ABOVE 40 RU SEGMENT TO RECORD THE HIGHEST GROWTH DURING THE FORECAST PERIOD
                 TABLE 14 MARKET SIZE, BY RU, 2016–2019 (USD MILLION)
                 TABLE 15 MARKET SIZE, BY RU, 2020–2025 (USD MILLION)
    7.2 UP TO 20 RU
        TABLE 16 UP TO 20 RU: MARKET SIZE, BY REGION 2016–2019 (USD MILLION)
        TABLE 17 UP TO 20 RU: MARKET SIZE, BY REGION, 2020-2025 (USD MILLION)
    7.3 20–40 RU
        TABLE 18 20-40 RU: MARKET SIZE, BY REGION 2016–2019 (USD MILLION)
        TABLE 19 20-40 RU: MARKET SIZE, BY REGION, 2020-2025 (USD MILLION)
    7.4 ABOVE 40 RU
        TABLE 20 ABOVE 40 RU: MARKET SIZE, BY REGION 2016–2019 (USD MILLION)
        TABLE 21 ABOVE 40 RU: MARKET SIZE, BY REGION, 2020-2025 (USD MILLION)

8 MICRO MOBILE DATA CENTER MARKET ANALYSIS, BY ORGANIZATION SIZE (Page No. - 74)
    8.1 INTRODUCTION
           8.1.1 ORGANIZATION SIZE: MARKET DRIVERS
           8.1.2 ORGANIZATION SIZE: COVID-19 IMPACT
                 FIGURE 23 SMALL AND MEDIUM-SIZED ENTERPRISES SEGMENT TO RECORD A HIGHER GROWTH RATE DURING THE FORECAST PERIOD
                 TABLE 22 MARKET SIZE, BY ORGANIZATION SIZE, 2016–2019 (USD MILLION)
                 TABLE 23 MARKET SIZE, BY ORGANIZATION SIZE, 2020–2025 (USD MILLION)
    8.2 SMALL AND MEDIUM-SIZED ENTERPRISES
        TABLE 24 SMALL AND MEDIUM-SIZED ENTERPRISES: MARKET SIZE, BY REGION 2016–2019 (USD MILLION)
        TABLE 25 SMALL AND MEDIUM-SIZED ENTERPRISES: MARKET SIZE, BY REGION, 2020–2025 (USD MILLION)
    8.3 LARGE ENTERPRISES
        TABLE 26 LARGE ENTERPRISES: MARKET SIZE, BY REGION 2016–2019 (USD MILLION)
        TABLE 27 LARGE ENTERPRISES: MARKET SIZE, BY REGION, 2020–2025 (USD MILLION)

9 MICRO MOBILE DATA CENTER MARKET ANALYSIS, BY VERTICAL (Page No. - 79)
    9.1 INTRODUCTION
           9.1.1 VERTICAL: MARKET DRIVERS
           9.1.2 VERTICAL: COVID-19 IMPACT
                 FIGURE 24 MEDIA AND ENTERTAINMENT VERTICAL TO GROW AT THE HIGHEST RATE DURING THE FORECAST PERIOD
                 TABLE 28 MARKET SIZE, BY VERTICAL, 2016–2019 (USD MILLION)
                 TABLE 29 MARKET SIZE, BY VERTICAL, 2020–2025 (USD MILLION)
    9.2 BANKING, FINANCIAL SERVICES, AND INSURANCE
        TABLE 30 BANKING, FINANCIAL SERVICES, AND INSURANCE: MARKET, BY REGION 2016–2019 (USD MILLION)
        TABLE 31 BANKING, FINANCIAL SERVICES, AND INSURANCE: MARKET SIZE, BY REGION, 2020–2025 (USD MILLION)
    9.3 IT AND TELECOM
        TABLE 32 IT AND TELECOM: MICRO MOBILE DATA CENTER MARKET, BY REGION 2016–2019 (USD MILLION)
        TABLE 33 IT AND TELECOM: MARKET SIZE, BY REGION, 2020–2025 (USD MILLION)
    9.4 GOVERNMENT AND DEFENSE
        TABLE 34 GOVERNMENT AND DEFENSE: MARKET, BY REGION 2016–2019 (USD MILLION)
        TABLE 35 GOVERNMENT AND DEFENSE: MARKET SIZE, BY REGION, 2020–2025 (USD MILLION)
    9.5 MEDIA AND ENTERTAINMENT
        TABLE 36 MEDIA AND ENTERTAINMENT: MARKET, BY REGION 2016–2019 (USD MILLION)
        TABLE 37 MEDIA AND ENTERTAINMENT: MARKET SIZE, BY REGION, 2020–2025 (USD MILLION)
    9.6 HEALTHCARE
        TABLE 38 HEALTHCARE: MARKET SIZE, BY REGION 2016–2019 (USD MILLION)
        TABLE 39 HEALTHCARE: MARKET SIZE, BY REGION, 2020–2025 (USD MILLION)
    9.7 RETAIL
        TABLE 40 RETAIL: MICRO MOBILE DATA CENTER MARKET SIZE, BY REGION 2016–2019 (USD MILLION)
        TABLE 41 RETAIL: MARKET SIZE, BY REGION, 2020–2025 (USD MILLION)
    9.8 MANUFACTURING
        TABLE 42 MANUFACTURING: MARKET SIZE, BY REGION 2016–2019 (USD MILLION)
        TABLE 43 MANUFACTURING: MARKET SIZE, BY REGION, 2020–2025 (USD MILLION)
    9.9 OTHER VERTICALS
        TABLE 44 OTHER VERTICALS: MARKET SIZE, BY REGION 2016–2019 (USD MILLION)
        TABLE 45 OTHER VERTICALS: MARKET SIZE, BY REGION, 2020–2025 (USD MILLION)

10 MICRO MOBILE DATA CENTER MARKET ANALYSIS, BY REGION (Page No. - 91)
     10.1 INTRODUCTION
          FIGURE 25 NORTH AMERICA TO HOLD THE HIGHEST MARKET SHARE IN 2025
          TABLE 46 MARKET SIZE, BY REGION, 2016–2019 (USD MILLION)
          TABLE 47 MARKET SIZE, BY REGION, 2020–2025 (USD MILLION)
     10.2 NORTH AMERICA
             10.2.1 NORTH AMERICA: MARKET DRIVERS
             10.2.2 NORTH AMERICA: COVID-19 IMPACT
             10.2.3 NORTH AMERICA: REGULATIONS
                    FIGURE 26 NORTH AMERICA: MICRO MOBILE DATA CENTER MARKET SNAPSHOT
                    TABLE 48 NORTH AMERICA: MARKET SIZE, BY APPLICATION, 2016–2019 (USD MILLION)
                    TABLE 49 NORTH AMERICA: MARKET SIZE, BY APPLICATION, 2020-2025 (USD MILLION)
                    TABLE 50 NORTH AMERICA: MARKET SIZE, BY RU, 2016–2019 (USD MILLION)
                    TABLE 51 NORTH AMERICA: MARKET SIZE, BY RU, 2020-2025 (USD MILLION)
                    TABLE 52 NORTH AMERICA: MARKET SIZE, BY ORGANIZATION SIZE, 2016–2019 (USD MILLION)
                    TABLE 53 NORTH AMERICA: MARKET SIZE, BY ORGANIZATION SIZE, 2020-2025 (USD MILLION)
                    TABLE 54 NORTH AMERICA: MARKET SIZE, BY VERTICAL, 2016-2019 (USD MILLION)
                    TABLE 55 NORTH AMERICA: MARKET SIZE, BY VERTICAL, 2020-2025 (USD MILLION)
                    TABLE 56 NORTH AMERICA: MARKET SIZE, BY COUNTRY, 2016–2019 (USD MILLION)
                    TABLE 57 NORTH AMERICA: MARKET SIZE, BY COUNTRY, 2020–2025 (USD MILLION)
             10.2.4 UNITED STATES
                    TABLE 58 UNITED STATES: MICRO MOBILE DATA CENTER MARKET SIZE, BY RU, 2016–2019 (USD MILLION)
                    TABLE 59 UNITED STATES: MARKET SIZE, BY RU, 2020-2025 (USD MILLION)
                    TABLE 60 UNITED STATES: MARKET SIZE, BY ORGANIZATION SIZE, 2016–2019 (USD MILLION)
                    TABLE 61 UNITED STATES: MARKET SIZE, BY ORGANIZATION SIZE, 2020-2025 (USD MILLION)
             10.2.5 CANADA
                    TABLE 62 CANADA: MARKET SIZE, BY RU, 2016–2019 (USD MILLION)
                    TABLE 63 CANADA: MARKET SIZE, BY RU,  2020-2025 (USD MILLION)
                    TABLE 64 CANADA: MARKET SIZE, BY ORGANIZATION SIZE, 2016–2019 (USD MILLION)
                    TABLE 65 CANADA: MARKET SIZE, BY ORGANIZATION SIZE, 2020-2025 (USD MILLION)
     10.3 EUROPE
             10.3.1 EUROPE: MARKET DRIVERS
             10.3.2 EUROPE: COVID-19 IMPACT
             10.3.3 EUROPE: REGULATIONS
                    TABLE 66 EUROPE: MICRO MOBILE DATA CENTER MARKET SIZE, BY APPLICATION, 2016–2019 (USD MILLION)
                    TABLE 67 EUROPE: MARKET SIZE, BY APPLICATION, 2020-2025 (USD MILLION)
                    TABLE 68 EUROPE: MARKET SIZE, BY RU, 2016–2019 (USD MILLION)
                    TABLE 69 EUROPE: MARKET SIZE, BY RU, 2020-2025 (USD MILLION)
                    TABLE 70 EUROPE: MARKET SIZE, BY ORGANIZATION SIZE, 2016–2019 (USD MILLION)
                    TABLE 71 EUROPE: MARKET SIZE, BY ORGANIZATION SIZE, 2020-2025 (USD MILLION)
                    TABLE 72 EUROPE: MARKET SIZE, BY VERTICAL, 2016-2019 (USD MILLION)
                    TABLE 73 EUROPE: MARKET SIZE, BY VERTICAL, 2020-2025 (USD MILLION)
                    TABLE 74 EUROPE: MARKET SIZE, BY COUNTRY, 2016–2019 (USD MILLION)
                    TABLE 75 EUROPE: MARKET SIZE, BY COUNTRY, 2020–2025 (USD MILLION)
             10.3.4 UNITED KINGDOM
                    TABLE 76 UNITED KINGDOM: MICRO MOBILE DATA CENTER MARKET SIZE, BY RU, 2016–2019 (USD MILLION)
                    TABLE 77 UNITED KINGDOM: MARKET SIZE, BY RU, 2020-2025 (USD MILLION)
                    TABLE 78 UNITED KINGDOM: MARKET SIZE,  BY ORGANIZATION SIZE, 2016–2019 (USD MILLION)
                    TABLE 79 UNITED KINGDOM: MARKET SIZE, BY ORGANIZATION SIZE, 2020-2025 (USD MILLION)
             10.3.5 GERMANY
                    TABLE 80 GERMANY: MARKET SIZE, BY RU, 2016–2019 (USD MILLION)
                    TABLE 81 GERMANY: MARKET SIZE, BY RU, 2020-2025 (USD MILLION)
                    TABLE 82 GERMANY: MARKET SIZE, BY ORGANIZATION SIZE, 2016–2019 (USD MILLION)
                    TABLE 83 GERMANY: MARKET SIZE, BY ORGANIZATION SIZE, 2020-2025 (USD MILLION)
             10.3.6 FRANCE
                    TABLE 84 FRANCE: MICRO MOBILE DATA CENTER MARKET SIZE, BY RU, 2016–2019 (USD MILLION)
                    TABLE 85 FRANCE: MARKET SIZE, BY RU, 2020-2025 (USD MILLION)
                    TABLE 86 FRANCE: MARKET SIZE, BY ORGANIZATION SIZE, 2016–2019 (USD MILLION)
                    TABLE 87 FRANCE: MARKET SIZE, BY ORGANIZATION SIZE, 2020-2025 (USD MILLION)
             10.3.7 REST OF EUROPE
                    TABLE 88 REST OF EUROPE: MARKET SIZE, BY RU, 2016–2019 (USD MILLION)
                    TABLE 89 REST OF EUROPE: MARKET SIZE, BY RU, 2020-2025 (USD MILLION)
                    TABLE 90 REST OF EUROPE: MARKET SIZE, BY ORGANIZATION SIZE, 2016–2019 (USD MILLION)
                    TABLE 91 REST OF EUROPE: MARKET SIZE, BY ORGANIZATION SIZE, 2020-2025 (USD MILLION)
     10.4 ASIA PACIFIC
             10.4.1 ASIA PACIFIC: MICRO MOBILE DATA CENTER MARKET DRIVERS
             10.4.2 ASIA PACIFIC: COVID-19 IMPACT
             10.4.3 ASIA PACIFIC: REGULATIONS
                    FIGURE 27 ASIA PACIFIC: MICRO MOBILE DATA CENTER MARKET SNAPSHOT
                    TABLE 92 ASIA PACIFIC: MARKET SIZE, BY APPLICATION, 2016–2019 (USD MILLION)
                    TABLE 93 ASIA PACIFIC: MARKET SIZE, BY APPLICATION, 2020-2025 (USD MILLION)
                    TABLE 94 ASIA PACIFIC: MARKET SIZE, BY RU, 2016–2019 (USD MILLION)
                    TABLE 95 ASIA PACIFIC: MARKET SIZE, BY RU, 2020-2025 (USD MILLION)
                    TABLE 96 ASIA PACIFIC: MARKET SIZE, BY ORGANIZATION SIZE, 2016–2019 (USD MILLION)
                    TABLE 97 ASIA PACIFIC: MARKET SIZE, BY ORGANIZATION SIZE, 2020-2025 (USD MILLION)
                    TABLE 98 ASIA PACIFIC: MARKET SIZE, BY VERTICALS, 2016-2019 (USD MILLION)
                    TABLE 99 ASIA PACIFIC: MARKET SIZE, BY VERTICAL, 2020-2025 (USD MILLION)
                    TABLE 100 ASIA PACIFIC: MARKET SIZE, BY COUNTRY, 2016–2019 (USD MILLION)
                    TABLE 101 ASIA PACIFIC: MARKET SIZE, BY COUNTRY, 2020–2025 (USD MILLION)
             10.4.4 AUSTRALIA AND NEW ZEALAND
                    TABLE 102 AUSTRALIA AND NEW ZEALAND: MICRO MOBILE DATA CENTER MARKET SIZE, BY RU, 2016–2019 (USD MILLION)
                    TABLE 103 AUSTRALIA AND NEW ZEALAND: MARKET SIZE, BY RU, 2020-2025 (USD MILLION)
                    TABLE 104 AUSTRALIA AND NEW ZEALAND: MARKET SIZE, BY ORGANIZATION SIZE, 2016–2019 (USD MILLION)
                    TABLE 105 AUSTRALIA AND NEW ZEALAND: MARKET SIZE, BY ORGANIZATION SIZE, 2020-2025 (USD MILLION)
             10.4.5 CHINA
                    TABLE 106 CHINA: MARKET SIZE, BY RU, 2016–2019 (USD MILLION)
                    TABLE 107 CHINA: MARKET SIZE, BY RU, 2020-2025 (USD MILLION)
                    TABLE 108 CHINA: MARKET SIZE, BY ORGANIZATION SIZE, 2016–2019 (USD MILLION)
                    TABLE 109 CHINA: MARKET SIZE, BY ORGANIZATION SIZE, 2020-2025 (USD MILLION)
             10.4.6 JAPAN
                    TABLE 110 JAPAN: MICRO MOBILE DATA CENTER MARKET SIZE, BY RU, 2016–2019 (USD MILLION)
                    TABLE 111 JAPAN: MARKET SIZE, BY RU, 2020-2025 (USD MILLION)
                    TABLE 112 JAPAN: MARKET SIZE, BY ORGANIZATION SIZE, 2016–2019 (USD MILLION)
                    TABLE 113 JAPAN: MARKET SIZE, BY ORGANIZATION SIZE, 2020-2025 (USD MILLION)
             10.4.7 REST OF ASIA PACIFIC
                    TABLE 114 REST OF ASIA PACIFIC: MARKET SIZE, BY RU, 2016–2019 (USD MILLION)
                    TABLE 115 REST OF ASIA PACIFIC: MARKET SIZE, BY RU, 2020-2025 (USD MILLION)
                    TABLE 116 REST OF ASIA PACIFIC: MARKET SIZE, BY ORGANIZATION SIZE, 2016–2019 (USD MILLION)
                    TABLE 117 REST OF ASIA PACIFIC: MARKET SIZE, BY ORGANIZATION SIZE, 2020-2025 (USD MILLION)
     10.5 MIDDLE EAST AND AFRICA
             10.5.1 MIDDLE EAST AND AFRICA: MARKET DRIVERS
             10.5.2 MIDDLE EAST AND AFRICA: COVID-19 IMPACT
             10.5.3 MIDDLE EAST AND AFRICA: REGULATIONS
                    TABLE 118 MIDDLE EAST AND AFRICA: MICRO MOBILE DATA CENTER MARKET SIZE, BY APPLICATION, 2016–2019 (USD MILLION)
                    TABLE 119 MIDDLE EAST AND AFRICA: MARKET SIZE, BY APPLICATION, 2020-2025 (USD MILLION)
                    TABLE 120 MIDDLE EAST AND AFRICA: MARKET SIZE, BY RU, 2016–2019 (USD MILLION)
                    TABLE 121 MIDDLE EAST AND AFRICA: MARKET SIZE, BY RU, 2020-2025 (USD MILLION)
                    TABLE 122 MIDDLE EAST AND AFRICA: MARKET SIZE, BY ORGANIZATION SIZE, 2016–2019 (USD MILLION)
                    TABLE 123 MIDDLE EAST AND AFRICA: MARKET SIZE, BY ORGANIZATION SIZE, 2020-2025 (USD MILLION)
                    TABLE 124 MIDDLE EAST AND AFRICA: MARKET SIZE, BY VERTICAL, 2016-2019 (USD MILLION)
                    TABLE 125 MIDDLE EAST AND AFRICA: MARKET SIZE, BY VERTICAL, 2020-2025 (USD MILLION)
                    TABLE 126 MIDDLE EAST AND AFRICA: MARKET SIZE, BY COUNTRY, 2016–2019 (USD MILLION)
                    TABLE 127 MIDDLE EAST AND AFRICA: MARKET SIZE, BY COUNTRY, 2020–2025 (USD MILLION)
             10.5.4 KINGDOM OF SAUDI ARABIA
                    TABLE 128 KINGDOM OF SAUDI ARABIA: MICRO MOBILE DATA CENTER MARKET SIZE, BY RU, 2016–2019 (USD MILLION)
                    TABLE 129 KINGDOM OF SAUDI ARABIA: MARKET SIZE, BY RU, 2020-2025 (USD MILLION)
                    TABLE 130 KINGDOM OF SAUDI ARABIA: MARKET SIZE, BY ORGANIZATION SIZE, 2016–2019 (USD MILLION)
                    TABLE 131 KINGDOM OF SAUDI ARABIA: MARKET SIZE, BY ORGANIZATION SIZE, 2020-2025 (USD MILLION)
             10.5.5 UNITED ARAB EMIRATES
                    TABLE 132 UNITED ARAB EMIRATES: MARKET SIZE, BY RU, 2016–2019 (USD MILLION)
                    TABLE 133 UNITED ARAB EMIRATES: MARKET SIZE, BY RU, 2020-2025 (USD MILLION)
                    TABLE 134 UNITED ARAB EMIRATES: MARKET SIZE, BY ORGANIZATION SIZE, 2016–2019 (USD MILLION)
                    TABLE 135 UNITED ARAB EMIRATES: MARKET SIZE,  BY ORGANIZATION SIZE, 2020-2025 (USD MILLION)
             10.5.6 SOUTH AFRICA
                    TABLE 136 SOUTH AFRICA: MICRO MOBILE DATA CENTER MARKET SIZE, BY RU, 2016–2019 (USD MILLION)
                    TABLE 137 SOUTH AFRICA: MARKET SIZE, BY RU, 2020-2025 (USD MILLION)
                    TABLE 138 SOUTH AFRICA: MARKET SIZE, BY ORGANIZATION SIZE, 2016–2019 (USD MILLION)
                    TABLE 139 SOUTH AFRICA: MARKET SIZE, BY ORGANIZATION SIZE, 2020-2025 (USD MILLION)
             10.5.7 REST OF MIDDLE EAST AND AFRICA
                    TABLE 140 REST OF MIDDLE EAST AND AFRICA: MARKET SIZE, BY RU, 2016–2019 (USD MILLION)
                    TABLE 141 REST OF MIDDLE EAST AND AFRICA: MARKET SIZE, BY RU, 2020-2025 (USD MILLION)
                    TABLE 142 REST OF MIDDLE EAST AND AFRICA: MARKET SIZE, BY ORGANIZATION SIZE, 2016–2019 (USD MILLION)
                    TABLE 143 REST OF MIDDLE EAST AND AFRICA: MARKET SIZE, BY ORGANIZATION SIZE, 2020-2025 (USD MILLION)
     10.6 LATIN AMERICA
             10.6.1 LATIN AMERICA: MARKET DRIVERS
             10.6.2 LATIN AMERICA: COVID-19 IMPACT
             10.6.3 LATIN AMERICA: REGULATIONS
                    TABLE 144 LATIN AMERICA: MICRO MOBILE DATA CENTER MARKET SIZE, BY APPLICATION, 2016–2019 (USD MILLION)
                    TABLE 145 LATIN AMERICA: MARKET SIZE, BY APPLICATION, 2020-2025 (USD MILLION)
                    TABLE 146 LATIN AMERICA: MARKET SIZE, BY RU, 2016–2019 (USD MILLION)
                    TABLE 147 LATIN AMERICA: MARKET SIZE, BY RU, 2020-2025 (USD MILLION)
                    TABLE 148 LATIN AMERICA: MARKET SIZE,  BY ORGANIZATION SIZE, 2016–2019 (USD MILLION)
                    TABLE 149 LATIN AMERICA: MARKET SIZE, BY ORGANIZATION SIZE, 2020-2025 (USD MILLION)
                    TABLE 150 LATIN AMERICA: MARKET SIZE, BY VERTICAL, 2016-2019 (USD MILLION)
                    TABLE 151 LATIN AMERICA: MARKET SIZE, BY VERTICAL, 2020-2025 (USD MILLION)
                    TABLE 152 LATIN AMERICA: MARKET SIZE, BY COUNTRY, 2016–2019 (USD MILLION)
                    TABLE 153 LATIN AMERICA: MARKET SIZE, BY COUNTRY, 2020–2025 (USD MILLION)
             10.6.4 BRAZIL
                    TABLE 154 BRAZIL: MICRO MOBILE DATA CENTER MARKET SIZE, BY RU,  2016–2019 (USD MILLION)
                    TABLE 155 BRAZIL: MARKET SIZE, BY RU, 2020-2025 (USD MILLION)
                    TABLE 156 BRAZIL: MARKET SIZE, BY ORGANIZATION SIZE, 2016–2019 (USD MILLION)
                    TABLE 157 BRAZIL: MARKET SIZE, BY ORGANIZATION SIZE, 2020-2025 (USD MILLION)
             10.6.5 MEXICO
                    TABLE 158 MEXICO: MARKET SIZE, BY RU, 2016–2019 (USD MILLION)
                    TABLE 159 MEXICO: MARKET SIZE, BY RU, 2020-2025 (USD MILLION)
                    TABLE 160 MEXICO: MARKET SIZE, BY ORGANIZATION SIZE, 2016–2019 (USD MILLION)
                    TABLE 161 MEXICO: MARKET SIZE, BY ORGANIZATION SIZE, 2020-2025 (USD MILLION)
             10.6.6 REST OF LATIN AMERICA
                    TABLE 162 REST OF LATIN AMERICA: MICRO MOBILE DATA CENTER MARKET SIZE, BY RU, 2016–2019 (USD MILLION)
                    TABLE 163 REST OF LATIN AMERICA: MARKET SIZE,  BY RU, 2020-2025 (USD MILLION)
                    TABLE 164 REST OF LATIN AMERICA: MARKET SIZE, BY ORGANIZATION SIZE, 2016–2019 (USD MILLION)
                    TABLE 165 REST OF LATIN AMERICA: MARKET SIZE, BY ORGANIZATION SIZE, 2020-2025 (USD MILLION)

11 COMPETITIVE LANDSCAPE (Page No. - 138)
     11.1 OVERVIEW
     11.2 MARKET EVALUATION FRAMEWORK
          FIGURE 28 MARKET EVALUATION FRAMEWORK
     11.3 MARKET SHARE OF TOP PLAYERS
          FIGURE 29 MARKET SHARE OF MAJOR PLAYERS IN MICRO MOBILE DATA CENTER MARKET, 2019
     11.4 REVENUE ANALYSIS OF TOP PLAYERS
          FIGURE 30 TOP FIVE PLAYERS DOMINATING THE MARKET IN LAST FIVE YEARS
     11.5 KEY MARKET DEVELOPMENTS
             11.5.1 NEW PRODUCT/SOLUTION LAUNCHES AND ENHANCEMENTS
                    TABLE 166 NEW PRODUCT/SOLUTION LAUNCHES AND ENHANCEMENTS, 2019–2020
             11.5.2 ACQUISITIONS
                    TABLE 167 ACQUISITIONS, 2019–2020
             11.5.3 PARTNERSHIPS, AGREEMENTS, AND COLLABORATIONS
                    TABLE 168 PARTNERSHIPS, AGREEMENTS, AND COLLABORATIONS, 2019-2020

12 COMPANY EVALUATION MATRIX AND COMPANY PROFILES (Page No. - 142)
     12.1 INTRODUCTION
     12.2 COMPANY EVALUATION MATRIX DEFINITIONS AND METHODOLOGY
          TABLE 169 COMPANY EVALUATION MATRIX: CRITERIA WEIGHTAGE
             12.2.1 STARS
             12.2.2 EMERGING LEADERS
             12.2.3 PERVASIVE
             12.2.4 OTHERS
     12.3 MICRO MOBILE DATA CENTER COMPANY EVALUATION MATRIX, 2019
             12.3.1 MICRO MOBILE DATA CENTER COMPANY EVALUATION MATRIX OVERVIEW
                    FIGURE 31 MICRO MOBILE DATA CENTER (GLOBAL): COMPANY EVALUATION MATRIX, 2019
     12.4 COMPANY PROFILES
             12.4.1 INTRODUCTION
(Business Overview, Solutions, Products & Services, Key Insights, Recent Developments, SWOT Analysis, MnM View)*
             12.4.2 SCHNEIDER ELECTRIC
                    FIGURE 32 SCHNEIDER ELECTRIC: COMPANY SNAPSHOT
             12.4.3 HPE
                    FIGURE 33 HPE: COMPANY SNAPSHOT
             12.4.4 DELL TECHNOLOGIES
                    FIGURE 34 DELL TECHNOLOGIES: COMPANY SNAPSHOT
             12.4.5 VERTIV
                    FIGURE 35 VERTIV: COMPANY SNAPSHOT
             12.4.6 EATON
                    FIGURE 36 EATON: COMPANY SNAPSHOT
             12.4.7 HUAWEI
                    FIGURE 37 HUAWEI: COMPANY SNAPSHOT
             12.4.8 IBM
                    FIGURE 38 IBM: COMPANY SNAPSHOT
             12.4.9 RITTAL
             12.4.10 PANDUIT
             12.4.11 STULZ
             12.4.12 DELTA ELECTRONICS
             12.4.13 ZELLA DC
             12.4.14 SCALEMATRIX
             12.4.15 CANOVATE
             12.4.16 DATARACKS
             12.4.17 ALTRON
             12.4.18 CANNON TECHNOLOGIES
             12.4.19 KSTAR
             12.4.20 SICON
             12.4.21 HANLEY ENERGY
*Details on Business Overview, Solutions, Products & Services, Key Insights, Recent Developments, SWOT Analysis, MnM View might not be captured in case of unlisted companies.
     12.5 STARTUP EVALUATION MATRIX METHODOLOGY AND DEFINITIONS
          TABLE 170 STARTUP COMPANY EVALUATION MATRIX: CRITERIA WEIGHTAGE
             12.5.1 PROGRESSIVE COMPANIES
             12.5.2 RESPONSIVE COMPANIES
             12.5.3 DYNAMIC COMPANIES
             12.5.4 STARTING BLOCKS
                    FIGURE 39 MICRO MOBILE DATA CENTER (STARTUP): MPANY EVALUATION MATRIX, 2019
     12.6 STARTUP PROFILES
             12.6.1 AXELLIO
             12.6.2 EDGEMICRO
             12.6.3 METROEDGE
             12.6.4 VAPOR IO
             12.6.5 EDGEPRESENCE

13 ADJACENT MARKET (Page No. - 186)
     13.1 INTRODUCTION
             13.1.1 RELATED MARKETS
                    TABLE 171 RELATED MARKETS
     13.2 LIMITATIONS
     13.3 MODULAR DATA CENTER MARKET
             13.3.1 INTRODUCTION
             13.3.2 MARKET OVERVIEW
             13.3.3 GLOBAL MODULAR DATA CENTER, BY COMPONENT
                    TABLE 172 GLOBAL MODULAR DATA CENTER MARKET SIZE, BY COMPONENT, 2015–2022 (USD BILLION)
             13.3.4 FUNCTIONAL MODULE SOLUTIONS
                    TABLE 173 MODULAR DATA CENTER MARKET SIZE, BY FUNCTIONAL MODULE SOLUTION, 2015–2022 (USD BILLION)
                        13.3.4.1 All-in-one functional module
                                 TABLE 174 ALL-IN-ONE FUNCTIONAL MODULE MARKET SIZE, BY REGION, 2015–2022 (USD BILLION)
                        13.3.4.2 Individual functional module
                                 TABLE 175 INDIVIDUAL FUNCTIONAL MODULE MARKET SIZE, BY REGION, 2015–2022 (USD BILLION)
                                 TABLE 176 INDIVIDUAL FUNCTIONAL MODULE MARKET SIZE, BY TYPE, 2015–2022 (USD BILLION)
                                     13.3.4.2.1 IT module
                                                TABLE 177 IT MODULE MARKET SIZE, BY REGION, 2015–2022 (USD BILLION)
                                     13.3.4.2.2 Electrical module
                                                TABLE 178 ELECTRICAL MODULE MARKET SIZE, BY REGION, 2015–2022 (USD BILLION)
                                     13.3.4.2.3 Mechanical module
                                                TABLE 179 MECHANICAL MODULE MARKET SIZE, BY REGION, 2015–2022 (USD BILLION)
             13.3.5 SERVICES
                    TABLE 180 MODULAR DATA CENTER MARKET SIZE, BY SERVICE, 2015–2022 (USD BILLION)
                        13.3.5.1 Consulting
                                 TABLE 181 CONSULTING MARKET SIZE, BY REGION, 2015–2022 (USD BILLION)
                        13.3.5.2 Integration and deployment
                                 TABLE 182 INTEGRATION AND DEPLOYMENT MARKET SIZE, BY REGION, 2015–2022 (USD BILLION)
                        13.3.5.3 Infrastructure management
                                 TABLE 183 INFRASTRUCTURE MANAGEMENT MARKET SIZE, BY REGION, 2015–2022 (USD BILLION)
             13.3.6 GLOBAL MODULAR DATA CENTER MARKET, REGIONAL ANALYSIS
                    TABLE 184 GLOBAL MODULAR DATA CENTER MARKET SIZE, BY REGION, 2015–2022 (USD BILLION)
                    TABLE 185 NORTH AMERICA: MODULAR DATA CENTER MARKET SIZE, BY COMPONENT, 2015–2022 (USD BILLION)
                    TABLE 186 NORTH AMERICA: MODULAR DATA CENTER MARKET SIZE, BY FUNCTIONAL MODULE SOLUTION, 2015–2022 (USD BILLION)
                    TABLE 187 NORTH AMERICA: MODULAR DATA CENTER MARKET SIZE, BY INDIVIDUAL FUNCTIONAL MODULE, 2015–2022 (USD BILLION)
                    TABLE 188 NORTH AMERICA: MODULAR DATA CENTER MARKET SIZE, BY SERVICE, 2015–2022 (USD BILLION)
                    TABLE 189 NORTH AMERICA: MODULAR DATA CENTER MARKET SIZE, BY DATA CENTER SIZE, 2015–2022 (USD BILLION)
                    TABLE 190 NORTH AMERICA: MODULAR DATA CENTER MARKET SIZE, BY TIER TYPE, 2015–2022 (USD BILLION)
                    TABLE 191 NORTH AMERICA: MODULAR DATA CENTER MARKET SIZE, BY INDUSTRY, 2015–2022 (USD MILLION)
                        13.3.6.1 Europe
                                 TABLE 192 EUROPE: MODULAR DATA CENTER MARKET SIZE, BY COMPONENT, 2015–2022 (USD BILLION)
                                 TABLE 193 EUROPE: MODULAR DATA CENTER MARKET SIZE, BY FUNCTIONAL MODULE SOLUTION, 2015–2022 (USD BILLION)
                                 TABLE 194 EUROPE: MODULAR DATA CENTER MARKET SIZE, BY INDIVIDUAL FUNCTIONAL MODULE, 2015–2022 (USD BILLION)
                                 TABLE 195 EUROPE: MODULAR DATA CENTER MARKET SIZE, BY SERVICE, 2015–2022 (USD BILLION)
                                 TABLE 196 EUROPE: MODULAR DATA CENTER MARKET SIZE, BY DATA CENTER SIZE, 2015–2022 (USD BILLION)
                                 TABLE 197 EUROPE: MODULAR DATA CENTER MARKET SIZE, BY TIER TYPE, 2015–2022 (USD BILLION)
                                 TABLE 198 EUROPE: MODULAR DATA CENTER MARKET SIZE, BY INDUSTRY, 2015–2022 (USD MILLION)
                        13.3.6.2 APAC
                                 TABLE 199 APAC: MODULAR DATA CENTER MARKET SIZE, BY COMPONENT,  2015–2022 (USD BILLION)
                                 TABLE 200 APAC: MODULAR DATA CENTER MARKET SIZE, BY FUNCTIONAL MODULE SOLUTION, 2015–2022 (USD BILLION)
                                 TABLE 201 APAC: MODULAR DATA CENTER MARKET SIZE, BY INDIVIDUAL FUNCTIONAL MODULE, 2015–2022 (USD BILLION)
                                 TABLE 202 APAC: MODULAR DATA CENTER MARKET SIZE, BY SERVICE,  2015–2022 (USD BILLION)
                                 TABLE 203 APAC: MODULAR DATA CENTER MARKET SIZE, BY DATA CENTER SIZE, 2015–2022 (USD BILLION)
                                 TABLE 204 APAC: MODULAR DATA CENTER MARKET SIZE, BY TIER TYPE, 2015–2022 (USD BILLION)
                                 TABLE 205 APAC: MODULAR DATA CENTER MARKET SIZE, BY INDUSTRY, 2015–2022 (USD MILLION)
                        13.3.6.3 Middle East and Africa
                                 TABLE 206 MEA: MODULAR DATA CENTER MARKET SIZE, BY COMPONENT, 2015–2022 (USD BILLION)
                                 TABLE 207 MEA: MODULAR DATA CENTER MARKET SIZE, BY FUNCTIONAL MODULE SOLUTION, 2015–2022 (USD BILLION)
                                 TABLE 208 MEA: MODULAR DATA CENTER MARKET SIZE, BY INDIVIDUAL FUNCTIONAL MODULE, 2015–2022 (USD BILLION)
                                 TABLE 209 MEA: MODULAR DATA CENTER MARKET SIZE, BY SERVICE, 2015–2022 (USD BILLION)
                                 TABLE 210 MEA: MODULAR DATA CENTER MARKET SIZE, BY DATA CENTER SIZE, 2015–2022 (USD BILLION)
                                 TABLE 211 MEA: MODULAR DATA CENTER MARKET SIZE, BY TIER TYPE, 2015–2022 (USD BILLION)
                                 TABLE 212 MEA: MODULAR DATA CENTER MARKET SIZE, BY INDUSTRY, 2015–2022 (USD MILLION)
                        13.3.6.4 Latin America
                                 TABLE 213 LATIN AMERICA: MODULAR DATA CENTER MARKET SIZE, BY COMPONENT, 2015–2022 (USD BILLION)
                                 TABLE 214 LATIN AMERICA: MODULAR DATA CENTER MARKET SIZE, BY FUNCTIONAL MODULE SOLUTION, 2015–2022 (USD BILLION)
                                 TABLE 215 LATIN AMERICA: MODULAR DATA CENTER MARKET SIZE, BY INDIVIDUAL FUNCTIONAL MODULE, 2015–2022 (USD BILLION)
                                 TABLE 216 LATIN AMERICA: MODULAR DATA CENTER MARKET SIZE, BY SERVICE, 2015–2022 (USD BILLION)
                                 TABLE 217 LATIN AMERICA: MODULAR DATA CENTER MARKET SIZE, BY DATA CENTER SIZE, 2015–2022 (USD BILLION)
                                 TABLE 218 LATIN AMERICA: MODULAR DATA CENTER MARKET SIZE, BY TIER TYPE, 2015–2022 (USD BILLION)
                                 TABLE 219 LATIN AMERICA: MODULAR DATA CENTER MARKET SIZE, BY INDUSTRY, 2015–2022 (USD MILLION)

14 APPENDIX (Page No. - 204)
     14.1 DISCUSSION GUIDE
     14.2 KNOWLEDGE STORE: MARKETSANDMARKETS’ SUBSCRIPTION PORTAL
     14.3 AVAILABLE CUSTOMIZATIONS
     14.4 AVAILABLE CUSTOMIZATIONS
     14.5 RELATED REPORT
     14.6 AUTHOR DETAILS

The study involved 4 major activities in estimating the current market size for micro mobile data center hardware, platform, and services. An exhaustive secondary research was done to collect information on the market, peer market, and parent market. The next step was to validate these findings, assumptions, and sizing with the industry experts across the value chain through primary research. Both top-down and bottom-up approaches were employed to estimate the complete market size. Thereafter, market breakup and data triangulation were used to estimate the market size of segments and subsegments.

Secondary Research

In the secondary research process, various secondary sources, such as Bloomberg and BusinessWeek have been referred for, to identify and collect information for this study. The secondary sources included annual reports, press releases, and investor presentations of companies; white papers; journals; and certified publications and articles from recognized authors, directories, and databases.

Primary Research

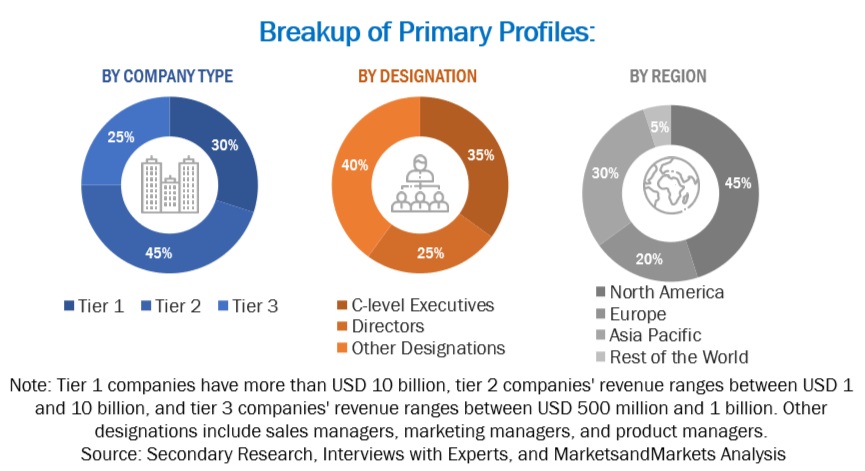
Various primary sources from both supply and demand sides were interviewed to obtain qualitative and quantitative information for this report. The primary sources from the supply side included industry experts, such as Chief Executive Officers (CEOs), Chief Marketing Officers (CMO), Chief Technology Officers (CTOs), Chief Operating Officers (COOs), Vice Presidents (VPs), Managing Directors (MDs), technology and innovation directors, and related key executives from various leading companies and organizations operating in the micro mobile data center market along with the associated service providers, and system integrators operating in the targeted regions. All possible parameters that affect the market covered in this research study have been accounted for, viewed in extensive detail, verified through primary research, and analyzed to get the final quantitative and qualitative data. Following is the breakup of primary respondents:

Micro Mobile Data Center Market Size, and Share

To know about the assumptions considered for the study, download the pdf brochure

Market Size Estimation

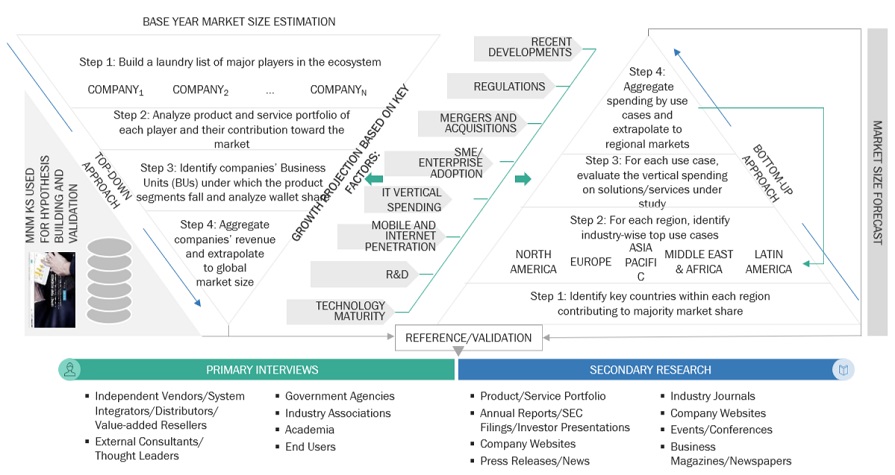
For making market estimates and forecasting the micro mobile data center market, and the other dependent submarkets, the top-down and bottom-up approaches were used. The bottom-up procedure was used to arrive at the overall market size of the global micro mobile data center market using key companies’ revenue and their offerings in the market. The research methodology used to estimate the market size includes the following:

  • The key players in the market have been identified through extensive secondary research.
  • The market size, in terms of value, has been determined through primary and secondary research processes.
  • All percentage shares, splits, and breakups have been determined using secondary sources and verified through primary sources.

Data Triangulation

With data triangulation and validation through primary interviews, the exact value of the overall parent market size was determined and confirmed using this study. The overall market size was then used in the top-down procedure to estimate the size of other individual markets via percentage splits of the market segmentation.

Report Objectives

  • To define, describe, and forecast the micro mobile data center market by component, application, organization size, vertical, and region
  • To provide detailed information about major factors (drivers, opportunities, restraints, and challenges) influencing the growth of the micro mobile data center market
  • To analyze micromarkets with respect to individual growth trends, prospects, and contributions to the overall market
  • To analyze opportunities in the market for stakeholders by identifying high-growth segments of the micro mobile data center market
  • To forecast the market size of the market segments with respect to 5 main regions, namely, North America, Europe, Asia Pacific (APAC), Middle East and Africa (MEA), and Latin America
  • To profile key players of the micro mobile data center market and comprehensively analyze their market size and core competencies in the market
  • To track and analyze the competitive developments, such as new product launches, product enhancements, acquisitions, partnerships, and collaborations in the global micro mobile data center market

Available Customizations

With the given market data, MarketsandMarkets offers customizations as per the company’s specific needs. The following customization options are available for the report:

Company Information

  • Detailed analysis and profiling of additional market players up to 5
Custom Market Research Services

We will customize the research for you, in case the report listed above does not meet with your exact requirements. Our custom research will comprehensively cover the business information you require to help you arrive at strategic and profitable business decisions.

Request Customization
Report Code
TC 2575
Published ON
Oct, 2020
Choose License Type
BUY NOW
  • SHARE
X
Request Customization
Speak to Analyst
Speak to Analyst
OR FACE-TO-FACE MEETING
PERSONALIZE THIS RESEARCH
  • Triangulate with your Own Data
  • Get Data as per your Format and Definition
  • Gain a Deeper Dive on a Specific Application, Geography, Customer or Competitor
  • Any level of Personalization
REQUEST A FREE CUSTOMIZATION
LET US HELP YOU!
  • What are the Known and Unknown Adjacencies Impacting the Micro Mobile Data Center Market
  • What will your New Revenue Sources be?
  • Who will be your Top Customer; what will make them switch?
  • Defend your Market Share or Win Competitors
  • Get a Scorecard for Target Partners
CUSTOMIZED WORKSHOP REQUEST
+1-888-600-6441
  • Call Us
  • +1-888-600-6441 (Corporate office hours)
  • +1-888-600-6441 (US/Can toll free)
  • +44-800-368-9399 (UK office hours)
CONNECT WITH US
ABOUT TRUST ONLINE
©2024 MarketsandMarkets Research Private Ltd. All rights reserved
DMCA.com Protection Status Website Feedback