Americas Gesture Recognition & Touchless Sensing Market (2013 - 2018) Technology (2D, 3D, Ultrasonic, IR, Capacitive); Product (Biometric, Sanitary); Application (Healthcare, Electronics, Automotive); Country (U.S., Canada, Mexico, Brazil, Argentina)


The touch-less sanitary equipment market covered under the report relates to the products based on the application of capacitive and infrared sensors for faucets, hand dryers, soap dispensers etc. to make it more hygienic and reduce wastage. The gesture recognition technology essentially facilitates the coherence of the human gestures like face, hand or body with the machine in contention to perform related tasks.
The Americas gesture recognition technology market is governed by the technologies like 2D camera based, 3D camera based, ultrasonic, infrared arrays, and capacitive technology. The touch-less biometric market has been segmented by the different types like face, iris, voice, and touch-less fingerprint biometrics. Similarly, the touch-less sanitary equipment is segmented by the major products like faucets, soap dispensers, trash cans, hand dryers, paper towel dispenser, and flushes.
This report describes the market evolution of touch-less sensing and gesture recognition technologies as well as the emerging trends for both gesture and touch-less sensing technologies. The touch-less multimodal biometrics in the automotive industry is expected to be a significant opportunity in the Americas touch-less biometric market. The report also provides detailed scrutiny of porters five force analysis for the Americas touch-less sanitary, touch-less biometrics and gesture recognition markets. All the five major factors in these markets have been quantified using internal key parameters governing each of them.
The major drivers for the Americas gesture recognition market are intensive efforts by OEMs for one-stop integration and a highly developed gaming and entertainment industry.Currently, consumer electronics application contributes more than 99% of the Americas gesture recognition market There is a lot of opportunity for existing players as well as for new entrants to innovate and differentiate the products in terms of price and high quality user interface. The Competitive landscape covers market share analysis, mergers and acquisitions, collaborations, partnerships, new product developments, and the key growth strategies of each player.
The Americas touch-less sensing and gesture recognition market is expected to create escalated demands owing to augmented applications; however a saturated consumer electronics industry is expected to inhibit the market growth as compared to other regions of the globe. The major players in the Americas gesture recognition market include Qualcomm (U.S.), Intel Corporation (U.S.), nVidia (U.S.), Texas Instruments (U.S.), Microchip Technologies (U.S.) among others.
Scope of the report
This research report categorizes the Americas touch-less sensing and gesture recognition market on the basis of different technologies, products, applications and geographical analysis; forecasting revenue and analyzing trends in the market.
On the basis of technology
The basic heads under this include 2D camera based technology, 3D vision technology, infrared technology, ultrasonic and electric near field array technology. The 3D vision technology is further categorized under stereoscopic, structured lighting, time-of-flight cameras and gesture cameras.
On the basis of verticals
The basic applications in the gesture recognition market inculcate consumer electronics, healthcare, automotive and retail. The consumer electronics vertical is further classified under smartphones, media tablets, smart TVs, set-top box and laptops. The touch-less sensing application market is categorized under travel, government, finance and banking, consumer electronics and healthcare.
On the basis of geography
- North America
- U.S.
- Canada
- Mexico
- South America
- Brazil
- Argentina
Each section will provide market data, market drivers, trends and opportunities, key players, and competitive outlook. This report also makes ways for market tables to cover the sub-segments and micro-markets. In addition, it profiles around 24 companies covering all the sub-segments such as overview, products & services, financials, strategy, and developments.
Customer Interested in this report also can view
-
Gesture Recognition & Touchless Sensing Market (2013 - 2018): By Technology (2D, 3D, Ultrasonic, IR, Capacitive); Product (Biometric, Sanitary Equipment); Application (Healthcare, Consumer Electronics, Automotive); Geography (Americas, EMEA, & APAC)
-
Europe Gesture Recognition & Touchless Sensing Market(2013 - 2018) Technology (2D, 3D, Ultrasonic, IR, Capacitive); Product (Biometric, Sanitary); Application (Healthcare, Electronics, Automotive); Region (Germany, U.K., France, Italy, MEA)
-
Asia-Pacific Gesture Recognition & Touchless Sensing Market (2013 - 2018): Technology (2D, 3D, Ultrasonic, IR, Capacitive); Product (Biometric, Sanitary); Application (Healthcare, Electronics, Automotive); Country (India, China, Japan, South Korea)
The Americas gestures are a pivotal tool for communicating in the real-time human communication. Taking cue from the above analogy, the gesture recognition technology takes it to a different level with machines or devices being inculcated as a point of communication rather than human identity. The touch-less sensing technology encompasses a bigger umbrella of products under sanitary equipment and biometric heads which are meant for high security and hygiene applications.
The report covers the Americas gesture recognition and touch-less sensing market on the basis of technology, products, application and geography. The technology section covers 2D, 3D, infrared array, electric near field and ultrasonic categories with their current and future adoption rates. The application section covers different verticals like consumer electronics, automotive, healthcare, retail, building and home automation. The geographical analysis covers U.S., Canada, Mexico, Brazil and Argentina.
The major drivers for the Americas touch-less sensing market are sophisticated ergonomics and spurt in travel, healthcare, and education verticals. Moreover, dedicated marketing concentrating on the defense market and minimal ombudsman in the value chain can help the OEMs to have a stronghold in the Americas touch-less biometric market. There is a lot of opportunity for existing players as well as for new entrants to innovate, thereby maintaining high performance and reliability in the gesture recognition market such as the mobile devices. The latency or the lag time is another issue where the developers are focused currently to improve its incorporation into several applications.
The major issue with the Americas biometric market is the dilemma among the OEMs to select the industry for partnerships. The issue with the Americas touch-less sanitary equipment industry is the availability of cheaper alternative products available in the market. The major companies involved in the Americas gesture recognition industry are Qualcomm (U.S.), Intel Corporation (U.S.), nVidia (U.S.), Texas Instruments (U.S.), Microchip Technologies (U.S.) among others.
AMERICAS TOUCH-LESS SENSING MARKET
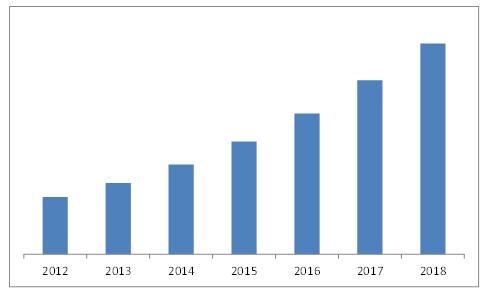
Source: MarketsandMarkets Analysis
AMERICAS GESTURE RECOGNITION MARKET
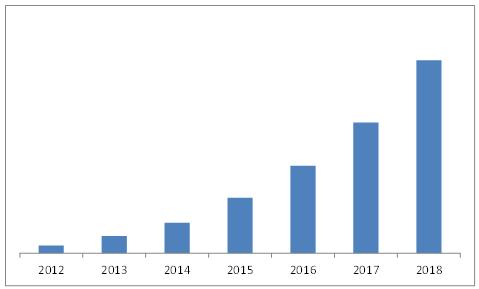
Source: MarketsandMarkets Analysis
 Exclusive indicates content/data unique to MarketsandMarkets and not available with any competitors.
Table Of Contents
1 Introduction (Page No. - 24)
1.1 Key Take-Aways
1.2 Report Description
1.3 Markets Covered
1.4 Stakeholders
1.5 Research Methodology
1.5.1 Market Size
1.5.2 Key Data Points Taken From Secondary Sources
1.5.3 Key Data Points Taken From Primary Sources
1.5.4 Assumptions Made For This Report
2 Executive Summary (Page No. - 32)
3 Cover-Page Interview (Page No. - 36)
3.1 Qualcomm, Inc.
3.2 Cognivue Corporation
4 Americas Market Overview (Page No. - 42)
4.1 Market Definition
4.2 Market Evolution
4.2.1 Touch-Less Sensing
4.2.2 Gesture Recognition
4.3 Market Segmentation
4.3.1 Touch-Less Sensing
4.3.2 Gesture Recognition
4.4 Value Chain Analysis
4.4.1 Touch-Less Sensing
4.4.2 Gesture Recognition
4.4.2.1 Semiconductor Vendors
4.4.2.1.1 Key Technology Providers
4.4.2.1.2 Component Manufacturers
4.4.2.2 Software Solution Providers
4.4.2.3 Oems
4.5 Porter�s Five Forces Analysis
4.5.1 Touch-Less Biometrics
4.5.1.1 Threat Of New Entrants
4.5.1.2 Threat Of Substitutes
4.5.1.3 Degree Of Competition
4.5.1.4 Bargaining Power Of Buyer
4.5.1.5 Bargaining Power Of Supplier
4.5.2 Touch-Less Sanitary Equipment
4.5.2.1 Threat Of New Entrants
4.5.2.2 Threat Of Substitutes
4.5.2.3 Degree Of Competition
4.5.2.4 Bargaining Power Of Buyer
4.5.2.5 Bargaining Power Of Supplier
4.5.3 Gesture Recognition
4.5.3.1 Threat Of New Entrants
4.5.3.2 Threat Of Substitutes
4.5.3.3 Degree Of Competition
4.5.3.4 Bargaining Power Of Buyer
4.5.3.5 Bargaining Power Of Supplier
4.6 Market Dynamics
4.6.1 Touch-Less Sensing-Biometrics Market
4.6.1.1 Overview
4.6.1.2 Drivers
4.6.1.2.1 Augmented R&D And Federal Funding
4.6.1.2.2 Safety Of Esteemed Organizations Inhabiting The Cr�me De La Cr�me
4.6.1.3 Restraints
4.6.1.3.1 Skewed Acceptance Level In Pivotal Applications
4.6.1.4 Opportunities
4.6.1.4.1 Touch-Less Multimodal Biometrics In The Automotive Industry
4.6.1.5 Burning Issue
4.6.1.5.1 Dilemma Among The Oems To Select The Industry For Partnerships
4.6.1.6 Winning Imperatives
4.6.1.6.1 Dedicated Marketing Concentrating On The Defense Market And Minimal Ombudsman
4.6.2 Touch-Less Sensing-Sanitary Equipment Market
4.6.2.1 Overview
4.6.2.2 Drivers
4.6.2.2.1 Sophisticated Ergonomics Suited To The American Idiosyncrasies
4.6.2.2.2 Spurt In Travel, Healthcare, And Education Verticals
4.6.2.3 Restraints
4.6.2.3.1 Modest Support From The Retrofit Market Owing To Escalated Price Tags
4.6.2.4 Opportunities
4.6.2.4.1 Diversified Product Range For The Residential Sector
4.6.2.5 Burning Issue
4.6.2.5.1 Cheaper Alternative
4.6.2.6 Winning Imperatives
4.6.2.6.1 Synchronized Relationship With The Distributors
4.6.2.7 Emerging Trends
4.6.2.7.1 Paradigm Shift Towards Networked Products
4.6.2.7.2 Self-Sanitizing Products
4.6.3 Gesture Recognition Market
4.6.3.1 Overview
4.6.3.2 Drivers
4.6.3.2.1 Intensive Efforts By Oem�s For One-Stop Integration
4.6.3.2.2 Highly Developed Gaming And Entertainment Industry
4.6.3.3 Restraints
4.6.3.3.1 Saturation In The Consumer Electronics Industry
4.6.3.4 Opportunities
4.6.3.4.1 Multimedia Management In Home Environment
4.6.3.5 Burning Issues
4.6.3.5.1 Regulations In The Automotive Industry
4.6.3.6 Winning Imperatives
4.6.3.6.1 Focused R&D In Other Potential Verticals
4.7 Emerging Trends In Gesture Recognition Market
4.7.1 Posture Recognition, Proxemics And Behaviours Expected To Take Gesture Recognition To The Next Level
5 Touch-Less Sensing Market (Page No. - 87)
5.1 Introduction
5.2 Touch-Less Sensing � Technology Analysis
5.2.1 Infrared Sensors
5.2.2 Capacitive Sensors
5.3 Touch-Less Sensing - Product Market
5.3.1 Sanitary Equipment Market
5.3.1.1 Touch-Less Faucets
5.3.1.2 Touch-Less Soap Dispenser
5.3.1.3 Touch-Less Paper Towel Dispensers
5.3.1.4 Touch-Less Trash Cans
5.3.1.5 Touch-Less Flushes
5.3.1.6 Hand Dryers
5.3.2 Touch-Less Biometrics Market
5.3.2.1 Geographic Distribution
5.3.2.2 Touch-Less Fingerprint Recognition
5.3.2.3 Iris Recognition
5.3.2.4 Face Recognition System
5.3.2.4.1 Methods Of Face Recognition
5.3.2.4.1.1 Traditional Method
5.3.2.4.1.2 Face Recognition Using Eigen Faces
5.3.2.4.1.3 Face Recognition Using Line Edge Map
5.3.2.4.1.4 3d Face Recognition
5.3.2.4.1.5 Skin Texture Analysis
5.3.2.4.1.6 Facial Thermo Gram
5.3.2.4.1.7 Smile Recognition
5.3.2.5 Voice Recognition
5.4 Touch-Less Sensing � Applications Market
5.4.1 Touch-Less Biometrics Grows Across All Applications
5.4.2 Travel
5.4.3 Government
5.4.4 Finance & Banking
5.4.5 Consumer Electronics
5.4.6 Healthcare
5.4.7 Others
6 Americas Gesture Recognition Market (Page No. - 155)
6.1 Introduction
6.2 Gesture Recognition � Technology Analysis
6.2.1 How Gesture Recognition Works?
6.2.1.1 Software Turns Any 2D Camera Into Gesture Recognition Device
6.2.2 Gesture Detection Technologies
6.2.2.1 Touch/Device Based Gesture Recognition
6.2.2.1.1 Accelerometers
6.2.2.1.2 Gyroscopes
6.2.2.2 Touch-Less Gesture Recognition Technologies
6.2.2.2.1 Capacitive/Electric Near Field
6.2.2.2.2 Infrared Array
6.2.2.2.3 Ultrasonic Technology
6.2.2.2.4 2D Camera Based
6.2.2.2.5 3d Vision Technologies
6.2.2.2.5.1 Stereoscopic
6.2.2.2.5.2 Structured Lighting
6.2.2.2.5.3 Time-Of-Flight Cameras
6.2.2.2.5.4 Gesture Cameras
6.2.2.3 2D Vs. 3D
6.2.2.3.1 2D Gesture Recognition Holds The Maximum Market Share
6.2.2.4 Technology Comparison
6.2.2.4.1 Time Of Flight � The Rising Star Of Gesture Recognition Market
6.3 Gesture Recognition � Application Market
6.3.1 Introduction
6.3.2 Consumer Electronics
6.3.2.1 Smartphones
6.3.2.2 Laptops
6.3.2.3 Gaming Consoles
6.3.2.4 Media Tablets
6.3.2.5 Smart Tvs
6.3.2.6 Set-Top Boxes
6.3.3 Healthcare
6.3.4 Automotive
6.3.5 Retail
6.3.6 Others
7 Market By Geography (Page No. - 216)
7.1 Introduction
7.2 Pest Analysis
7.2.1 Political
7.2.2 Economic
7.2.3 Social
7.2.4 Technology
7.3 Americas
7.3.1 U.S.
7.3.2 Canada
7.3.3 Mexico
7.3.4 Brazil
7.3.5 Argentina
8 Competitive Landscape (Page No. - 246)
8.1 Introduction
8.2 Market Share Analysis
8.2.1 Gesture Recognition Market
8.3 Key Growth Strategies
8.4 Analysis Of Acquisitions
8.5 Analysis Of New Product Launches
8.6 Competitive Landscape: New Product Launch Gesture Recognition
8.7 Analysis Of Partnership, Agreements And Collaborations
8.8 Analysis Of Other Developments
9 Company Profiles (Overview, Products & Services, Financials, Strategy And Developments)* (Page No. - 269)
9.1 Ceva Incorporated
9.2 Cognitec Systems Gmbh
9.3 Cognivue Corporation
9.4 Cross Match Technologies
9.5 Elliptic Labs
9.6 Espros Photonics Corporation
9.7 Eyesight Tech
9.8 Gestsure Technologies
9.9 Intel Corporation
9.10 Irisguard, Inc.
9.11 Microchip Technology Inc.
9.12 Microsoft Corporation
9.13 Morphotrak
9.14 Movea SA
9.15 Omek Interactive
9.16 Pebbles Limited
9.17 Pmdtechnologies Gmbh
9.18 Pointgrab Limited
9.19 Primesense Limited
9.20 Pyreos Limited
9.21 Qualcomm, Inc.
9.22 Softkinetic
9.23 Thalmic Labs Inc.
9.24 XYZ Interactive Technologies, Inc.
*Details On Overview, Products & Services, Financials, Strategy And Developments Might Not Be Captured In Case Of Unlisted Companies.
List Of Tables (147 Tables)
Table 1 General Assumptions, Terminology & Application Key Notes
Table 2 Americas Touch-Less Sensing Market Revenue, 2012 � 2018 ($Million)
Table 3 Americas Gesture Recognition Market, 2012 � 2018
Table 4 Touch-Less Sanitary Equipment Market, By Americas, 2012 - 2018 ($Million)
Table 5 North America Touch-Less Sanitary Equipment Market, By Country, 2012 - 2018 ($Million)
Table 6 South America Touch-Less Sanitary Equipment Market, By Country, 2012 - 2018 ($Million)
Table 7 Americas Touch-Less Faucet Market, By Region, 2012 - 2018 ($Million)
Table 8 Americas Touch-Less Faucet Shipments, By Region, 2012 - 2018 (Thousand Units)
Table 9 North America Touch-Less Faucet Market, By Country ($Million)
Table 10 North America Touch-Less Faucet Shipment, By Country, 2012 - 2018 (Thousand Units)
Table 11 South America Touch-Less Faucet Market, By Country, 2012 - 2018 ($Million)
Table 12 South America Touch-Less Faucet Shipment, By Country, 2012 - 2018 (Thousand Units)
Table 13 Americas Touch-Less Soap Dispenser Market, By Region, 2012 - 2018 ($Million)
Table 14 Americas Touch-Less Soap Dispenser Shipments, By Region, 2012 - 2018 (Thousand Units)
Table 15 North America Touch-Less Soap Dispenser Market, By Country, 2012 - 2018 ($Million)
Table 16 North America Touch-Less Soap Dispenser Shipments, By Country, 2012 - 2018 (Thousand Units)
Table 17 South America Touch-Less Soap Dispensers Market, By Country, 2012 - 2018 ($Million)
Table 18 South America Touch-Less Soap Dispensers Shipment, By Country, 2012 � 2018 (Thousand Units)
Table 19 Americas Touch-Less Towel Dispensers And Flushes Market, By Region, 2012 - 2018 ($Million)
Table 20 Americas Touch-Less Towel Dispensers And Flushes Shipment, By Region, 2012 - 2018 (Thousand Units)
Table 21 North America Touch-Less Towel Dispensers And Flushes Market, By Country, 2012 - 2018 ($Million)
Table 22 North America Touch-Less Towel Dispensers And Flushes Shipment, By Country, 2012 - 2018 (Thousand Units)
Table 23 South America Touch-Less Towel Dispensers And Flushes Market, By Country, 2012 - 2018 ($Million)
Table 24 South America Touch-Less Towel Dispensers And Flushes Shipment, By Country, 2012 - 2018 (Thousand Units)
Table 25 Americas Touch-Less Trash Can Market, By Region, 2012 - 2018 ($Million)
Table 26 Americas Touch-Less Trash Can Shipment, By Region, 2012 - 2018 (Thousand Units)
Table 27 North America Touch-Less Trash Can Market, By Country, 2012 - 2018 ($Million)
Table 28 North America Touch-Less Trash Can Shipment, By Country, 2012 - 2018 (Thousand Units)
Table 29 South America Touch-Less Trash Can Market, By Country, 2012 - 2018 ($Million)
Table 30 South America Touch-Less Trash Can Shipment, By Country, 2012 - 2018 (Thousand Units)
Table 31 Americas Touch-Less Hand Dryer Market, By Region, 2012 - 2018 ($Million)
Table 32 Americas Touch-Less Hand Dryer Shipment,By Region, 2012 - 2018 (Thousand Units)
Table 33 North America Touch-Less Hand Dryers Market, By Country, 2012 - 2018 ($Million)
Table 34 North America Touch-Less Hand Dryers Shipment, By Country, 2012 � 2018 (Thousand Units)
Table 35 South America Touch-Less Hand Dryers Market, By Country, 2012 - 2018 ($Million)
Table 36 South America Touch-Less Hand Dryers Shipment, By Country, 2012 � 2018 (Thousand Units)
Table 37 Americas Touch-Less Biometric Market, By Region, 2012 - 2018 ($Million)
Table 38 North America Touch-Less Biometric Market, By Country, 2012 - 2018 ($Million)
Table 39 South America Touch-Less Biometric Market, By Country, 2012 - 2018 ($Million)
Table 40 Product Segments Of Companies Providing Touch-Less Biometric Solutions
Table 41 Americas Touch-Less Fingerprint Market, By Region, 2012 - 2018 ($Million)
Table 42 North America Touch-Less Fingerprint Market, By Country, 2012 - 2018 ($Million)
Table 43 South America Touch-Less Fingerprint Market, By Country, 2012 - 2018 ($Million)
Table 44 Touch-Less Versus Touch Fingerprinting
Table 45 Americas Touch-Less Iris Recognition Market, By Region, 2012 - 2018 ($Million)
Table 46 North America Touch-Less Iris Recognition Market, By Country, 2012 - 2018 ($Million)
Table 47 South America Touch-Less Iris Recognition Market, By Country, 2012 - 2018 ($Million)
Table 48 Americas Touch-Less Face Recognition Market, By Region, 2012 - 2018 ($Million)
Table 49 North America Touch-Less Face Recognition Market, By Country, 2012 - 2018 ($Million)
Table 50 South America Touch-Less Face Recognition Market, By Country, 2012 - 2018 ($Million)
Table 51 Comparison Between 2D & 3d Facial Recognition
Table 52 Americas Touch-Less Voice Recognition Market, By Region, 2012 - 2018 ($Million)
Table 53 North America Touch-Less Voice Recognition Market, By Country, 2012 - 2018 ($Million)
Table 54 South America Touch-Less Voice Recognition Market, By Country, 2012 - 2018 ($Million)
Table 55 Americas Electric Near Field Technology Gr Market Revenue, By Consumer Electronic Devices, 2012 - 2018 ($Million)
Table 56 Americas Electric Near Field Technology Gr Market Volumes, By Consumer Electronic Devices, 2012 - 2018 (Million Units)
Table 57 Americas Infrared Technology Gr Market Revenue, By Applications, 2012 - 2018 ($Million)
Table 58 Americas Infrared Technology Gr Market Shipments, By Applications, 2012 - 2018 (Million Units)
Table 59 Americas Infrared Technology Gr Market Revenue, By Consumer Electronic Devices, 2012 - 2018 ($Million)
Table 60 Americas Infrared Technology Gr Market Shipment, By Consumer Electronic Devices, 2012 - 2018 (Million Units)
Table 61 Americas Ultrasonic Technology Gr Market Revenue, By Consumer Electronic Devices, 2012 - 2018 ($Million)
Table 62 Americas Ultrasonic Technology Gr Market Volume, By Consumer Electronic Devices, 2012 - 2018 (Million Units)
Table 63 Gr 3d Technology Market Revenue, By Applications, 2012 - 2018 ($Million)
Table 64 Gr 3d Technology Market Shipments, By Applications, 2012 - 2018 (Million Units)
Table 65 Gr 3d Technology Market Shipment, By Consumer Electronic Devices, 2012 - 2018 (Million Units)
Table 66 Americas 3d Gr Market Revenue, By Consumer Electronic Devices, 2012 - 2018 ($Million)
Table 67 Gesture Recognition: Technology Comparison
Table 68 Americas Consumer Electronics Gr Market Revenue, By Devices, 2012 � 2018 ($Million)
Table 69 Americas Consumer Electronics Gr Market Shipments, By Devices, 2012 � 2018 (Million Units)
Table 70 Americas Consumer Electronics Gr Market ,By Country, 2012 � 2018 ($Million)
Table 71 Americas Consumer Electronics Gr Market, By Country, 2012 � 2018 (Million Units)
Table 72 Americas Gr Smartphones Market, 2012 � 2018
Table 73 Americas Gr Smartphones Market Revenue, By Technology, 2012 � 2018 ($Million)
Table 74 Americas Smartphone Gr Shipments, By Country (Million Units) 184
Table 75 Americas Gr Laptop Pcs Market, 2012 � 2018
Table 76 Americas Gr Laptop Pcs Market Revenue, By Technology, 2012 � 2018 ($Million)
Table 77 Americas Gr Laptop Pcs Market Shipments, By Technology, 2012 � 2018 (Million Units)
Table 78 Americas Laptop Gr Shipments, By Country (Million Units)
Table 79 Americas Gr Gaming Consoles Market, 2012 � 2018
Table 80 Americas Gr Media Tablets Market, 2012 � 2018
Table 81 Americas Gr Media Tablets Market Revenue, By Technology, 2012 � 2018 ($Million)
Table 82 Americas Gr Media Tablets Market Shipments, By Technology, 2012 � 2018 (Million Units)
Table 83 Americas Tablet Gr Shipments, By Country (Million Units)
Table 84 Americas Gr Smart Tvs Market, 2012 � 2018
Table 85 Americas Gr Smart Tvs Market Revenue, By Technology, 2012 � 2018 ($Million)
Table 86 Americas Gr Smart Tvs Market Shipments, By Technology, 2012 � 2018 (Million Units)
Table 87 Americas Smart Tv Shipments, By Country (Million Units)
Table 88 Americas Gr Set-Top Box Market, 2012 � 2018
Table 89 Americas Gr Set-Top Box Market Revenue, By Technology, 2012 � 2018 ($Million)
Table 90 Americas Gr Set-Top Box Market Shipments, By Technology, 2012 � 2018 (Million Units)
Table 91 Americas Heatlhcare Gr Market Revenue, By Country, 2012 - 2018 ($Million)
Table 92 Americas Automotive Gr Market Revenue, By Country, 2012 - 2018 ($Thousand)
Table 93 Americas Automotive Gr Market Shipments, By Country, 2012 - 2018 (Thousand Units)
Table 94 Americas Gr Market, By Automotive Applications, 2012 � 2018
Table 95 Americas Gr Market, By Retail Applications, 2012 � 2018
Table 96 Americas Retail Gr Market Revenue, By Country, 2012 � 2018 ($Thousand)
Table 97 Americas Retail Gr Market Shipments, By Country, 2012 � 2018 (Thousand Units)
Table 98 Americas Gr Market, By Others Application, 2012 � 2018
Table 99 Americas Others Gr Market Revenue, By Country, 2012 � 2018 ($Thousand)
Table 100 Americas Others Gr Market Shipments, By Country, 2012 � 2018 (Thousand Units)
Table 101 Americas Market, By Touch-Less Biometric Technologies, 2012 - 2018 ($Million)
Table 102 Americas Market, By Touch-Less Sanitary Equipment, 2012 - 2018 ($Million)
Table 103 Americas Market,By Sanitary Equipment Shipment, 2012 - 2018 (Million Units)
Table 104 Americas Gr Market Revenue, By Technology, 2012 � 2018 ($Million)
Table 105 Americas Gr Device Shipments, By Technology, 2012 � 2018 (Million Units)
Table 106 Americas Gr Market Revenue, By Applications, 2012 � 2018 ($Million)
Table 107 Americas Gr Market Shipments, By Applications, 2012 � 2018 (Million Units)
Table 108 Americas Gr Market, By Country, 2012 - 2018 ($Million)
Table 109 Americas Gr Shipment, By Country, 2012 - 2018 (Million Units)
Table 110 U.S. Gesture Recognition Market, 2012 - 2018
Table 111 U.S. Gesture Recognition Market, By Applications, 2012 - 2018 ($Million)
Table 112 U.S. Gesture Recognition Volumes, By Applications, 2012 � 2018 (Million Units)
Table 113 Canada Gesture Recognition Market, 2012 � 2018
Table 114 Canada Gesture Recognition Market, By Applications, 2012 - 2018 ($Million)
Table 115 Canada Gesture Recognition Volumes, By Applications, 2012 - 2018 (Million Units)
Table 116 Mexico Gesture Recognition Market, 2012 � 2018
Table 117 Mexico Gesture Recognition Market, By Applications, 2012 - 2018 ($Million)
Table 118 Mexico Gesture Recognition Volumes, By Applications, 2012 - 2018 (Million Units)
Table 119 Brazil Gesture Recognition Market, By Applications, 2012 � 2018
Table 120 Brazil Gesture Recognition Market, By Applications, 2012 - 2018 ($Million)
Table 121 Brazil Gesture Recognition Volumes, By Applications, 2012 - 2018 (Million Units)
Table 122 Argentina Gesture Recognition Market, 2012 - 2018
Table 123 Argentina Gesture Recognition Market, By Applications, 2012 - 2018 ($Million) 244
Table 124 Argentina Gesture Recognition Volumes, By Applications, 2012 - 2018 (Thousand Units)
Table 125 Competitive Landscape: Acquisitions Touch-Less Sensing
Table 126 Competitive Landscape: Acquisitions Gesture Recognition
Table 127 Competitive Landscape: New Product Launch Touch-Less Sensing
Table 128 Competitive Landscape: New Product Launch Gesture Recognition
Table 129 Competitive Landscape: Partnership, Agreements And Collaborations � Touch-Less Sensing
Table 130 Competitive Landscape: Partnership, Agreements And Collaborations � Gesture Recognition
Table 131 Competitive Landscape: Other Developments � Touch-Less Sensing
Table 132 Competitive Landscape: Other Developments � Gesture Recognition
Table 133 Ceva: Market Revenue, By Segments, 2011 � 2012 ($Million)
Table 134 Ceva: Market Revenue, By Geography,2011 � 2012 ($Million)
Table 135 Intel: Market Revenue, 2011 � 2012 ($Million)
Table 136 Intel: Sales, By Business Segments, 2010 � 2012 ($Million)
Table 137 Intel: Market Revenue, By Geography, 2010 � 2012 ($Million)
Table 138 Microchip Technology: Products
Table 139 Microchip Technology: Overall Revenue, 2011 - 2012 ($Million)
Table 140 Microsoft: Market Revenue, 2010 - 2012 ($Billion)
Table 141 Microsoft: Market Revenue, By Product Segment,2010 - 2012 ($Billion)
Table 142 Microsoft: Market Revenue, By Geography, 2010 - 2012 ($Billion)
Table 143 Morphotrak: Products And Services
Table 144 Pyreos: Products And Services
Table 145 Qualcomm: Overall Revenues, 2010 - 2012 ($Billion)
Table 146 Qualcomm: Revenues By Product/Business Segments, 2010 - 2012 ($Billion)
Table 147 Qualcomm: Revenue By Geography, 2010 - 2012 ($Billion)
List Of Figures (51 Figures)
Figure 1 Market Research Methodology
Figure 2 Evolution Of Touch-Less Sensing Market
Figure 3 Evolution Of Gesture Recognition Market
Figure 4 Gesture Recognition Market Segmentation
Figure 5 Value Chain Analysis: Touch-Less Biometrics
Figure 6 Complete Value Chain Of Gesture Recognition Market
Figure 7 Porter�s Five Forces Analysis: Americas Touch-Less Biometrics
Figure 8 Porter�s Threat Of New Entrants: Americas Touch-Less Biometrics
Figure 9 Porter�s Threat Of Substitutes: Americas Touch-Less Biometrics
Figure 10 Porter�s Degree Of Competition: Americas Touch-Less Biometrics
Figure 11 Porter�s Bargaining Power Of Buyer: Americas Touch-Less Biometrics
Figure 12 Porter�s Bargaining Power Of Supplier: Americas Touch-Less Biometrics
Figure 13 Porter�s Five Forces Analysis: Americas Touch-Less Sanitary Equipment
Figure 14 Porter�s Threat Of New Entrants: Americas Touch-Less Sanitary Equipment
Figure 15 Porter�s Threat Of Substitutes: Americas Touch-Less Sanitary Equipment
Figure 16 Porter�s Degree Of Competition: Americas Touch-Less Sanitary Equipment
Figure 17 Porter�s Bargaining Power Of Buyer: Americas Touch-Less Sanitary Equipment
Figure 18 Porter�s Bargaining Power Of Supplier: Americas Touch-Less Sanitary Equipment
Figure 19 Porter�s Five Forces Analysis: Americas Gesture Recognition Market
Figure 20 Porter�s Threat Of New Entrants: Americas Gesture Recognition Market
Figure 21 Porter�s Threat Of Substitutes: Americas Gesture Recognition Market
Figure 22 Porter�s Degree Of Competition: Americas Gesture Recognition Market
Figure 23 Porter�s Bargaining Power Of Buyer: Americas Gesture Recognition Market
Figure 24 Porter�s Bargaining Power Of Supplier: Americas Gesture Recognition Market
Figure 25 Americas Touch-Less Biometrics Impact Analysis: Drivers
Figure 26 Touch-Less Biometric Impact Analysis: Restraints
Figure 27 Touch-Less Sanitary Equipment Impact Analysis: Drivers
Figure 28 Touch-Less Sanitary Equipment Impact Analysis: Restraints
Figure 29 Gesture Recognition Impact Analysis: Drivers
Figure 30 Gesture Recognition Impact Analysis: Restraints
Figure 31 Types Of Infrared Sensors
Figure 32 Major Players: Touch-Less Biometric Solutions
Figure 33 Major Players: Touch-Less Fingerprint Solutions
Figure 34 Major Players: Touch-Less Iris Scan Solutions
Figure 35 Major Players: Touch-Less Face Recognition Solutions
Figure 36 Flow Diagram Of Face Recognition Process
Figure 37 Major Players: Touch-Less Voice Recognition Solutions
Figure 38 Gesture Recognition Applications
Figure 39 Global Laptop Shipments And Technology Penetration, 2012 � 2018
Figure 40 Global Media Tablet Shipments And Technology Penetration, 2012 � 2018
Figure 41 Global Smart Tvs Shipments And Technology Penetration, 2012 � 2018
Figure 42 Global Set-Tob Box Shipments And Technology Penetration, 2012 � 2018
Figure 43 Global Gr Market, By Healthcare Applications, 2012 - 2018
Figure 44 Pest Analysis: Americas
Figure 45 Americas Gesture Recognition Market Players
Figure 46 Analysis Of Key Growth Strategies: Touch-Less Sensing
Figure 47 Analysis Of Key Growth Strategies: Gesture Recognition
Figure 48 Cognivue Understands Vision: Total Solution
Figure 49 Product Line Of Safran Morphotrak
Figure 50 Solutions Offered By Pointgrab
Figure 51 XYZ Interactive: Products And Markets


Growth opportunities and latent adjacency in Americas Gesture Recognition & Touchless Sensing Market