Automotive Fuel Delivery System Market by Component (Fuel-Pump, Injector, Pressure Regulator, Filter, & Rail; Air Control Valve, and Throttle Position Sensor), Alternative Fuel Vehicles (CNG, LPG, and LNG), and Region: Industry Trends & Forecast to 2019


[147 Pages Report] The downsizing of engine and reducing the weight of the components has resulted into many innovations in fuel delivery system. The function of the fuel delivery system is to store and supply fuel to the engine. The engine intake system is where the fuel is combined with air, atomized, and vaporized. Then it is compressed in the engine cylinder and ignited to produce energy. A fuel delivery system consists of a number of essential components that plays significant role in the proper delivery of fuel.
The major factors driving the global automotive fuel delivery system market are increase in global vehicle production and sales volume. The global automotive fuel delivery system market is estimated to grow at a healthy CAGR of 5.9% from 2014 to 2019. North America is the fastest growing region in the global automotive fuel delivery system market, owing to the increase in production of vehicles in the region. Asia-Oceania is expected to be the largest market for automotive fuel delivery system. In the past few years several OEMs are expanded their business in Asia-Oceania region to cater to the increasing demand for vehicles in the region. The economic conditions are highly favorable for automotive industry in Asia-Oceania. The major contributors in this region are China, Japan, and South Korea. CNG is estimated to be the fastest growing market globally for automotive fuel delivery system for alternative vehicles market, due to the increasing installations of electronic fuel delivery systems.
The major drivers for the automotive fuel delivery system market are growth in sales of commercial and passenger vehicles, increasing demand for alternative fuel vehicles, and most importantly high demand for fuel delivery system. North America and Asia-Oceania have shown a significant growth, while the European and Rest of the World market are expected to show a decent growth rate.
This report classifies and defines the market size, in terms of volume and value. It provides a comprehensive analysis and insights (both, qualitative and quantitative) into automotive fuel delivery system. It highlights potential growth opportunities in the coming years, while also reviewing market drivers, restraints, growth indicators, challenges, market dynamics, competitive landscape, and other key aspects with respect to automotive fuel delivery system. Along with quantitative analysis, the report covers qualitative aspects such as value chain analysis, PEST analysis, and Porter�s Five Force analysis for the global market.
Key players in this market have also been identified and profiled. Some of the key players include Robert Bosch GmbH (Germany), Continental AG (Germany), Delphi Automotive Plc. (U.K.), Denso Corporation (Japan), and Magneti Marelli (Italy). Major strategies adopted by these market players include regional expansion and new product development.
Scope of the Report:
This research report categorizes the global fuel delivery system market into the following segments and sub-segments:
Automotive Fuel Delivery System Market, By Component
- Fuel pump
- Fuel injector
- Fuel pressure regulator
- Fuel filter
- Fuel rail
- Air control valve
- Throttle position sensor
Automotive Fuel Delivery System Market, By Alternative Fuel Vehicles
- CNG
- LPG
- LNG
Automotive Fuel Delivery System Market, By Region
- Asia-Oceania
- Europe
- North America
- RoW
Additional Customizations Available:
- Fuel Delivery System Market for Off-highway Vehicles
- Construction
- Agriculture
- Fuel Delivery System Market for Aviation Industry
- Who Supplies Whom
- Additional Company Profiles
Automotive Fuel Delivery System Market, by Region, 2014 (Million Units)
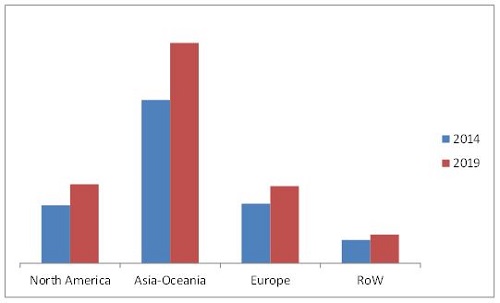
Source: MarketsandMarkets Analysis
The automotive fuel delivery system market is projected to grow at a CAGR of 5.93% from 2014�2019 and reach $3.61 Billion by 2019.
The global automotive fuel delivery system market, in terms of volume, is projected to reach 1.68 billion units by 2019. This market for automotive fuel delivery system is estimated to be largest in the Asia-Oceania region, with an estimated market share of about 52.5% in 2014. China is a major contributor to the growth of fuel delivery system in the Asia-Oceania region. The global demand for automotive fuel delivery system market is propelled by increasing number of vehicle production across the globe, and growing demand for alternative fuel vehicles. North America was estimated to hold the second position in the market by volume for automotive fuel delivery system for 2014. In the North American market for fuel delivery system, U.S. and Canada make major contributions, owing to larger vehicle production in these countries.
In Europe and North America, the automotive fuel delivery system market is matured, as the vehicle production is not growing at significant rate. However, Eastern Europe and North American countries such as Mexico still have the potential market given the increasing production capacity. On the other hand, the automotive fuel delivery system market of Asia-Oceania and RoW regions are growing significantly, following increasing vehicle production and sales volume also growing concern of consumers towards safety.
The global market is dominated by major players such as Robert Bosch GmbH (Germany), Continental AG (Germany), Delphi Automotive Plc. (U.K.), Denso Corporation (Japan), and Magneti Marelli (Italy).
Automotive Fuel Delivery System Market Size, 2014 vs. 2019 (Million Units)
Source: MarketsandMarkets Analysis
 Exclusive indicates content/data unique to MarketsandMarkets and not available with any competitors.
Table of Contents
1 Introduction (Page No. - 15)
1.1 Objectives of the Study
1.2 Market Definition
1.3 Market Scope
1.3.1 Markets Covered
1.3.2 Years Considered in the Report
1.4 Currency
1.5 Package Size
1.6 Limitations
1.7 Stakeholders
2 Research Methodology (Page No. - 18)
2.1 Research Data
2.2 Secondary Data
2.2.1 Key Secondary Sources
2.2.2 Key Data From Secondary Sources
2.3 Primary Data
2.3.1 Sampling Techniques & Data Collection Methods
2.3.2 Primary Participants
2.3.2.1 Key Industry Insights
2.4 Factor Analysis
2.4.1 Introduction
2.4.2 Demand Side Analysis
2.4.2.1 Impact of GDP on Commercial Vehicle Sales
2.4.2.2 Urbanization vs Passenger Cars Per 1000 People
2.4.2.3 Infrastructure: Roadways
2.4.3 Supply Side Analysis
2.4.3.1 Increasing Vehicle Production in Developing Countries
2.4.4 Technological Advancements
2.4.5 Influence of Other Factors
2.5 Market Size Estimation
3 Executive Summary (Page No. - 29)
4 Premium Insights (Page No. - 33)
4.1 Fuel Delivery Market Overview
4.2 Global Outlook for Fuel Delivery Market, By Key Countries
4.3 Global Outlook for Fuel Delivery Market, By Component
4.4 Global Outlook for Fuel Delivery Market, By Alternative Fuel Vehicle
4.5 Life Cycle Analysis, By Region
5 Market Overview (Page No. - 37)
5.1 Introduction
5.2 Market Segmentation
5.2.1 By Components
5.2.2 By Region
5.2.3 By Alternative Fuel Vehicles
5.3 Market Dynamics
5.3.1 Drivers
5.3.1.1 Growing Global Vehicle Production Volume
5.3.1.2 Increasing Sales of Alternative Fuel Vehicles
5.3.2 Restraints
5.3.2.1 Increasing Demand of Electric Vehicle
5.3.3 Opportunities
5.3.3.1 Partnerships Between Global Oems and Domestic Players
5.3.3.2 Growing Sales & Production of Vehicles in Developing Countries
5.3.4 Challenges
5.3.4.1 Fluctuating Prices of Raw Materials
5.4 Burning Issues
5.4.1 Environment-Friendly Fuel Delivery
5.5 Value Chain Analysis
5.6 Porter�s Five Forces Analysis
5.6.1 Threat From New Entrants
5.6.2 Threat From Substitutes
5.6.3 Bargaining Power of Suppliers
5.6.4 Bargaining Power of Buyers
5.6.5 Intensity of Competitive Rivalry
6 Fuel Delivery Market, By Components (Page No. - 54)
6.1 Introduction
6.1.1 Market Estimates, By Components
6.1.1.1 ECU
6.1.1.2 Fuel Pump
6.1.1.3 Fuel Filter
6.1.1.4 Fuel Rail
6.1.1.5 Fuel Pressure Regulator
6.1.1.6 Fuel Injector
6.1.1.7 Throttle Position Sensor
7 Fuel Delivery Market, By Alternative Fuel Vehicles (Page No. - 68)
7.1 Introduction
7.1.1 Compressed Natural Gas (CNG) Vehicle
7.1.1.1 ECU
7.1.1.2 Pressure Regulator
7.1.1.3 High Pressure Fuel Line
7.1.1.4 Low Pressure Fuel Line
7.1.1.5 Injector
7.1.1.6 Fuel Rail
7.1.2 Liquefied Petroleum Gas (LPG) Vehicle
7.1.2.1 ECU
7.1.2.2 Vaporizer
7.1.2.3 Regulator
7.1.2.4 Injector
7.1.2.5 Fuel Line
7.1.3 Liquefied Natural Gas (LNG) Vehicle
8 Fuel Delivery Market, By Region (Page No. - 78)
8.1 Pest Analysis
8.1.1 Political Factors
8.1.1.1 Europe
8.1.1.2 Asia-Oceania
8.1.1.3 North America
8.1.1.4 Rest of the World
8.1.2 Economic Factors
8.1.2.1 Europe
8.1.2.2 Asia-Oceania
8.1.2.3 North America
8.1.2.4 Rest of the World
8.1.3 Social Factors
8.1.3.1 Europe
8.1.3.2 Asia-Oceania
8.1.3.3 North America
8.1.3.4 Rest of the World
8.1.4 Technological Factors
8.1.4.1 Europe
8.1.4.2 Asia-Oceania
8.1.4.3 North America
8.1.4.4 Rest of the World
8.2 Introduction
8.2.1 Market Estimates, By Region
8.2.1.1 Asia-Oceania
8.2.1.1.1 Japan
8.2.1.1.2 China
8.2.1.1.3 India
8.2.1.1.4 South Korea
8.2.1.2 Europe
8.2.1.2.1 Germany
8.2.1.2.2 France
8.2.1.2.3 U.K.
8.2.1.3 North America
8.2.1.3.1 U.S.
8.2.1.3.2 Canada
8.2.1.3.3 Mexico
8.2.1.4 RoW
8.2.1.4.1 Brazil
8.2.1.4.2 Russia
9 Competitive Landscape (Page No. - 104)
9.1 Overview
9.2 Competitive Situation and Trends
9.3 Battle for Market Share: Expansion Was the Key Strategy
9.4 New Product Launches
9.5 Agreements, Partnerships, Collaborations, & Joint Ventures
9.6 Mergers & Acquisitions
9.7 Expansions
9.8 Supply Contract
10 Company Profiles (Page No. - 112)
(Company at A Glance, Recent Financials, Products & Services, Strategies & Insights, & Recent Developments)*
10.1 Introduction
10.2 Robert Bosch GmbH
10.3 Continental AG
10.4 Delphi Automotive PLC
10.5 Denso Corporation
10.6 Magneti Marelli S.P.A
10.7 Keihin Corporation
10.8 Landi Renzo
10.9 Magna International Inc.
10.10 TI Automotive
10.11 Toyda Gosie Co.Ltd.
*Details on Company at A Glance, Recent Financials, Products & Services, Strategies & Insights, & Recent Developments Might Not Be Captured in Case of Unlisted Companies.
11 Appendix (Page No. - 142)
11.1 Discussion Guide
11.2 Introducing RT: Real Time Market Intelligence
11.3 Available Customizations
With the Given Market Data, Marketsandmarkets Offers Customizations in Accordance to the Company�s Specific Needs.
11.3.1 Fuel Delivery Market, By Injector Type
11.3.1.1 Throttle Body Fuel Injection
11.3.1.2 Direct Fuel Injection
11.3.1.3 Sequential Fuel Injection
11.3.1.4 Port Fuel Injection
11.3.2 Fuel Delivery Market, By Hybrid Vehicle & Region
11.3.2.1 North America
11.3.2.2 Europe
11.3.2.3 Asia-Oceania
11.3.2.4 RoW
11.4 Related Reports
List of Tables (72 Tables)
Table 1 Impact of Drivers on Fuel Delivery Market
Table 2 Impact Analysis of Restraint on Fuel Delivery Market
Table 3 Impact of Opportunities on the Fuel Delivery Market
Table 4 Impact of Challenges on the Fuel Delivery Market
Table 5 Global: Fuel Delivery Market, By Components, 2012�2019 (Million Units)
Table 6 Global: Fuel Delivery Market, By Components, 2012�2019 ($Million)
Table 7 Global: Fuel Delivery ECU Market, By Vehicle Type, 2012�2019 (Million Units)
Table 8 Global: Fuel Delivery ECU Market, By Vehicle Type, 2012�2019 ($Million)
Table 9 Global: Fuel Delivery Fuel Pump Market, By Vehicle Type, 2012�2019 (Million Units)
Table 10 Global Fuel Delivery Fuel Pump Market, By Vehicle Type, 2012�2019 ($Million)
Table 11 Global: Fuel Delivery Fuel Filter Market, By Vehicle Type, 2012�2019 (Million Units)
Table 12 Global: Fuel Delivery Fuel Filter Market, By Vehicle Type, 2012�2019 ($Million)
Table 13 Global: Fuel Delivery Fuel Rail Market, By Vehicle Type, 2012�2019 (Million Units)
Table 14 Global: Fuel Delivery Fuel Rail Market, By Vehicle Type, 2012�2019 ($Million)
Table 15 Global: Fuel Delivery Fuel Pressure Regulator Market, By Vehicle Type, 2012�2019 (Million Units)
Table 16 Global: Fuel Delivery Fuel Pressure Regulator Market, By Vehicle Type, 2012�2019 ($Million)
Table 17 Global: Fuel Delivery Fuel Injector Market, By Vehicle Type, 2012�2019 (Million Units)
Table 18 Global: Fuel Delivery Fuel Injector Market, By Vehicle Type, 2012�2019 ($Million)
Table 19 Global: Fuel Delivery Throttle Position Sensor, By Vehicle Type, 2012�2019 (Million Units)
Table 20 Global: Fuel Delivery Throttle Position Sensor, By Vehicle Type, 2012�2019 ($Million)
Table 21 Global: Fuel Delivery Market Size, By Alternative Fuel Vehicles, 2012�2019 (�000 Units)
Table 22 Global: CNG Vehicles ECU Market, By Region, 2012�2019 (�000 Units)
Table 23 Global: CNG Vehicles Pressure Regulator Market, By Region, 2012�2019 (�000 Units)
Table 24 Global: CNG Vehicles High Pressure Fuel Line Market, By Region, 2012�2019 (�000 Units)
Table 25 Global: CNG Vehicles Low Pressure Fuel Line Market, By Region, 2012�2019 (�000 Units)
Table 26 Global: CNG Vehicles Injector Market, By Region, 2012�2019 (�000 Units)
Table 27 Global: CNG Vehicles Fuel Rail Market, By Region, 2012�2019 (�000 Units)
Table 28 Global: LPG Vehicles ECU Market, By Region, 2012�2019 (�000 Units)
Table 29 Global: LPG Vehicles Vaporizer Market, By Region, 2012�2019 (�000 Units)
Table 30 Global: LPG Vehicles Regulator Market, By Region, 2012�2019 (�000 Units)
Table 31 Global: LPG Vehicles Injector Market, By Region, 2012�2019 (�000 Units)
Table 32 Global: LPG Vehicles Fuel Line Market, By Region, 2012�2019 (�000 Units)
Table 33 Annual Sales of LNG Vehicles in U.S. & China
Table 34 Global Fuel Delivery Market, By Region, 2012�2019 (Million Units)
Table 35 Global Fuel Delivery Market, By Region, 2012�2019 ($Million)
Table 36 Asia-Oceania: Fuel Delivery Market, By Components, 2012�2019 (Million Units)
Table 37 Asia-Oceania: Market, By Components, 2012�2019 ($Million)
Table 38 Japan: Fuel Delivery Market, By Components, 2012�2019 (Million Units)
Table 39 Japan: Market, By Components, 2012�2019 ($Million)
Table 40 China: Fuel Delivery Market, By Components, 2012�2019 (Million Units)
Table 41 China: Market, By Components, 2012�2019 ($Million)
Table 42 India: Fuel Delivery Market, By Components, 2012�2019 (Million Units)
Table 43 India: Market, By Components, 2012�2019 ($Million)
Table 44 South Korea: Fuel Delivery Market, By Components, 2012�2019 (Million Units)
Table 45 South Korea: Market, By Components, 2012�2019 ($Million)
Table 46 Europe: Fuel Delivery Market, By Components, 2012�2019 (Million Units)
Table 47 Europe: Market, By Components, 2012�2019 ($Million)
Table 48 Germany: Fuel Delivery Market, By Components, 2012�2019 (Million Units)
Table 49 Germany: Market, By Components, 2012�2019 ($Million)
Table 50 France: Fuel Delivery Market, By Components, 2012�2019 (Million Units)
Table 51 France: Market, By Components, 2012�2019 ($Million)
Table 52 U.K.: Fuel Delivery Market, By Components, 2012�2019 (Million Units)
Table 53 U.K.: Market, By Components, 2012�2019 ($Million)
Table 54 North America: Fuel Delivery Market, By Components, 2012�2019 (Million Units)
Table 55 North America: Market, By Components, 2012�2019 ($Million)
Table 56 U.S.: Fuel Delivery Market, By Components, 2012�2019 (Million Units)
Table 57 U.S.: Market, By Components, 2012�2019 ($Million)
Table 58 Canada: Fuel Delivery Market, By Components, 2012�2019 (Million Units)
Table 59 Canada: Market, By Components, 2012�2019 ($Million)
Table 60 Mexico: Fuel Delivery Market, By Components, 2012�2019 (Million Units)
Table 61 Mexico: Market, By Components, 2012�2019 ($Million)
Table 62 RoW: Fuel Delivery Market, By Components, 2012�2019 (Million Units)
Table 63 RoW: Market, By Components, 2012�2019 ($Million)
Table 64 Brazil: Fuel Delivery Market, By Components, 2012�2019 (Million Units)
Table 65 Brazil: Market, By Components, 2012�2019 ($Million)
Table 66 Russia: Fuel Delivery Market, By Components, 2012�2019 (Million Units)
Table 67 Russia: Market, By Components, 2012�2019 ($Million)
Table 68 New Product Launches, 2013�2014
Table 69 Agreements, Partnerships, Collaborations, & Joint Ventures, 2011�2014
Table 70 Mergers & Acquisitions, 2010�2013
Table 71 Expansions, 2013�2014
Table 72 Supply Contracts, 2011�2013
List of Figures (62 Figures)
Figure 1 Market Segmentation
Figure 2 Research Design
Figure 3 Research Methodology Model
Figure 4 Breakdown of Primary Interviews: By Company Type, Designation, & Region
Figure 5 Gross Domestic Product (GDP) vs Commercial Vehicle Production (2012-2013)
Figure 6 Urbanization vs Passenger Cars Per 1000 People (2010-2014)
Figure 7 Road Network vs Passenger Car Sales
Figure 8 Vehicle Production, 2009-2013
Figure 9 Macro Level Factor Analysis
Figure 10 Market Size Estimation Methodology: Bottom-Up Approach
Figure 11 Global Fuel Filter Market is Projected to Grow at the Highest CAGR of 10.63% During 2014 to 2019
Figure 12 Asia-Oceania Accounts for the Largest Share of 50.8% in Global Fuel Delivery Market
Figure 13 Fuel Delivery for Alternative Fuel Vehicles Market Size, By Type, 2014 - 2019
Figure 14 Opportunities in Fuel Delivery Market, 2014�2019
Figure 15 Fuel Delivery Market Growth Rate, By Country, 2014�2019
Figure 16 ECU is Lading the Global Fuel Delivery Market in 2014
Figure 17 Fuel Filter is Projected to Have Highest Growth in Fuel Delivery Market
Figure 18 Passenger Car is Projected to Have Highest Growth in Fuel Delivery Market
Figure 19 Fuel Delivery Market Size, By Alternative Fuel Vehicle, 2014
Figure 20 Asia-Oceania to Grow at A Faster Rate Than Other Regions During the Forecast Period
Figure 21 Market Segmentation, By Components
Figure 22 Market Segmentation, By Region
Figure 23 Market Segmentation, By Alternative Fuel Vehicles
Figure 24 Growing Vehicle Production and Increasing Sales of Alternative Fuel Vehicles is Driving the Global Fuel Delivery Market
Figure 25 Global Vehicle Production Volume, (2009�2013)
Figure 26 Global Natural Gas Vehicles Count, (2008�2012)
Figure 27 Electric Vehicle (EV) Sales, 2012�2014
Figure 28 Increasing Vehicle Sales in Developing Nations: an Opportunity for the Fuel Delivery Market
Figure 29 Prices of Iron Ore and Aluminum, 2009�2013, ($/Mt)
Figure 30 Value Chain Analysis: Major Value is Added During Manufacturing and Assembly Phases
Figure 31 Porter�s Five Forces Analysis : Fuel Delivery Market
Figure 32 ECU is Projected to Grow at the CAGR of 9.91% From 2014�2019
Figure 33 Passenger Car is Leading Global Fuel Delivery ECU Market Growing at the Projected CAGR of 10.78% During the Forecast Period
Figure 34 LCV in Fuel Pump Market is Projected to Grow at A CAGR of 6.87% From 2014�2019 ($Million)
Figure 35 Passenger Cars has Major Market Share in Fuel Delivery Fuel Filter Market ($Million)
Figure 36 Fuel Rail in HCV is Projected to Grow at A CAGR of 5.51% From 2014�2019 ($Million)
Figure 37 Fuel Pressure Regulator Market for LCV is Projected to Grow at A CAGR of 7.18% From 2014�2019
Figure 38 Fuel Injectors Market for Passenger Cars is Valued at $8,916.7 Million in 2014
Figure 39 Global Throttle Position Sensor Market for Passenger Cars is Projected to Grow at A CAGR of 8.96% During the Forecast Period
Figure 40 CNG Fuel Delivery is Estimated to Be the Fastest Growing Market Globally During the Forecast Period
Figure 41 China is the Market Leader in Asia-Oceania for CNG Fuel Delivery Market From 2014 to 2019 (�000 Units)
Figure 42 Europe is the Fastest Growing Market in Fuel Delivery Market of LPG (2014-2019)
Figure 43 China is the Fastest Growing Market for Fuel Delivery at A CAGR of 10.68% During 2014�2019
Figure 44 ECU is Leading the Fuel Delivery Market in Asia-Oceania
Figure 45 Germany to Hold the Largest Share in Fuel Delivery Market From 2014 to 2019 in Europe
Figure 46 U.S. is Leading the Fuel Delivery Market From 2014 to 2019 in North America
Figure 47 Brazil is Leading the Fuel Delivery Market From 2014 to 2019 in RoW
Figure 48 Companies Adopted Expansion as the Key Growth Strategy During 2008-2013
Figure 49 Denso Corporation & Continental AG Grew at the Fastest Rate From 2008 to 2013
Figure 50 Significant Investments in Expansion has Fuelled Growth & Innovation in 2013-2014,
Figure 51 Region-Wise Revenue Mix of Top 5 Players
Figure 52 Competitive Benchmarking of Key Players (2008�2013): Denso Corporation Proved to Be A Frontrunner With Its Wide & Robust Product Portfolio
Figure 53 Robert Bosch GmbH: Company Snapshot
Figure 54 Continental AG:Company Snapshot
Figure 55 Delphi Automotive PLC: Company Snapshot
Figure 56 Denso Corporation: Company Snapshot
Figure 57 Magneti Marelli S.P.A.
Figure 58 Keihin Corporation: Company Snapshot
Figure 59 Landi Renzo: Company Snapshot
Figure 60 Magna International Inc: Company Snapshot
Figure 61 TI Automotive: Company Snapshot
Figure 62 Toyda Gosie: Company Snapshot


Growth opportunities and latent adjacency in Automotive Fuel Delivery System Market