Business Process Management (BPM) in Real Estate Market by Component (Solutions and Services), Deployment Type (On-Premises and Cloud), Region (North America, Europe, Asia-Pacific, and Middle East & Africa) - Global Forecast to 2021


[126 Pages Report] The business process management (BPM) in real estate market is estimated to grow from USD 429.1 Million in 2016 to USD 1,298.0 Million by 2021, at a CAGR of 24.8% between 2016 and 2021.
The objective of the research study is to provide detailed segmentation of the business process management in real estate market on the basis of component, deployment type, and region. It also aims to provide information regarding key factors influencing the market growth, strategically analyze subsegments with respect to individual growth trends, future prospects, and contribution to the total market, analyze opportunities in the market for stakeholders, provide strategic profiles of key market players to comprehensively analyze core competencies, and draw a competitive landscape of the market. The base year considered for the study is 2015 and the market size forecast is from 2016 to 2021.
The research methodology used to estimate and forecast the business process management in real estate market begins with obtaining data on key vendor revenues and the market size of individual segments through secondary sources, such as annual reports, press releases, investors� presentations, white papers, and paid databases, which include Factiva, Bloomberg, among others. Vendor offerings are also taken into consideration to determine market segmentation. The bottom-up procedure was employed to arrive at the overall market size of the global BPM in real estate market from the individual technology segment in the market.
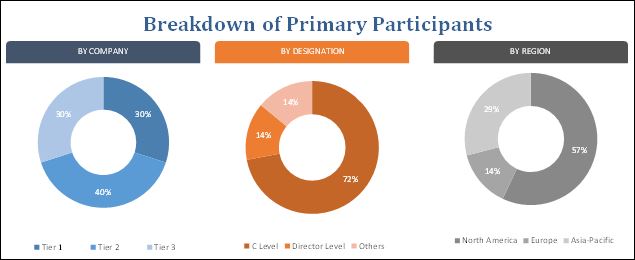
After arriving at the overall market size, the total market was split into several segments and subsegments, which were then verified through primary research by conducting extensive interviews with key industry personnel, such as CEOs, VPs, directors, and executives. Data triangulation and market breakdown procedures were employed to complete the overall market engineering process and arrive at the exact statistics for all segments and subsegments. The breakdown of profiles of primary participants is depicted in the below figure:
To know about the assumptions considered for the study, download the pdf brochure
The ecosystem of the business process management in real estate market comprises BPM solutions and service providers, and system integrators. Key players of the BPM in real estate market are IBM Corporation, Oracle Corporation, Red Hat, Software AG, AMP Technologies, Onit, Inc., BP Logix Inc., Auraportal, K2.com, and nTrust, among others.
Target Audience
- BPM in Real Estate Companies
- Technology Service Providers
- Value Added Resellers
- Government Bodies & Research Organizations
- Cloud Service Providers
- Association & Industry Bodies
- Technology Consultants
- Satellite Service Providers
�The research study answers several questions for the stakeholders, primarily which market segments to focus on during the next two to five years for prioritizing the efforts and investments�
Scope of the Report
The research report categorizes the business process management in real estate market to forecast revenues and analyze trends in each of the following subsegments:
By Component
- Solutions
- Process Improvement
- Automation
- Content & Document Management
- Integration
- Monitoring & Optimization
- Services
- System Integration
- Consulting
- Training & Education
By Deployment Type
- On-premises
- Cloud
By Region
- North America
- Europe
- Middle East and Africa (MEA)
- Asia-Pacific (APAC)
- Latin America
Available Customizations
With the given market data, MarketsandMarkets offers customizations as per the company�s specific needs. The following customization options are available for the report:
Product Analysis
- Product matrix, which gives a detailed comparison of product portfolio of each company
Geographic Analysis
- Further breakdown of the APAC business process management in real estate market
- Further breakdown of the MEA BPM in real estate market
- Further breakdown of the Latin American BPM in real estate market
Company Information
- Detailed analysis and profiling of additional market players
The business process management (BPM) in real estate market is estimated to grow from USD 429.1 Million in 2016 to USD 1,298.0 Million by 2021, at a high CAGR of 24.8% during the forecast period. Growth of the business process management in real estate market can be attributed to the increasing adoption of BPM solutions by real estate companies. BPM solutions are implemented to automate business processes and enhance operational efficiency. Furthermore, over the past decade, the advent of new technologies has radically transformed the way organizations engage with customers. Real estate organizations are adopting business process management solutions to cater to the growing demand of customers for optimizing business processes and enhancing their presence in the market.
Based on component, the business process management in real estate market is divided into solutions and services. The solutions segment is projected to lead the BPM in real estate market during the forecast period. Furthermore, there has been rapid adoption of monitoring & optimizing solutions in the real estate sector. The monitoring & optimizing solutions segment of the BPM in real estate market is expected to grow at the highest CAGR during the forecast period. The services segment is anticipated to grow at the highest rate during the forecast period. High growth rate of the services segment can be attributed to the wide use of services by various enterprises to maximize efficiency of their infrastructure.
Based on deployment type, the on-premises segment is projected to lead the global BPM in real estate market during the forecast period. However, the cloud segment offers higher flexibility in deployment of BPM software as compared to on-premises.
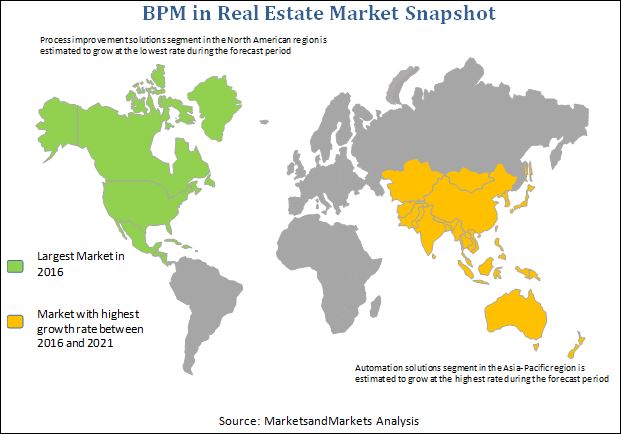
At present, North America holds the largest share of the global business process management in real estate market. The BPM in real estate market in Asia-Pacific is projected to grow at the highest CAGR during the forecast period. Asia-Pacific is a key market for real estate developers. The growth of the BPM in real estate market in the Asia-Pacific region can be attributed to the increasing deployment of BPM solutions by real estate enterprises to enhance efficiency and streamline their business operations.
Vendors also face challenges with respect to understanding end user requirements. Managing cultural change in organizations acts a challenge for the growth of the BPM in the real estate market.
Most vendors have adopted agreements, collaborations, and partnerships as key strategies to enhance their client base and customer experience. Existing players in this market are constantly innovating and upgrading their products to enhance their market share. Furthermore, owing to technological advancements in BPM, key vendors are focusing on launching next generation solutions and services aimed at enhancing and automating business workflow, such as managing contracts and leasing offers, automating proposals, and addressing customer queries, among others.
To speak to our analyst for a discussion on the above findings, click Speak to Analyst
 Exclusive indicates content/data unique to MarketsandMarkets and not available with any competitors.
Table of Contents
1 Introduction (Page No. - 14)
1.1 Objectives of the Study
1.2 Market Definition
1.3 Market Scope
1.3.1 Markets Covered
1.3.2 Years Considered for the Study
1.4 Currency
1.5 Limitations
1.6 Stakeholders
2 Research Methodology (Page No. - 17)
2.1 Research Data
2.1.1 Secondary Data
2.1.1.1 Key Data From Secondary Sources
2.1.2 Primary Data
2.1.2.1 Key Data From Primary Sources
2.1.2.2 Key Industry Insights
2.2 Market Size Estimation
2.2.1 Bottom-Up Approach
2.2.2 Top-Down Approach
2.3 Market Breakdown and Data Triangulation
2.3.1 Assumptions
3 Executive Summary (Page No. - 26)
4 Premium Insights (Page No. - 29)
4.1 Attractive Market Opportunities in the BPM in Real Estate Market
4.2 BPM in Real Estate Market, By Component
4.3 BPM in Real Estate Market, By Solutions
4.4 BPM in Real Estate Market, By Services
4.5 BPM in Real Estate Market, By Deployment Type
4.6 BPM in Real Estate Market
5 Market Overview (Page No. - 32)
5.1 Introduction
5.2 Market Segmentation
5.2.1 By Component
5.2.2 By Deployment Type
5.2.3 By Region
5.3 Market Dynamics
5.3.1 Drivers
5.3.1.1 Improves Efficiency of Business Operations and Enhances Employee Satisfaction
5.3.1.2 Big Data and Cloud to Enhance Efficiency of BPM Software
5.3.2 Restraints
5.3.2.1 Huge Upfront Investments Involved in the Deployment of BPM Suites
5.3.3 Opportunities
5.3.3.1 Increased Spending in Analytics
5.3.4 Challenges
5.3.4.1 Managing Cultural Change
5.3.4.2 Ineffective Integration of BPM Suites With Existing Systems
5.3.5 Impact Analysis of Market Dynamics
6 BPM in Real Estate Market, By Component (Page No. - 39)
6.1 Introduction
6.2 Solutions
6.2.1 Automation
6.2.2 Content & Document Management
6.2.3 Monitoring & Optimization
6.2.4 Integration
6.2.5 Process Improvement
6.3 Services
6.3.1 System Integration
6.3.2 Consulting
6.3.3 Training & Education
7 BPM in Real Estate Market, By Deployment Type (Page No. - 51)
7.1 Introduction
7.2 On-Premises
7.3 Cloud
8 Regional Analysis (Page No. - 55)
8.1 Introduction
8.2 North America
8.3 Europe
8.4 Asia-Pacific
8.5 Middle East & Africa (MEA)
8.6 Latin America
9 Competitive Landscape (Page No. - 85)
9.1 Overview
9.2 Competitive Situation and Trends
9.2.1 New Product Launches
9.2.2 Acquisitions
9.2.3 Partnerships, Collaborations, & Agreements
10 Company Profiles (Page No. - 89)
(Overview, Products and Services, Financials, Strategy & Development)*
10.1 IBM Corporation
10.2 Oracle Corporation
10.3 Red Hat
10.4 Software AG
10.5 K2.Com
10.6 Amp Technologies
10.7 Onit, Inc.
10.8 BP Logix Inc.
10.9 Auraportal
10.10 Ntrust
10.11 Eximius BPO
*Details on Overview, Products and Services, Financials, Strategy & Development Might Not Be Captured in Case of Unlisted Companies.
11 Appendix (Page No. - 112)
11.1 Industry Experts
11.2 Discussion Guide
11.3 Knowledge Store: Marketsandmarkets� Subscription Portal
11.4 Introducing RT: Real-Time Market Intelligence
11.5 Available Customizations
11.6 Related Reports
11.7 Author Details
List of Tables (88 Tables)
Table 1 BPM in Real Estate Market, By Component, 2014�2021 (USD Million)
Table 2 BPM in Real Estate Market, By Solutions, 2014�2021 (USD Million)
Table 3 Automation Solutions: BPM in Real Estate Market, By Region, 2014�2021 (USD Million)
Table 4 Content & Document Management Solutions: BPM in Real Estate Market, By Region, 2014�2021 (USD Million)
Table 5 Monitoring & Optimization Solutions: BPM in Real Estate Market, By Region, 2014�2021 (USD Million)
Table 6 Integration Solutions: BPM in Real Estate Market, By Region, 2014�2021 (USD Million)
Table 7 Process Improvement Solutions: BPM in Real Estate Market, By Region 2014�2021 (USD Million)
Table 8 BPM in Real Estate Market, By Services, 2014�2021 (USD Million)
Table 9 System Integration Services: BPM in Real Estate Market, By Region, 2014�2021 (USD Million)
Table 10 Consulting Services: BPM in Real Estate Market, By Region, 2014�2021 (USD Million)
Table 11 Training & Education Services: BPM in Real Estate Market, By Region, 2014�2021 (USD Million)
Table 12 BPM in Real Estate Market, By Deployment Type, 2014�2021 (USD Million)
Table 13 On-Premises: BPM in Real Estate Market, By Region, 2014�2021 (USD Million)
Table 14 Cloud: BPM in Real Estate Market, By Region, 2014�2021 (USD Million)
Table 15 North America: BPM in Real Estate Market, By Component, 2014�2021 (USD Million)
Table 16 North America: BPM in Real Estate Market, By Solutions, 2014�2021 (USD Million)
Table 17 North America: BPM in Real Estate Market, By Services, 2014�2021 (USD Million)
Table 18 North America: BPM in Real Estate Market, By Deployment Type, 2014�2021 (USD Million)
Table 19 North America: BPM in Real Estate Market, By Country, 2014�2021 (USD Million)
Table 20 U.S.: BPM in Real Estate Market, By Component, 2014�2021 (USD Million)
Table 21 U.S.: BPM in Real Estate Market, By Solutions, 2014�2021 (USD Million)
Table 22 U.S.: BPM in Real Estate Market, By Services, 2014�2021 (USD Million)
Table 23 U.S.: BPM in Real Estate Market, By Deployment Type, 2014�2021 (USD Million)
Table 24 Canada: BPM in Real Estate Market, By Component, 2014�2021 (USD Million)
Table 25 Canada: BPM in Real Estate Market, By Solutions, 2014�2021 (USD Million)
Table 26 Canada: BPM in Real Estate Market, By Services, 2014�2021 (USD Million)
Table 27 Canada: BPM in Real Estate Market, By Deployment Type, 2014�2021 (USD Million)
Table 28 Rest of North America: BPM in Real Estate Market, By Component, 2014�2021 (USD Million)
Table 29 Rest of North America: BPM in Real Estate Market, By Solutions, 2014�2021 (USD Million)
Table 30 Rest of North America: BPM in Real Estate Market, By Services, 2014�2021 (USD Million)
Table 31 Rest of North America: BPM in Real Estate Market, By Deployment Type, 2014�2021 (USD Million)
Table 32 Europe: BPM in Real Estate Market, By Component, 2014�2021 (USD Million)
Table 33 Europe: BPM in Real Estate Market, By Solutions, 2014�2021 (USD Million)
Table 34 Europe: BPM in Real Estate Market, By Services, 2014�2021 (USD Million)
Table 35 Europe: BPM in Real Estate Market, By Deployment Type, 2014�2021 (USD Million)
Table 36 Europe: BPM in Real Estate Market, By Country, 2014�2021 (USD Million)
Table 37 U.K.: BPM in Real Estate Market, By Component, 2014�2021 (USD Million)
Table 38 U.K.: BPM in Real Estate Market, By Solutions, 2014�2021 (USD Million)
Table 39 U.K.: BPM in Real Estate Market, By Services, 2014�2021 (USD Million)
Table 40 U.K.: BPM in Real Estate Market, By Deployment Type, 2014�2021 (USD Million)
Table 41 Germany: BPM in Real Estate Market, By Component, 2014�2021 (USD Million)
Table 42 Germany: BPM in Real Estate Market, By Solutions, 2014�2021 (USD Million)
Table 43 Germany: BPM in Real Estate Market, By Services, 2014�2021 (USD Million)
Table 44 Germany: BPM in Real Estate Market, By Deployment Type, 2014�2021 (USD Million)
Table 45 Rest of Europe: BPM in Real Estate Market, By Component, 2014�2021 (USD Million)
Table 46 Rest of Europe: BPM in Real Estate Market, By Solutions, 2014�2021 (USD Million)
Table 47 Rest of Europe: BPM in Real Estate Market, By Services, 2014�2021 (USD Million)
Table 48 Rest of Europe: BPM in Real Estate Market, By Deployment Type, 2014�2021 (USD Million)
Table 49 Asia-Pacific: BPM in Real Estate Market, By Component, 2014�2021 (USD Million)
Table 50 Asia-Pacific: BPM in Real Estate Market, By Solutions, 2014�2021 (USD Million)
Table 51 Asia-Pacific: BPM in Real Estate Market, By Services, 2014�2021 (USD Million)
Table 52 Asia-Pacific: BPM in Real Estate Market, By Deployment Type, 2014�2021 (USD Million)
Table 53 Asia-Pacific: BPM in Real Estate Market, By Country, 2014�2021 (USD Million)
Table 54 Australia: BPM in Real Estate Market, By Component, 2014�2021 (USD Million)
Table 55 Australia: BPM in Real Estate Market, By Solutions, 2014�2021 (USD Million)
Table 56 Australia: BPM in Real Estate Market, By Services, 2014�2021 (USD Million)
Table 57 Australia: BPM in Real Estate Market, By Deployment Type, 2014�2021 (USD Million)
Table 58 New Zealand: BPM in Real Estate Market, By Component, 2014�2021 (USD Million)
Table 59 New Zealand: BPM in Real Estate Market, By Solutions, 2014�2021 (USD Million)
Table 60 New Zealand: BPM in Real Estate Market, By Services, 2014�2021 (USD Million)
Table 61 New Zealand: BPM in Real Estate Market, By Deployment Type, 2014�2021 (USD Million)
Table 62 Rest of Asia-Pacific: BPM in Real Estate Market, By Component, 2014�2021 (USD Million)
Table 63 Rest of Asia-Pacific: BPM in Real Estate Market, By Solutions, 2014�2021 (USD Million)
Table 64 Rest of Asia-Pacific: BPM in Real Estate Market, By Services, 2014�2021 (USD Million)
Table 65 Rest of Asia-Pacific: BPM in Real Estate Market, By Deployment Type, 2014�2021 (USD Million)
Table 66 Middle East & Africa: BPM in Real Estate Market, By Component, 2014�2021 (USD Million)
Table 67 Middle East & Africa: BPM in Real Estate Market, By Solutions, 2014�2021 (USD Million)
Table 68 Middle East & Africa: BPM in Real Estate Market, By Services, 2014�2021 (USD Million)
Table 69 Middle East & Africa: BPM in Real Estate Market, By Deployment Type, 2014�2021 (USD Million)
Table 70 Middle East & Africa: BPM in Real Estate Market, By Country, 2014�2021 (USD Million)
Table 71 UAE: BPM in Real Estate Market, By Component, 2014�2021 (USD Million)
Table 72 UAE: BPM in Real Estate Market, By Solutions, 2014�2021 (USD Million)
Table 73 UAE: BPM in Real Estate Market, By Services, 2014�2021 (USD Million)
Table 74 UAE: BPM in Real Estate Market, By Deployment Type, 2014�2021 (USD Million)
Table 75 Rest of Middle East & Africa: BPM in Real Estate Market, By Component, 2014�2021 (USD Million)
Table 76 Rest of Middle East & Africa: BPM in Real Estate Market, By Solutions, 2014�2021 (USD Million)
Table 77 Rest of Middle East & Africa: BPM in Real Estate Market, By Services, 2014�2021 (USD Million)
Table 78 Rest of Middle East & Africa: BPM in Real Estate Market, By Deployment Type, 2014�2021 (USD Million)
Table 79 Latin America: BPM in Real Estate Market, By Component, 2014�2021 (USD Million)
Table 80 Latin America: BPM in Real Estate Market, By Solutions, 2014�2021 (USD Million)
Table 81 Latin America: BPM in Real Estate Market, By Services, 2014�2021 (USD Million)
Table 82 Latin America: BPM in Real Estate Market, By Deployment Type, 2014�2021 (USD Million)
Table 83 New Product Launches, 2014-2016
Table 84 Acquisitions, 2016
Table 85 Partnerships, Collaborations, & Agreements, 2016
Table 86 New Product Launches/Developments, 2013-2016
Table 87 New Partnerships, 2014-2016
Table 88 Acquisitions, 2016
List of Figures (48 Figures)
Figure 1 Research Design
Figure 2 Market Size Estimation Methodology: Bottom Up Approach
Figure 3 Market Size Estimation Methodology: Top-Down Approach
Figure 4 Breakdown of Primary Interviews: By Company Type, Designation, and Region
Figure 5 Market Breakdown Data Triangulation Approach
Figure 6 BPM in Real Estate Market, By Component, 2016 & 2021 (USD Million)
Figure 7 BPM in Real Estate Market, By Deployment Type, 2016 & 2021 (USD Million)
Figure 8 BPM in Real Estate Market in Asia-Pacific Region Expected to Grow at Highest CAGR During the Forecast Period
Figure 9 Adoption of BPM Suites for Enhancing Business Processes Drives the Growth of the BPM in Real Estate Market
Figure 10 Services Segment Expected to Grow at the Highest CAGR During the Forecast Period
Figure 11 Monitoring & Optimization Subsegment Expected to Grow at the Highest CAGR During the Forecast Period
Figure 12 Training & Education Subsegment Projected to Grow at the Highest CAGR During the Forecast Period
Figure 13 Cloud Deployment Type Segment Projected to Grow at the Highest CAGR During the Forecast Period
Figure 14 System Integration Subsegment Accounted for the Largest Share of the BPM in Real Estate Market
Figure 15 BPM in Real Estate Market Segmentation
Figure 16 BPM in Real Estate Market, By Component
Figure 17 BPM in Real Estate Market, By Deployment Type
Figure 18 BPM in Real Estate Market, By Region
Figure 19 Increasing Demand to Improve the Efficiency of Business Operations is Driving the Growth of the BPM in Real Estate Market
Figure 20 Services Component Segment of the BPM Market in Real Estate Projected to Grow at the Highest CAGR During the Forecast Period
Figure 21 Monitoring & Optimization Subsegment of the Solutions Segment to Grow at the Highest CAGR During the Forecast Period
Figure 22 Europe Expected to Lead the Automation Subsegment of the Solutions Segment By 2021
Figure 23 Europe Projected to Lead the Content & Document Management Subsegment of the Solutions Segment By 2021
Figure 24 North America to Lead the Monitoring & Optimization Subsegment of the Solutions Segment During the Forecast Period
Figure 25 North America to Lead the Integration Subsegment of the Solutions Segment Between 2016 and 2021
Figure 26 Asia-Pacific to Lead the Process Improvement Subsegment of the Solutions Segment By 2021
Figure 27 Training & Education Subsegment of the Services Segment to Grow at the Highest CAGR During the Forecast Period
Figure 28 North America to Lead the System Integration Subsegment of the Services Segment During the Forecast Period
Figure 29 North America Projected to Lead the Consulting Subsegment of the Services Segment During the Forecast Period
Figure 30 North America to Lead the Training & Education Subsegment of the Services Segment During the Forecast Period
Figure 31 Cloud Deployment Type Segment Projected to Grow at the Highest CAGR During the Forecast Period
Figure 32 North America Projected to Lead the On-Premises Deployment Type Segment of the BPM in Real Estate Market Between 2016 and 2021
Figure 33 North America to Lead the Cloud Deployment Type Segment of the BPM in Real Estate Market Between 2016 and 2021
Figure 34 BPM in Real Estate Market, By Region, 2014�2021 (USD Million)
Figure 35 The Asia-Pacific BPM in Real Estate Market to Grow at the Highest CAGR During the Forecast Period
Figure 36 North America BPM in Real Estate Market Snapshot
Figure 37 Asia-Pacific BPM in Real Estate Market Snapshot
Figure 38 Companies Adopted New Product Launches as Key Growth Strategy Between 2014 and 2016
Figure 39 Battle for Market Share: Partnerships, Collaborations & Agreements, and New Product Launches Were Key Growth Strategies
Figure 40 IBM Corporation: Company Snapshot
Figure 41 IBM Corporation: SWOT Analysis
Figure 42 Oracle Corporation: Company Snapshot
Figure 43 Oracle Corporation: SWOT Analysis
Figure 44 Red Hat: Company Snapshot
Figure 45 Red Hat: SWOT Analysis
Figure 46 Software AG: Company Snapshot
Figure 47 Software AG Corporation: SWOT Analysis
Figure 48 K2.Com: SWOT Analysis


Growth opportunities and latent adjacency in Business Process Management (BPM) in Real Estate Market