Caprolactam Market by Application (Nylon 6 Fibers (Textile, Industrial, Carpet Filament, Staple Fiber), Nylon 6 Engineering Plastics (Automotive, Electrical & Electronics, Industrial & Machinery, Wire & Cable), Region - Global Forecast to 2023


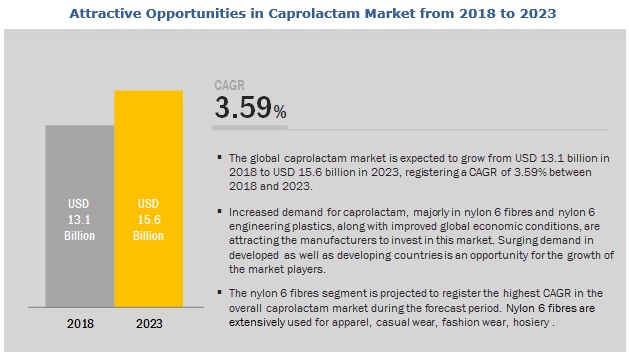
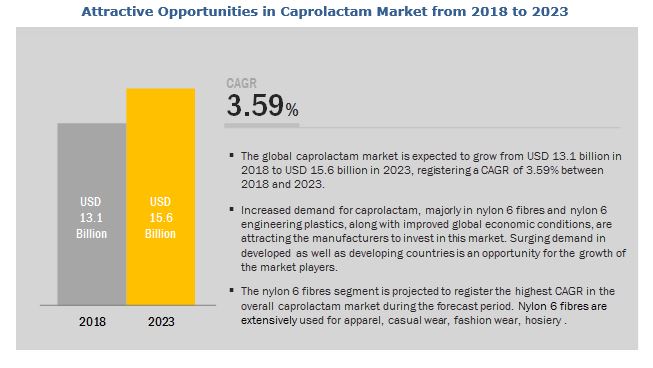
[197 Pages Report] The market for caprolactam is estimated to grow from USD 13.1 billion in 2018 to USD 15.6 billion by 2023, at a CAGR of 3.59% during the forecast period. The base year considered for this study is 2017 and the forecast period is from 2018 to 2023.
In 2017, the caprolactam market in the nylon 6 fibers segment accounted for the largest share of 47.3%, in terms of volume, and is projected to register a CAGR of 2.90% between 2018 and 2023. The caprolactam market in the nylon 6 engineering plastics segment is projected to register a CAGR of 3.54%, in terms of value, between 2018 and 2023. The increasing demand for caprolactam in engineering plastics and films application is expected to drive the market for caprolactam. The high growth of the caprolactam market is primarily due to the growing electrical & electronics and automotive industries.
Market Dynamics
Driver
Need for lightweight automotive vehicles
The application of polyamide 6 in the automotive sector started in the 1950s. The application was limited to seat covers and a few small parts of automobiles. After 2000, the application of polyamide 6 in the automotive sector increased to a great extent.
In new generation vehicles, strength-weight matrices are very critical. New generation vehicles are based on the principle of lightweight and strong structures made up of different advanced materials. These advanced materials are used in different vehicle parts. The metal usage is replaced by these advanced materials and plastics in order to reduce the total weight of the vehicle.
Polyamide 6 is one of the present-day materials for automotive weight reduction solution. The weight reduction is made to reduce the consumption of fuel in the vehicle, ultimately resulting in less CO2 emissions. The polyamide parts are lightweight and provide better strength than the metal parts.
Another major factor for replacing metal parts with plastic material is to achieve ease of mass production and continuity of production. Plastic parts can be injection molded and extruded. But, once the design is finalized for a particular part, mass production and achieving break even through economies of scale is comparatively easy. In addition, the outsourcing of production of these parts such as wheel rims and dashboard covers is easy to avoid factory overheads and a resultant reduction in the price of automobiles.
Restraint
Moisture absorption resulting in degradation of properties
Polyamide 6 is made from the polymerization of caprolactam and is known to have properties such as strength, stiffness, high thermal resistance, and high abrasion resistance, but the absorption of moisture is the key parameter considered during its selection. The products containing polyamide absorb moisture, thereby, decreasing their physical properties and making the product stiff. This drawback has to be considered by the manufacturers while producing the end application parts from polyamide. Different grades of polyamide have different moisture absorption rates.
Challenge
Strict regulations in China
In China, there are various regulations pertaining to the use of chemicals such as occupational exposure limits for hazardous chemicals, safety rules for classification, precautionary labeling and precautionary statements of chemicals, regulations on the safe management of hazardous chemicals, and restrictions and prohibitions regarding the import and export of certain chemicals. The Chinese caprolactam market is entirely domestic at the moment; the products are sold locally as high taxes make it difficult for them to export their products. Some cyclohexanone plants remain unable to operate at full capacity in the country due to strict emissions control.
However, the use of biomass for the production of caprolactam is likely to control the emission of harmful gases such as nitrogen oxide and ammonia and result in the reduction of overall environmental impact of caprolactam production in China.
The nylon 6 fibers segment is expected to account for the larger share of the caprolactam market. The nylon 6 fibers segment is the largest and fastest-growing application of caprolactam. Caprolactam is used widely in polyamide 6 for manufacturing washable domestic textiles. Polyamide 6 fabrics are dimensionally stable and smooth. The applications of polyamide 6 in the textile industry are classified into apparel, home furnishings, and industrial. Polyamide fabrics have properties such as high elasticity and resistance to mildew and moths. Due to these properties, they are used in nets, stockings, female underclothes, parachutes, and sporting garments, thereby, driving the demand for caprolactam.
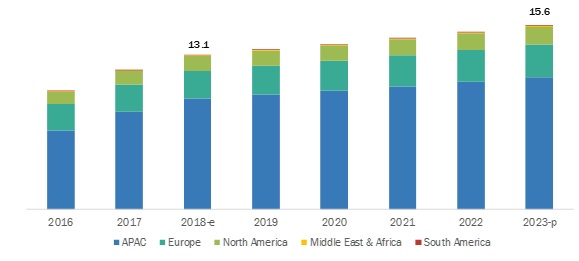
APAC is expected to account for the largest market share during the forecast period.
APAC has emerged as the leading consumer and producer of caprolactam. The APAC region is witnessing increased demand for luxury cars due to the increase in purchasing power of consumers. This has led to increased polyamide 6 demand in the region, which, in turn, is driving the nylon 6 engineering plastics segment. Prices for caprolactam are expected to rise in the APAC region due to anti-dumping sanctions imposed by the Government of China. These factors are further driving the demand for caprolactam in the region.
Key Market Players
The major players in the caprolactam market are AdvanSix Inc. (US), Alpek S.A.B. de C.V. (Mexico), The Aquafil Group (Italy), BASF SE (Germany), Capro Co. (South Korea), China Petrochemical Development Corporation (Taiwan), Domo Chemicals (Germany), Grupa Azoty (Poland), Gujarat State Fertilizers & Chemicals Limited (India), Highsun Group (China), KuibyshevAzot PJSC (Russia), Lanxess AG (Germany), Luxi Chemical Group Co., Ltd. (China), China Petroleum & Chemical Corporation (Sinopec) (China), Spolana (Czech Republic), Sumitomo Chemical Co., Ltd. (Japan), Toray Industries, Inc. (Japan), Ube Industries, Ltd. (Japan), and Zhejiang Hengyi Group Co., Ltd. (China).
Major strategies identified in the global market include the following:
- Expansions
- New product launches
- Acquisitions
- Agreements
Key Questions Addressed by the Report
- Who are the major market players in the Caprolactam market?
- What are the regional growth trends and the largest revenue-generating regions for the Caprolactam market?
- Which are the significant regions for different industries that are projected to witness remarkable growth for the Caprolactam market?
- What are the major types of Caprolactam that are projected to gain maximum market revenue and share during the forecast period?
- Which is the major application where Caprolactam are used that will be accounting for the majority of the revenue over the forecast period?
Scope of the Report
|
Report Metric |
Details |
|
Market size available for years |
2016–2023 |
|
Base year considered |
2017 |
|
Forecast period |
2018–2023 |
|
Forecast units |
Million (USD) |
|
Segments covered |
Caprolactam Market, by Application (Nylon 6 Fibers - Textile Filament, Industrial Filament, Carpet Filament, Staple Fiber; Nylon 6 Engineering Plastics - Automotive, Electrical & Electronics, Consumer Goods, Industrial/Machinery, Wire & Cable, Others (oil & gas and medical); Films - Food Packaging, Pharmaceutical Packaging, Agricultural Packaging) |
|
Geographies covered |
North America, Europe, APAC, MEA, and South America |
|
Companies covered |
AdvanSix Inc. (US), Alpek S.A.B. de C.V. (Mexico), The Aquafil Group (Italy), BASF SE (Germany), Capro Co. (South Korea), China Petrochemical Development Corporation (Taiwan), Domo Chemicals (Germany), Grupa Azoty (Poland), Gujarat State Fertilizers & Chemicals Limited (India), Highsun Group (China), KuibyshevAzot PJSC (Russia), Lanxess AG (Germany), Luxi Chemical Group Co., Ltd. (China), China Petroleum & Chemical Corporation (Sinopec) (China), Spolana (Czech Republic), Sumitomo Chemical Co., Ltd. (Japan), Toray Industries, Inc. (Japan), Ube Industries, Ltd. (Japan), and Zhejiang Hengyi Group Co., Ltd. (China). |
This research report categorizes the caprolactam market based on application and region.
On the basis of application, the caprolactam market has been segmented as follows:
-
Nylon 6 Fibers
- Textile Filament
- Industrial Filament
- Carpet Filament
- Staple Fiber
-
Nylon 6 Engineering Plastics
- Automotive
- Electrical & Electronics
- Consumer Goods
- Industrial/Machinery
- Wire & Cable
- Others (oil & gas and medical)
-
Films
- Food Packaging
- Pharmaceutical Packaging
- Agricultural Packaging
- Others (cross-linking for polyurethane, synthesis of lysine, synthesizing of medical/pharmaceutical components, and paint vehicles)
On the basis of region, the caprolactam market has been segmented as follows:
- APAC
- Europe
- North America
- Middle East & Africa
- South America
Recent Developments
- In May 2018, Aquafil and Genomatica announced the formation of Project EFFECTIVE, a multi-company collaboration to produce more sustainable fibers and plastics for commercial use by using renewable feedstocks and bio-based technologies. One of the key objectives of Project EFFECTIVE is to develop a more sustainable nylon, made from bio-based caprolactam produced using renewable feedstocks.
- In February 2018, Aquafil signed an agreement with INVISTA, one of the world’s largest integrated producers of chemical intermediates, polymers, and fibers, to acquire certain tangible and intangible assets related to INVISTA’s nylon 6 business activity in APAC. This will accelerate Aquafil’s investment program in APAC, which has the highest potential, in terms of demand growth for synthetic fibers.
- In April 2017, Lanxess expanded its production capacity for polyamide and precursors for plastics in Lillo-Antwerp (Belgium) in order to strengthen the competitiveness of this site. Caprolactam is a key precursor for the production of high-tech plastics and used in the automotive and electrical & electronics industries.
To speak to our analyst for a discussion on the above findings, click Speak to Analyst
 Exclusive indicates content/data unique to MarketsandMarkets and not available with any competitors.
Table of Contents
1 Introduction (Page No. - 19)
1.1 Objectives of the Study
1.2 Market Definition
1.3 Market Scope
1.3.1 Years Considered for the Study
1.4 Currency
1.5 Unit Considered
1.6 Stakeholders
2 Research Methodology (Page No. - 22)
2.1 Research Data
2.1.1 Secondary Data
2.1.1.1 Key Data From Secondary Sources
2.1.2 Primary Data
2.1.2.1 Key Data From Primary Sources
2.1.2.2 Key Industry Insights
2.1.2.3 Breakdown of Primary Interviews
2.2 Market Size Estimation
2.2.1 Bottom-Up Approach
2.2.2 Top-Down Approach
2.3 Data Triangulation
2.4 Assumptions
2.5 Limitations
3 Executive Summary (Page No. - 30)
4 Premium Insights (Page No. - 34)
4.1 Attractive Opportunities in the Caprolactam Market
4.2 Caprolactam Market, By Application
4.3 Caprolactam Market, Developed vs. Developing Countries
4.4 APAC Caprolactam Market
4.5 Caprolactam Market Attractiveness
5 Market Overview (Page No. - 37)
5.1 Introduction
5.2 Market Dynamics
5.2.1 Drivers
5.2.1.1 Need for Lightweight Automotive Vehicles
5.2.1.2 Growth of Films and Coatings Applications
5.2.1.3 Growth of Emerging Economies
5.2.2 Restraints
5.2.2.1 Moisture Absorption Resulting in Degradation of Properties
5.2.3 Opportunities
5.2.3.1 Development of Bio-Based Caprolactam in Regions With Strict Regulations
5.2.4 Challenges
5.2.4.1 Volatile Raw Material Prices
5.2.4.2 Strict Regulations in China
5.3 Porter’s Five Forces Analysis
5.3.1 Threat of Substitutes
5.3.2 Bargaining Power of Buyers
5.3.3 Threat of New Entrants
5.3.4 Bargaining Power of Suppliers
5.3.5 Intensity of Competitive Rivalry
6 Trade Data Analysis (Page No. - 45)
6.1 Caprolactam Import Data
6.2 Caprolactam Export Data
7 Manufacturing Process for Caprolactam (Page No. - 47)
7.1 Market Evolution
7.2 Raw Material Analysis
7.2.1 Phenol
7.2.2 Cyclohexane
7.2.3 Cyclohexene
7.2.4 Cyclohexanone
7.2.5 Hydroxylamine Sulfate
7.2.6 Caprolactam
7.3 Price Analysis
8 Caprolactam Market, By Application (Page No. - 53)
8.1 Introduction
8.2 Films
8.2.1 Food Packaging
8.2.1.1 Polyamide 6 Films are Used for the Packaging of A Wide Range of Food Items Due to Their Outstanding Properties
8.2.2 Pharmaceutical Packaging
8.2.2.1 Growing Healthcare Awareness and Rise in Income Levels are Contributing to the Growth of the Market in the Pharmaceutical Packaging Segment
8.2.3 Agricultural Packaging
8.2.3.1 Increasing Demand From the Middle East & Africa is Expected to Drive the Agricultural Films Market
8.2.4 Others (Electronic Products)
8.3 Nylon 6 Fibers
8.3.1 Textile Filament
8.3.1.1 an Array of Applications of Polyamide Fibers in the Textile Industry is Driving the Market in This Segment
8.3.2 Industrial Filament
8.3.2.1 The Market in the Industrial Filament Segment is Spurred By Demand From the Automotive Industry
8.3.3 Carpet Filament
8.3.3.1 Demand for Carpet Filament is Majorly From North America and Europe
8.3.4 Staple Fiber
8.3.4.1 Europe and APAC are Likely to Be Promising Markets in the Staple Fiber Segment
8.4 Nylon 6 Engineering Plastics
8.4.1 Automotive
8.4.1.1 Rising Demand for Lightweight and Fuel-Efficient Vehicles is the Main Driver for the Market
8.4.2 Electrical & Electronics
8.4.2.1 Diverse Usage of Nylon 6 Engineering Plastics in the Electrical & Electronics Segment is Likely to Boost Its Demand
8.4.3 Industrial/Machinery
8.4.3.1 Abrasion Resistance, Dimensional Stability, and Reverse Bending Properties are Expected to Drive the Demand in the Industrial/Machinery Segment
8.4.4 Consumer Goods
8.4.4.1 Use of Nylon 6 Engineering Plastics in the Form of Products and Coatings in the Consumer Goods Industry is Increasing Its Demand
8.4.5 Wire & Cable
8.4.5.1 Growing It and Communication Industries are Likely to Boost the Demand for Wire & Cable Application
8.4.6 Others
8.5 Others
9 Caprolactam Market, By Region (Page No. - 80)
9.1 Introduction
9.2 APAC
9.2.1 APAC Caprolactam Market, By Application
9.2.2 China
9.2.2.1 China Caprolactam Market, By Application
9.2.2.2 High Demand From the Appliances, Automotive, and Packaging Film Industries is Expected to Drive the Caprolactam Market
9.2.3 Taiwan
9.2.3.1 Taiwan Caprolactam Market, By Application
9.2.3.2 High Quality of Caprolactam is Likely to Boost the Demand
9.2.4 South Korea
9.2.4.1 South Korea Caprolactam Market, By Application
9.2.4.2 Expansion of the Automotive Industry is Likely to Propel the Demand for Caprolactam
9.2.5 Japan
9.2.5.1 Japan Caprolactam Market, By Application
9.2.5.2 Growing Investments in Renewable Chemicals are Expected to Spur the Demand for Caprolactam in the Country
9.2.6 India
9.2.6.1 India Caprolactam Market, By Application
9.2.6.2 Rapidly Growing Engineering Plastics and Electrical Segments are Expected to Drive the Caprolactam Market
9.2.7 Rest of APAC
9.2.7.1 Rest of APAC Caprolactam Market, By Application
9.3 Europe
9.3.1 By Application
9.3.2 Germany
9.3.2.1 Germany Caprolactam Market, By Application
9.3.2.2 Increasing Focus on Bio-Based Polyamide is Spurring the Demand for Bio-Based Caprolactam Market in the Country
9.3.2 France
9.3.2.1 France Caprolactam Market, By Application
9.3.2.2 Gradual Growth of the Automotive Industry is Expected to Drive the Caprolactam Market
9.3.3 UK
9.3.3.1 UK Caprolactam Market, By Application
9.3.3.2 Strict Regulatory Framework in the Country is Affecting the Caprolactam Market
9.3.4 Italy
9.3.4.1 Italy Caprolactam Market, By Application
9.3.4.2 Increasing Demand for Polyamide 6 Specialty Films From the Flexible Packaging Industry is Driving the Caprolactam Market in the Country
9.3.5 Belgium
9.3.5.1 Belgium Caprolactam Market, By Application
9.3.5.2 Belgium’s Dynamic Automotive Industry is Boosting the Demand for Caprolactam
9.3.6 Poland
9.3.6.1 Poland Caprolactam Market, By Application
9.3.6.2 Textile and Automotive Industries are the Major Drivers for the Market
9.3.7 Russia
9.3.7.1 Russia Caprolactam Market, By Application
9.3.7.2 Russian Caprolactam Market is Expected to Grow at A Moderate Rate
9.3.8 Turkey
9.3.8.1 Turkey Caprolactam Market, By Application
9.3.8.2 Rapid Urbanization and Diversification are Driving the Turkish Caprolactam Market
9.3.9 Rest of Europe
9.3.9.1 Rest of Europe Caprolactam Market, By Application
9.4 North America
9.4.1 North America Caprolactam Market By Application
9.4.2 US
9.4.2.1 US Caprolactam Market, By Application
9.4.2.2 Caprolactam Consumption in the Country is Expected to Increase Due to the Reviving End-Use Industries and Increased Consumer Spending
9.4.3 Mexico
9.4.3.1 Mexico Caprolactam Market, By Application
9.4.3.2 High Export of Electronics Products is Generating A Demand for Caprolactam in the Country
9.4.4 Canada
9.4.4.1 Canada Caprolactam Market, By Application
9.4.4.2 Caprolactam Market is Expected to Remain Tight, Amid Sustained Demand and Supply Issues
9.5 Middle East & Africa
9.5.1 Middle East & Africa Caprolactam Market By Application
9.5.2 Saudi Arabia
9.5.2.1 Saudi Arabia Caprolactam Market, By Application
9.5.2.2 Increasing Population and Urbanization are Expected to Drive the Market in the Country
9.5.3 Qatar
9.5.3.1 Qatar Caprolactam Market, By Application
9.5.3.2 Increasing Infrastructural Development is Likely to Boost the Market During the Forecast Period
9.5.3 South Africa
9.5.3.1 South Africa Caprolactam Market, By Application
9.5.3.2 New Investments in the Automotive and Packaging Film Industries are Expected to Contribute to the Caprolactam Market Growth
9.5.4 Rest of Middle East & Africa
9.5.4.1 Rest of Mea Caprolactam Market, By Application
9.6 South America
9.6.1 South America By Application
9.6.2 Brazil
9.6.2.1 Brazil Caprolactam Market, By Application
9.6.2.2 Easy Availability of Resources and Government Initiatives are Helping the Growth of the Caprolactam Market in the Country
9.6.3 Argentina
9.6.3.1 Argentina Caprolactam Market, By Application
9.6.3.2 Vehicles Sales is Expected to Increase During the Forecast Period, Thereby Driving the Market for Caprolactam
9.6.3 Columbia
9.6.3.1 Columbia Caprolactam Market, By Application
9.6.3.2 Demographic Shifts and Urbanization are Expected to Increase the Demand From End-Use Industries
9.6.4 Rest of South America
9.6.4.1 Rest of South America Caprolactam Market, By Application
10 Competitive Landscape (Page No. - 138)
10.1 Introduction
10.2 Competitive Leadership Mapping
10.2.1 Terminology/Nomenclature
10.2.1.1 Visionary Leaders
10.2.1.2 Innovators
10.2.1.3 Emerging Companies
10.2.1.4 Dynamic Differentiators
10.3 CAPACity Analysis
10.3.1 APAC
10.3.2 Europe
10.3.3 North America
10.4 Competitive Scenario
10.4.1 Investment & Expansion
10.4.2 Contract & Agreement, Partnership & Collaboration
10.4.3 Merger & Acquisition
11 Company Profiles (Page No. - 159)
11.1 Advansix Inc.
11.1.1 Business Overview
11.1.2 Products Offered
11.1.3 SWOT Analysis
11.1.4 MnM View
11.2 Alpek S.A.B. De C.V.
11.2.1 Business Overview
11.2.2 Products Offered
11.2.3 SWOT Analysis
11.2.4 MnM View
11.3 The Aquafil Group
11.3.1 Business Overview
11.3.2 Products Offered
11.3.3 Recent Developments
11.3.4 SWOT Analysis
11.3.5 MnM View
11.4 BASF SE
11.4.1 Business Overview
11.4.2 Products Offered
11.4.3 SWOT Analysis
11.4.4 MnM View
11.5 China Petrochemical Development Corporation
11.5.1 Business Overview
11.5.2 Products Offered
11.5.3 SWOT Analysis
11.5.4 MnM View
11.6 Grupa Azoty
11.6.1 Business Overview
11.6.2 Products Offered
11.6.3 SWOT Analysis
11.6.4 MnM View
11.7 Lanxess AG
11.7.1 Business Overview
11.7.2 Products Offered
11.7.3 Recent Developments
11.7.4 SWOT Analysis
11.7.5 MnM View
11.8 China Petroleum and Chemical Corporation (Sinopec)
11.8.1 Business Overview
11.8.2 Products Offered
11.8.3 SWOT Analysis
11.8.4 MnM View
11.9 Sumitomo Chemical Co., Ltd.
11.9.1 Business Overview
11.9.2 Products Offered
11.9.3 SWOT Analysis
11.9.4 MnM View
11.10 Toray Industries, Inc.
11.10.1 Business Overview
11.10.2 Products Offered
11.10.3 SWOT Analysis
11.10.4 MnM View
11.11 UBE Industries, Ltd.
11.11.1 Business Overview
11.11.2 Products Offered
11.11.3 Recent Developments
11.11.4 SWOT Analysis
11.11.5 MnM View
11.12 Capro Co.
11.12.1 Business Overview
11.12.2 Products Offered
11.12.3 MnM View
11.13 DOMO Chemicals
11.13.1 Business Overview
11.13.2 Products Offered
11.13.3 MnM View
11.14 Gujarat State Fertilizers & Chemicals Limited
11.14.1 Business Overview
11.14.2 Products Offered
11.14.3 Recent Developments
11.15 Highsun Group
11.15.1 Business Overview
11.15.2 Products Offered
11.15.3 Recent Developments
11.16 PJSC Kuibyshevazot
11.16.1 Business Overview
11.16.2 Products Offered
11.17 Luxi Chemical Group Co., Ltd.
11.17.1 Business Overview
11.17.2 Products Offered
11.18 Spolana
11.18.1 Business Overview
11.18.2 Products Offered
11.19 Zhejiang Hengyi Group Co., Ltd.
11.19.1 Business Overview
11.19.2 Products Offered
11.19.3 Appendix 192
11.20 Discussion Guide
11.21 Knowledge Store: Marketsandmarkets’ Subscription Portal
11.22 Available Customizations
11.23 Related Reports
11.24 Author Details
List of Tables (137 Tables)
Table 1 Caprolactam Market Snapshot, 2018 vs. 2023
Table 2 Polyamide 6 Films Properties
Table 3 Polyamide Moisture Retention, By Type
Table 4 Properties of Polyamide
Table 5 Polyamide Produced From Bio-Based Sources
Table 6 Caprolactam Import Data, By Country, 2013-2017 (Ton)
Table 7 Caprolactam Export Data, By Country, 2013-2017 (Ton)
Table 8 Caprolactam Market Size, By Application, 2016–2023 (USD Million)
Table 9 Caprolactam Market Size, By Application, 2016–2023 (Kiloton)
Table 10 Caprolactam Market Size in Films Application, By Region, 2016–2023 (USD Million)
Table 11 Caprolactam Market Size in Films Application, By Region, 2016–2023 (Kiloton)
Table 12 Polyamide 6: Application in Films
Table 13 Polyamide 6: Properties and Benefits
Table 14 Caprolactam-Based Films Market Size, By Application, 2016–2023 (USD Million)
Table 15 Caprolactam-Based Films Market Size, By Application, 2016–2023 (Kiloton)
Table 16 Caprolactam-Based Films Market Size in Food Packaging, By Region, 2016–2023 (USD Million)
Table 17 Caprolactam-Based Films Market Size in Food Packaging, By Region, 2016–2023 (Kiloton)
Table 18 Caprolactam-Based Films Market Size in Pharmaceutical Packaging, By Region, 2016–2023 (USD Million)
Table 19 Caprolactam-Based Films Market Size in Pharmaceutical Packaging, By Region, 2016–2023 (Kiloton)
Table 20 Caprolactam-Based Films Market Size in Agricultural Packaging, By Region, 2016–2023 (USD Million)
Table 21 Caprolactam-Based Films Market Size in Agricultural Packaging, By Region, 2016–2023 (Kiloton)
Table 22 Caprolactam-Based Films Market Size in Other Applications, By Region, 2016–2023 (USD Million)
Table 23 Caprolactam-Based Films Market Size in Other Applications, By Region, 2016–2023 (Kiloton)
Table 24 Caprolactam Market Size in Nylon 6 Fibers Application, By Region, 2016–2023 (USD Million)
Table 25 Caprolactam Market Size in Nylon 6 Fibers Application, By Region, 2016–2023 (Kiloton)
Table 26 Polyamide Applications in Textiles and Its Properties
Table 27 Caprolactam-Based Nylon 6 Fibers Market Size, By Application, 2016–2023 (USD Million)
Table 28 Caprolactam-Based Nylon 6 Fibers Market Size, By Application, 2016–2023 (Kiloton)
Table 29 Caprolactam-Based Nylon 6 Fibers Market Size in Textile Filament, By Region, 2016–2023 (USD Million)
Table 30 Caprolactam-Based Nylon 6 Fibers Market Size in Textile Filament, By Region, 2016–2023 (Kiloton)
Table 31 Caprolactam-Based Nylon 6 Fibers Market Size in Industrial Filament, By Region, 2016–2023 (USD Million)
Table 32 Caprolactam-Based Nylon 6 Fibers Market Size in Industrial Filament, By Region, 2016–2023 (Kiloton)
Table 33 Caprolactam-Based Nylon 6 Fibers Market Size in Carpet Filament, By Region, 2016–2023 (USD Million)
Table 34 Caprolactam-Based Nylon 6 Fibers Market Size in Carpet Filament, By Region, 2016–2023 (Kiloton)
Table 35 Caprolactam-Based Nylon 6 Fibers Market Size in Staple Fiber, By Region, 2016–2023 (USD Million)
Table 36 Caprolactam-Based Nylon 6 Fibers Market Size in Staple Fiber, By Region, 2016–2023 (Kiloton)
Table 37 Caprolactam Market Size in Nylon 6 Engineering Plastics, By Region, 2016–2023 (USD Million)
Table 38 Caprolactam Market Size in Nylon 6 Engineering Plastics, By Region, 2016–2023 (Kiloton)
Table 39 Caprolactam-Based Nylon 6 Engineering Plastics Market Size, By Application, 2016–2023 (USD Million)
Table 40 Caprolactam-Based Nylon 6 Engineering Plastics Market Size, By Application, 2016–2023 (Kiloton)
Table 41 Caprolactam-Based Nylon 6 Engineering Plastics Market Size in Automotive, By Region, 2016–2023 (USD Million)
Table 42 Caprolactam-Based Nylon 6 Engineering Plastics Market Size in Automotive, By Region, 2016–2023 (Kiloton)
Table 43 Applications of Polyamide in Electrical & Electronics Industry
Table 44 Caprolactam-Based Nylon 6 Engineering Plastics Market Size in Electrical & Electronics, By Region, 2016–2023 (USD Million)
Table 45 Caprolactam-Based Nylon 6 Engineering Plastics Market Size in Electrical & Electronics, By Region, 2016–2023 (Kiloton)
Table 46 Caprolactam-Based Nylon 6 Engineering Plastics Market Size in Industrial/Machinery, By Region, 2016–2023 (USD Million)
Table 47 Caprolactam-Based Nylon 6 Engineering Plastics Market Size in Industrial/Machinery, By Region, 2016–2023 (Kiloton)
Table 48 Applications of Polyamide in Consumer Goods Industry
Table 49 Caprolactam-Based Nylon 6 Engineering Plastics Market Size in Consumer Goods, By Region, 2016–2023 (USD Million)
Table 50 Caprolactam-Based Nylon 6 Engineering Plastics Market Size in Consumer Goods, By Region, 2016–2023 (Kiloton)
Table 51 Caprolactam-Based Nylon 6 Engineering Plastics Market Size in Wire & Cable, By Region, 2016–2023 (USD Million)
Table 52 Nylon 6 Engineering Plastics Market Size in Wire & Cable, By Region, 2016–2023 (Kiloton)
Table 53 Caprolactam-Based Nylon 6 Engineering Plastics Market Size in Others, By Region, 2016–2023 (USD Million)
Table 54 Caprolactam-Based Nylon 6 Engineering Plastics Market Size in Others, By Region, 2016–2023 (Kiloton)
Table 55 Caprolactam Market Size in Other Applications, By Region, 2016–2023 (USD Million)
Table 56 Caprolactam Market Size in Other Applications, By Region, 2016–2023 (Kiloton)
Table 57 Caprolactam Market Size, By Region, 2016–2023 (USD Million)
Table 58 Caprolactam Market Size, By Region, 2016–2023 (Kiloton)
Table 59 APAC: Caprolactam Market Size, By Country, 2016–2023 (USD Million)
Table 60 APAC: Caprolactam Market Size, By Country, 2016–2023 (Kiloton)
Table 61 APAC: Caprolactam Market Size, By Application, 2016–2023 (USD Million)
Table 62 APAC: Caprolactam Market Size, By Application, 2016–2023 (Kiloton)
Table 63 Caprolactam Obtained By Major Chinese Players for Various Technologies
Table 64 China: Caprolactam Market Size, By Application, 2016–2023 (USD Million)
Table 65 China: Caprolactam Market Size, By Application, 2016–2023 (Kiloton)
Table 66 Taiwan: Caprolactam Market Size, By Application, 2016–2023 (USD Million)
Table 67 Taiwan: Caprolactam Market Size, By Application, 2016–2023 (Kiloton)
Table 68 South Korea: Caprolactam Market Size, By Application, 2016–2023 (USD Million)
Table 69 South Korea: Caprolactam Market Size, By Application, 2016–2023 (Kiloton)
Table 70 Japan: Caprolactam Market Size, By Application, 2016–2023 (USD Million)
Table 71 Japan: Caprolactam Market Size, By Application, 2016–2023 (Kiloton)
Table 72 India: Caprolactam Market Size, By Application, 2016–2023 (USD Million)
Table 73 India: Caprolactam Market Size, By Application, 2016–2023 (Kiloton)
Table 74 Rest of APAC: Caprolactam Market Size, By Application, 2016–2023 (USD Million)
Table 75 Rest of APAC: Caprolactam Market Size, By Application, 2016–2023 (Kiloton)
Table 76 Europe: Caprolactam Market Size, By Country, 2016–2023 (USD Million)
Table 77 Europe: Caprolactam Market Size, By Country, 2016–2023 (Kiloton)
Table 78 Europe: Caprolactam Market Size, By Application, 2016–2023 (USD Million)
Table 79 Europe: Caprolactam Market Size, By Application, 2016–2023 (Kiloton)
Table 80 Germany: Caprolactam Market Size, By Application, 2016–2023 (USD Million)
Table 81 Germany: Caprolactam Market Size, By Application, 2016–2023 (Kiloton)
Table 82 France: Caprolactam Market Size, By Application, 2016–2023 (USD Million)
Table 83 France: Caprolactam Market Size, By Application, 2016–2023 (Kiloton)
Table 84 UK: Caprolactam Market Size, By Application, 2016–2023 (USD Million)
Table 85 UK: Caprolactam Market Size, By Application, 2016–2023 (Kiloton)
Table 86 Italy: Caprolactam Market Size, By Application, 2016–2023 (USD Million)
Table 87 Italy: Caprolactam Market Size, By Application, 2016–2023 (Kiloton)
Table 88 Belgium: Caprolactam Market Size, By Application, 2016–2023 (USD Million)
Table 89 Belgium: Caprolactam Market Size, By Application, 2016–2023 (Kiloton)
Table 90 Poland: Caprolactam Market Size, By Application, 2016–2023 (USD Million)
Table 91 Poland: Caprolactam Market Size, By Application, 2016–2023 (Kiloton)
Table 92 Russia: Caprolactam Market Size, By Application, 2016–2023 (USD Million)
Table 93 Russia: Caprolactam Market Size, By Application, 2016–2023 (Kiloton)
Table 94 Turkey: Caprolactam Market Size, By Application, 2016–2023 (USD Million)
Table 95 Turkey: Caprolactam Market Size, By Application, 2016–2023 (Kiloton)
Table 96 Rest of Europe: Caprolactam Market Size, By Application, 2016–2023 (USD Million)
Table 97 Rest of Europe: Caprolactam Market Size, By Application, 2016–2023 (Kiloton)
Table 98 North America: Caprolactam Market Size, By Country, 2016–2023 (USD Million)
Table 99 North America: Caprolactam Market Size, By Country, 2016–2023 (Kiloton)
Table 100 North America: Caprolactam Market Size, By Application, 2016–2023 (USD Million)
Table 101 North America: Caprolactam Market Size, By Application, 2016–2023 (Kiloton)
Table 102 US: Caprolactam Market Size, By Application, 2016–2023 (USD Million)
Table 103 US: Caprolactam Market Size, By Application, 2016–2023 (Kiloton)
Table 104 Mexico: Caprolactam Market Size, By Application, 2016–2023 (USD Million)
Table 105 Mexico: Caprolactam Market Size, By Application, 2016–2023 (Kiloton)
Table 106 Canada: Caprolactam Market Size, By Application, 2016–2023 (USD Million)
Table 107 Canada: Caprolactam Market Size, By Application, 2016–2023 (Kiloton)
Table 108 Middle East & Africa: Caprolactam Market Size, By Country, 2016–2023 (USD Million)
Table 109 Middle East & Africa: Caprolactam Market Size, By Country, 2016–2023 (Kiloton)
Table 110 Middle East & Africa: Caprolactam Market Size, By Application, 2016–2023 (USD Million)
Table 111 Middle East & Africa: Caprolactam Market Size, By Application, 2016–2023 (Kiloton)
Table 112 Saudi Arabia: Caprolactam Market Size, By Application, 2016–2023 (USD Million)
Table 113 Saudi Arabia: Caprolactam Market Size, By Application, 2016–2023 (Kiloton)
Table 114 Qatar: Caprolactam Market Size, By Application, 2016–2023 (USD Million)
Table 115 Qatar: Caprolactam Market Size, By Application, 2016–2023 (Kiloton)
Table 116 South Africa: Caprolactam Market Size, By Application, 2016–2023 (USD Million)
Table 117 South Africa: Caprolactam Market Size, By Application, 2016–2023 (Kiloton)
Table 118 Rest of Middle East & Africa: Caprolactam Market Size, By Application, 2016–2023 (USD Million)
Table 119 Rest of Middle East & Africa: Caprolactam Market Size, By Application, 2016–2023 (Kiloton)
Table 120 South America: Caprolactam Market Size, By Country, 2016–2023 (USD Million)
Table 121 South America: Caprolactam Market Size, By Country, 2016–2023 (Kiloton)
Table 122 South America: Caprolactam Market Size, By Application, 2016–2023 (USD Million)
Table 123 South America: Caprolactam Market Size, By Application, 2016–2023 (Kiloton)
Table 124 Brazil: Caprolactam Market Size, By Application, 2016–2023 (USD Million)
Table 125 Brazil: Caprolactam Market Size, By Application, 2016–2023 (Kiloton)
Table 126 Argentina: Caprolactam Market Size, By Application, 2016–2023 (USD Million)
Table 127 Argentina: Caprolactam Market Size, By Application, 2016–2023 (Kiloton)
Table 128 Colombia: Caprolactam Market Size, By Application, 2016–2023 (USD Million)
Table 129 Colombia: Caprolactam Market Size, By Application, 2016–2023 (Kiloton)
Table 130 Rest of South America: Caprolactam Market Size, By Application, 2016–2023 (USD Million)
Table 131 Rest of South America: Caprolactam Market Size, By Application, 2016–2023 (Kiloton)
Table 132 Caprolactam: APAC CAPACity Share, By Key Players, 2017
Table 133 Caprolactam: Europe CAPACity Share, By Key Players, 2017
Table 134 Caprolactam: North America CAPACity Share, By Key Players, 2017
Table 135 Investment & Expansion, 2015–2018
Table 136 Contract & Agreement, Partnership & Collaboration, 2015–2018
Table 137 Merger & Acquisition, 2015–2018
List of Figures (54 Figures)
Figure 1 Caprolactam Market Segmentation
Figure 2 Caprolactam Market: Research Design
Figure 3 Market Size Estimation: Bottom-Up Approach
Figure 4 Market Size Estimation: Top-Down Approach
Figure 5 Caprolactam Market: Data Triangulation
Figure 6 Nylon 6 Fibers to Be the Fastest-Growing Application of Caprolactam
Figure 7 APAC to Lead the Caprolactam Market
Figure 8 Emerging Economies to Offer Lucrative Growth Opportunities for Market Players
Figure 9 Nylon 6 Fibers Segment to Register the Highest Cagr
Figure 10 Caprolactam Market to Grow at A Faster Rate in Developing Countries
Figure 11 China to Dominate the Caprolactam Market
Figure 12 India to Register the Highest Cagr in the Global Market
Figure 13 Drivers, Restraints, Opportunities, and Challenges: Caprolactam Market
Figure 14 West Texas Intermediate (Wti) Crude Oil Price Trend From 2007 to 2017
Figure 15 Porter’s Five Forces Analysis: Caprolactam Market
Figure 16 Various Production Processes of Caprolactam
Figure 17 Caprolactam and Nylon 6 Price Rollover Despite Drop in Benzene
Figure 18 Comparison of Classical and New Routes for the Preparation of Caprolactam Starting From Benzene
Figure 19 Bio-Based Caprolactam Routes
Figure 20 Nylon 6 Fibers Segment to Register the Highest Cagr
Figure 21 Film Polymer Property Comparison
Figure 22 Types of Polyamide Fibers
Figure 23 US to Be the Fastest-Growing Caprolactam Market
Figure 24 APAC: Caprolactam Market Snapshot
Figure 25 Rise in Demand for Nylon 6 Engineering Plastics to Drive the Caprolactam Market in Europe
Figure 26 North America: Caprolactam Market Snapshot
Figure 27 Saudi Arabia to Be the Largest Market for Caprolactam in the Region
Figure 28 Increasing Demand From Textile and Automotive Industries to Drive the Caprolactam Market in South America
Figure 29 Global Caprolactam Market Competitive Leadership Mapping, 2017
Figure 30 Companies Adopted Investment & Expansion as the Key Growth Strategy Between 2015 and 2018
Figure 31 Advansix: Company Snapshot
Figure 32 Advansix: SWOT Analysis
Figure 33 Alpek: Company Snapshot
Figure 34 Alpek: SWOT Analysis
Figure 35 The Aquafil Group: Company Snapshot
Figure 36 The Aquafil Group: SWOT Analysis
Figure 37 BASF SE: Company Snapshot
Figure 38 BASF SE: SWOT Analysis
Figure 39 China Petrochemical Development Corporation: Company Snapshot
Figure 40 China Petrochemical Development Corporation: SWOT Analysis
Figure 41 Grupa Azoty: Company Snapshot
Figure 42 Grupa Azoty: SWOT Analysis
Figure 43 Lanxess AG: Company Snapshot
Figure 44 Lanxess AG: SWOT Analysis
Figure 45 China Petroleum and Chemical Corporation (Sinopec): Company Snapshot
Figure 46 China Petroleum and Chemical Corporation (Sinopec): SWOT Analysis
Figure 47 Sumitomo Chemical: Company Snapshot
Figure 48 Sumitomo Chemical: SWOT Analysis
Figure 49 Toray Industries: Company Snapshot
Figure 50 Toray Industries: SWOT Analysis
Figure 51 UBE Industries: Company Snapshot
Figure 52 UBE Industries: SWOT Analysis
Figure 53 Capro: Company Snapshot
Figure 54 Gujarat State Fertilizers & Chemicals Limited: Company Snapshot
The study involved four major activities in estimating the current market size for caprolactam. Exhaustive secondary research was done to collect information on the market, the peer market, and the parent market. The next step was to validate these findings, assumptions, and sizing with industry experts across the value chain through primary research. Both top-down and bottom-up approaches were employed to estimate the complete market size. Thereafter, market breakdown and data triangulation were used to estimate the market size of the segments and the subsegments.
Secondary Research
In the secondary research process, various secondary sources such as Hoovers, Bloomberg BusinessWeek were referred to for identifying and collecting information for this study. These secondary sources included annual reports, press releases & investor presentations of companies; white papers; certified publications; articles by recognized authors; gold standard & silver standard websites; regulatory bodies; trade directories; and databases.
Primary Research
The caprolactam market comprises several stakeholders such as raw material suppliers, processors, end-product manufacturers, and regulatory organizations. The demand side for this market is characterized by the development of nylon 6 fibers, nylon 6 engineering plastics, films, and other applications and the growth in population. The supply side is characterized by advancements in diverse applications. Various primary sources from both the supply and demand sides of the market were interviewed to obtain qualitative and quantitative information. Following is the breakdown of primary respondents:
To know about the assumptions considered for the study, download the pdf brochure
Market Size Estimation
Both the top-down and bottom-up approaches were used to estimate and validate the overall size of the caprolactam market. These methods were also used extensively to estimate the size of various subsegments in the market. The research methodology used to estimate the market size includes the following:
- The key players in the industry were identified through extensive secondary research.
- The industry’s supply chain and market size, in terms of value, were determined through primary and secondary research processes.
- All percentage shares, splits, and breakdowns were determined using secondary sources and verified through primary sources.
Data Triangulation
After arriving at the overall market size—using the market size estimation processes as explained above—the market was split into several segments and subsegments. In order to complete the overall market engineering process and arrive at the exact statistics of each market segment and subsegment, the data triangulation and market breakdown procedures were employed, wherever applicable. The data was triangulated by studying various factors and trends from both the demand and supply sides of the nylon 6 fibers, nylon 6 engineering plastics, films, and others.
Report Objectives
- To define, describe, and forecast the global market size of caprolactam
- To provide detailed information about the key factors influencing the growth of the market (drivers, restraints, opportunities, and challenges)
- To analyze the micromarkets with respect to individual growth trends, future prospects, and their contribution to the overall market
- To understand the structure of the caprolactam market by identifying its various subsegments
- To project the size of the market and its submarkets, in terms of value, with respect to the five regions (along with their respective key countries)
- To profile key players and comprehensively analyze their core competencies
- To understand the competitive landscape and identify major growth strategies adopted by players across key regions
- To analyze the competitive developments such as investment & expansion, merger & acquisition, and contract & agreement, and partnership & collaboration in the caprolactam market
Available Customizations:
With the given market data, MarketsandMarkets offers customizations according to the company’s specific needs.
The following customization options are available for the report:
Product Analysis:
- Product matrix, which gives a detailed comparison of the product portfolio of each company
Regional Analysis:
- Further breakdown of a specific country based on application
Company Information:
- Detailed analysis and profiling of additional market players (up to five)


Growth opportunities and latent adjacency in Caprolactam Market
Specific information on polyethylene market in US
Interested in Global Polymer Nanocomposites market
Market trends on global Caprolactum market