Counterfeit Money Detection Market by Product (Coin & Currency Counter, Currency Sorter, Currency Detector, & Pen), Technology (Ultraviolet, Infrared, Magnetic, Watermark, & Microprint), Industry, End Device, and Geography - Global Forecast to 2020


The counterfeit money detection market is expected to reach USD 3.11 Billion by 2020, growing at a CAGR of 6.9% between 2015 and 2020. Various government laws and enforcements to prevent the circulation of fake currency notes is driving the growth of the counterfeit money detection market. The base year considered is 2014, and the forecast period considered for the market is between 2015 and 2020.
Globally, the growing number of fraudulent activities and circulation of fake currencies across various sectors such as retail, gaming, and banking are also the prime causes of the growth of this said market. The growth in new retail automated products, such as mobile point-of-sale terminals, is creating new growth avenues for this market. The report covers the major segments of the market which are product, technology, industry, end device, and geography. The market size estimations for these segments are provided in this report; the key trends and market dynamics related to these segments are also covered under separate chapters for these segments.
The counterfeit money detection market is expected to reach USD 3.11 Billion by 2020, growing at a CAGR of 6.9% between 2015 and 2020. The growth of this market is driven by initiatives taken by various governments to implement the counterfeit money detectors to prevent the circulation of fake currency. On a global level, the growing number of fraudulent activities and circulation of fake currency across sectors such as retail, gaming, and banking are also the prime causes for the growth of this said market. The growth in new retail automated products, such as mobile point-of-sale terminals, is creating opportunities for this market.
The retail industry is expected to dominate the market for counterfeit money detection. However, the transportation industry is expected to witness the highest growth rate during the forecast period. The increasing deployment of kiosks and vending machines at various transportation facilities such as airports and railway stations is the major driver for the increasing demand for counterfeit money detectors in the transportation industry.
Various technologies such as ultraviolet, infrared, magnetic, watermark, microprint, and so on are integrated with the currency detecting devices. Among these, ultraviolet technology is the most popular technology because of its high rate of accuracy for finding a counterfeit note. The magnetic technology is expected to have the highest growth rate. The magnetic properties are monitored with more advanced sensors to detect the genuineness of the banknote. Among the wide range of products offered by various market players, currency sorter is expected to register a high growth rate during the forecast period.
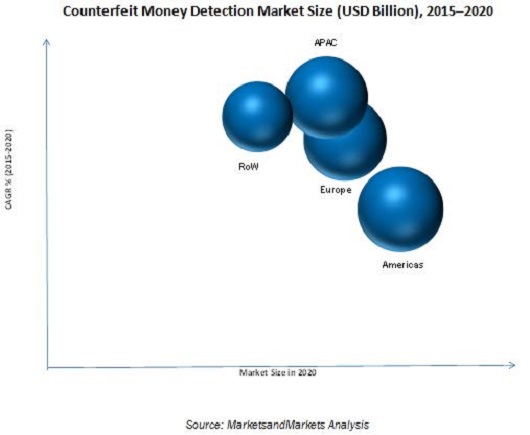
North America is expected to hold the largest share of the counterfeit money detection market during the forecast period, and the market in APAC is expected to grow at the highest CAGR during the forecast period. This growth of the market in APAC can be attributed to the nations such as Japan, China, and Australia. The market in APAC is at the growth stage, and the ongoing developments in this region make it a lucrative and high-potential market.
Sometimes, the detecting machines fail to find the counterfeit currency notes due to tricky methods adapted by the skilled counterfeiters, causing a low accuracy level or failure shown by detectors, so the growth of the market could be hindered. The major players in this market include Crane Payment Innovations (U.S.), Glory Global Solutions (Japan), Japan Cash Machine Co., Ltd. (Japan), Cummins Allison Corp. (U.S.), Fraud Fighter (U.S.), Cassida Corporation (U.S.), and Royal Sovereign (U.S.) among others. These players adopted various strategies such as new product developments, mergers, partnerships, collaborations, and business expansions to enhance their presence in the counterfeit money detection market. Since the last three years, new product development strategy has been found to be the key strategies adopted by the market players to enhance their leadership in this ecosystem.
 Exclusive indicates content/data unique to MarketsandMarkets and not available with any competitors.
Table of Contents
1 Introduction (Page No. - 14)
1.1 Objectives of the Study
1.2 Market Definition
1.3 Market Scope
1.3.1 Markets Covered
1.3.2 Years Considered for the Study
1.4 Currency
1.5 Limitations
1.6 Stakeholders
2 Research Methodology (Page No. - 18)
2.1 Research Data
2.1.1 Secondary Data
2.1.1.1 Key Data From Secondary Sources
2.1.2 Primary Data
2.1.2.1 Key Data From Primary Sources
2.1.2.2 Key Industry Insights
2.1.2.3 Breakdown of Primaries
2.2 Factor Analysis of the Counterfeit Money Detection Market
2.2.1 Introduction
2.2.2 Demand-Side Analysis
2.2.2.1 Increase in the Retail Automation Products
2.2.2.2 Growing Concerns of Governments Towards Safety
2.3 Market Size Estimation
2.4 Market Breakdown & Data Triangulation
2.5 Research Assumptions
2.5.1 Assumptions
3 Executive Summary (Page No. - 28)
4 Premium Insights (Page No. - 34)
4.1 Attractive Opportunities in the Counterfeit Money Detection Market
4.2 Market, By Product
4.3 Market in Asia-Pacific
4.4 U.S.Held the Largest Share of the Global Counterfeit Money Detection Market (2014)
4.5 Market, By End Device
4.6 The Life Cycle Analysis, By Geography
5 Market Overview (Page No. - 38)
5.1 Introduction
5.2 Market Segmentation
5.2.1 Counterfeit Money Detection Market, By Industry
5.2.2 Market, By Technology
5.2.3 Market, By Product
5.2.4 Market, By End Device
5.3 Market Dynamics
5.3.1 Drivers
5.3.1.1 Government Enforcements to Prevent the Circulation of Counterfeit Money
5.3.1.2 Increased Number of Monetary Fraudulent Activities in Retail Outlets, Casinos, and Airports
5.3.2 Restraints
5.3.2.1 Inefficiency of Machines in Detecting Counterfeit Currency Notes
5.3.2.2 Requirement of Continuous Power Supply
5.3.3 Opportunities
5.3.3.1 Growth in New Retail Automated Products
5.3.4 Challenges
5.3.4.1 to Overpower the Skilled Counterfeiters and Their Illegitimate Techniques
6 Industry Trends (Page No. - 48)
6.1 Introduction
6.2 Value Chain Analysis
6.3 Porter’s Five Forces Analysis
6.3.1 Intensity of Competitive Rivalry
6.3.2 Threat of Substitutes
6.3.3 Bargaining Power of Buyers
6.3.4 Bargaining Power of Suppliers
6.3.5 Threat of New Entrants
7 Counterfeit Money Detection Market, By Product (Page No. - 56)
7.1 Introduction
7.2 Coin and Currency Counters
7.3 Currency Sorters
7.4 Currency Detectors
7.5 Pens
7.6 Others
8 Counterfeit Money Detection Market, By Technology (Page No. - 73)
8.1 Introduction
8.2 Ultraviolet
8.3 Infrared
8.4 Magnetic
8.5 Watermark
8.6 Microprint
8.7 Other Technologies
9 Counterfeit Money Detection Market, By Industry (Page No. - 85)
9.1 Introduction
9.2 Retail
9.2.1 Point-Of-Sale Front Counter
9.2.2 Self-Checkout Counters
9.2.3 Retail Safe
9.3 Banking
9.4 Gaming
9.4.1 Casinos
9.4.2 Amusement Parks
9.5 Transportation
9.6 Hotel
9.7 Other Industries
10 Counterfeit Money Detection Market, By End Device (Page No. - 97)
10.1 Introduction
10.2 Kiosks
10.3 Self-Checkout Machines
10.4 Gaming Machines
10.5 Vehicle Parking Machines
10.6 Automatic Fare Collection Machines
10.7 Vending Machines
11 Geographic Analysis (Page No. - 106)
11.1 Introduction
11.2 North America
11.2.1 U.S.
11.2.2 Canada
11.2.3 Mexico
11.3 Europe
11.3.1 U.K.
11.3.2 Germany
11.3.3 France
11.3.4 Italy
11.4 Asia-Pacific
11.4.1 Australia
11.4.2 China
11.4.3 Japan
11.4.4 India
11.4.5 South Korea
11.5 Rest of the World (RoW)
12 Competitive Landscape (Page No. - 123)
12.1 Overview
12.2 Ranking for the Counterfeit Money Detection Market, 2014
12.3 Competitive Scenario
12.4 Competitive Trends
12.4.1 New Product Launches and Developments, 2015
12.4.2 Partnerships, Contracts, & Agreements, 2013–2015
12.4.3 Acquisitions, 2014–2015
12.4.4 Expansions & Others, 2015
13 Company Profiles (Page No. - 129)
(Overview, Products and Services, Financials, Strategy & Development)*
13.1 Introduction
13.2 Glory Ltd.
13.3 Cummins Allison Corp.
13.4 Innovative Technology Ltd.
13.5 Crane Payment Innovations
13.6 Cassida Corporation
13.7 Japan Cash Machine Co., Ltd.
13.8 Accubanker
13.9 DRI Mark Products Inc.
13.10 Fraud Fighter
13.11 Royal Sovereign International Inc.
13.12 Semacon Business Machines, Inc.
*Details on Overview, Products and Services, Financials, Strategy & Development Might Not Be Captured in Case of Unlisted Companies
14 Appendix (Page No. - 149)
14.1 Insights of Industry Experts
14.2 Discussion Guide
14.3 Introducing RT: Real-Time Market Intelligence
14.4 Available Customizations
14.5 Related Reports
List of Tables (71 Tables)
Table 1 Power Input to Counterfeit Money Detectors By Various Manufacturers
Table 2 The Porter’s Five Forces Analysis: Bargaining Power of Suppliers is Likely to Have A High Impact on the Overall Market, 2014
Table 3 Counterfeit Money Detection Market, By Product, 2013–2020 (USD Million)
Table 4 Market, By Product, 2013–2020 (Million Units)
Table 5 Counterfeit Money Detection Market for Coin & Currency Counters, By Technology, 2013–2020 (USD Million)
Table 6 Market for Coin & Currency Counters, By Industry, 2013–2020 (USD Million)
Table 7 Market for Coin & Currency Counters, By Region, 2013–2020 (USD Million)
Table 8 Market for Coin & Currency Counters, By Region, 2013–2020 (Million Units)
Table 9 Counterfeit Money Detection Market for Currency Sorters, By Technology, 2013–2020 (USD Million)
Table 10 Market for Currency Sorters, By Industry, 2013–2020 (USD Million)
Table 11 Market for Currency Sorters, By Region, 2013–2020 (USD Million)
Table 12 Market for Currency Sorters, By Region, 2013–2020 (Million Units)
Table 13 Market for Currency Detectors, By Technology, 2013–2020 (USD Million)
Table 14 Market for Currency Detectors, By Industry, 2013–2020 (USD Million)
Table 15 Market for Currency Detectors, By Region, 2013–2020 (USD Million)
Table 16 Market for Currency Detectors, By Region, 2013–2020 (Million Units)
Table 17 Counterfeit Money Detection Market for Pens, By Technology, 2013–2020 (USD Million)
Table 18 Counterfeit Money Detection Marker for Pens, By Industry, 2013–2020 (USD Million)
Table 19 Market for Pens, By Region, 2013–2020 (USD Million)
Table 20 Counterfeit Money Detection Marker for Pens, By Region, 2013–2020 (Million Units)
Table 21 Counterfeit Money Detection for Other Products, By Technology, 2013–2020 (USD Million)
Table 22 Counterfeit Money Detection Market for Other Products, By Industry, 2013–2020 (USD Million)
Table 23 Market for Other Products, By Region, 2013–2020 (USD Million)
Table 24 Counterfeit Money Detection for Other Products, By Region, 2013–2020 (Million Units)
Table 25 Counterfeit Money Detection Market, By Technology, 2013–2020 (USD Million)
Table 26 Counterfeit Money Detection Marker for Ultraviolet Technology, By End Device, 2013–2020 (USD Million)
Table 27 Counterfeit Money Detection Market for Ultraviolet Technology, By Product, 2013–2020 (USD Million)
Table 28 Market for Infrared Technology, By End Device, 2013–2020 (USD Million)
Table 29 Counterfeit Money Detection Markert for Infrared Technology, By Product, 2013–2020 (USD Million)
Table 30 Counterfeit Money Detection Market for Magnetic Technology, By End Device, 2013–2020 (USD Million)
Table 31 Market for Magnetic Technology, By Product, 2013–2020 (USD Million)
Table 32 Counterfeit Money Detection Market for Watermark Technology, By End Device, 2013–2020 (USD Million)
Table 33 Market for Watermark Technology, By Product, 2013–2020 (USD Million)
Table 34 Counterfeit Money Detection Market for Microprint Technology, By End Device, 2013–2020 (USD Million)
Table 35 Market for Microprint Technology, By Product, 2013–2020 (USD Million)
Table 36 Counterfeit Money Detection Market for Other Technologies, By End Device, 2013–2020 (USD Million)
Table 37 Counterfeit Money Detection for Other Technologies, By Product, 2013–2020 (USD Million)
Table 38 Counterfeit Money Detection Market, By Industry, 2013–2020 (USD Million)
Table 39 Market for Retail Industry, By Region, 2013–2020 (USD Million)
Table 40 Market for Retail Industry, By Product, 2013–2020 (USD Million)
Table 41 Counterfeit Money Detection Market for Banking Industry, By Region, 2013–2020 (USD Million)
Table 42 Market for Banking Industry, By Product, 2013–2020 (USD Million)
Table 43 Counterfeit Money Detection Market for Gaming Industry, By Region, 2013–2020 (USD Million)
Table 44 Market for Gaming Industry, By Product, 2013–2020 (USD Million)
Table 45 Counterfeit Money Detection Market for Transportation Industry, By Region, 2013–2020 (USD Million)
Table 46 Market for Transportation Industry, By Product, 2013–2020 (USD Million)
Table 47 Counterfeit Money Detection Market for Hotel Industry, By Region, 2013–2020 (USD Million)
Table 48 Market for Hotel Industry, By Product, 2013–2020 (USD Million)
Table 49 Counterfeit Money Detection Market for Other Industries, By Region, 2013–2020 (USD Million)
Table 50 Market for Other Industries, By Product, 2013–2020 (USD Million)
Table 51 Counterfeit Money Detection Market, By End Device, 2013–2020 (USD Million)
Table 52 Market for Kiosks, By Technology, 2013–2020 (USD Million)
Table 53 Market for Self-Checkout Machines, By Technology, 2013–2020 (USD Million)
Table 54 Market for Gaming Machines, By Technology, 2013–2020 (USD Million)
Table 55 Market for Vehicle Parking Machines, By Technology, 2013–2020 (USD Million)
Table 56 Market for Automatic Fare Collection Machines, By Technology, 2013–2020 (USD Million)
Table 57 Market for Vending Machines, By Technology, 2013–2020 (USD Million)
Table 58 Counterfeit Money Detection Market, By Region, 2013–2020 (USD Million )
Table 59 North America: Counterfeit Detection Market , By Country, 2013–2020 (USD Million)
Table 60 North America: Counterfeit Money Detection Market, By Industry, 2013–2020 (USD Million)
Table 61 Europe: Counterfeit Detection Market, By Country, 2013–2020 (USD Million)
Table 62 Europe: Counterfeit Money Detection Market, By Industry, 2013–2020 (USD Million)
Table 63 APAC: Market, By Country, 2013–2020 (USD Million)
Table 64 APAC: Market, By Industry, 2013–2020 (USD Million)
Table 65 RoW: Market, By Country, 2013–2020 (USD Million)
Table 66 RoW: Market, By Industry, 2013–2020 (USD Million)
Table 67 Ranking of the Top 5 Players in the Counterfeit Money Detection Market, 2014
Table 68 New Product Launches, 2015
Table 69 Partnerships, Contracts, & Agreements, 2013–2015
Table 70 Acquisitions, 2014–2015
Table 71 Expansions & Others, 2015
List of Figures (68 Figures)
Figure 1 Counterfeit Money Detection Market
Figure 2 Market: Research Design
Figure 3 Growth of Retail Point of Sale Terminals, 2014–2020
Figure 4 Market Size Estimation Methodology: Bottom-Up Approach
Figure 5 Market Size Estimation Methodology: Top-Down Approach
Figure 6 Data Triangulation
Figure 7 Currency Sorters Expected to Grow at the Highest Rate in the Market During the Forecast Period
Figure 8 Ultraviolet Technology Estimated to Hold A Large Market Size of the Global Market in 2015
Figure 9 Transportation Industry Expected to Grow at the Highest Rate During the Forecast Period
Figure 10 The Market for Self-Checkout Machines Expected to Grow at the Highest Rate During the Forecast Period
Figure 11 North America Estimated to Hold the Largest Share of the Counterfeit Money Detection Market in 2015
Figure 12 The Counterfeit Money Detection System is Expected to Be Increasingly Adopted in the APAC Region Between 2015 and 2020
Figure 13 Currency Detectors Expected to Hold the Largest Market Share During the Forecast Period
Figure 14 The Asia-Pacific Market for the Retail Sector is Expected to Hold the Largest Share in 2014
Figure 15 U.S. Dominated the Global Counterfeit Money Detection Market in 2014
Figure 16 Kiosks are Likely to Dominate the Counterefit Money Detection Market During the Forecast Period
Figure 17 APAC Estimated to Be in the Growth Phase During the Forecast Period
Figure 18 Market, By Geography
Figure 19 Laws & Enforcements By the Government to Prevent the Circulation of Counterfeit Money is Expected to Drive the Market During the Forecast Period
Figure 20 Arrests Made for Counterfeiting U.S. Money, 2007–2011
Figure 21 Overall Removal of Counterfeit Money Per Year in the U.S. and Europe
Figure 22 Value Chain Analysis (2014): Major Value is Added During the Manufacturing and Assembly Phases
Figure 23 The Porter’s Five Forces Analysis (2014)
Figure 24 Counterfeit Money Detection Market: Porter’s Five Forces Analysis, 2014
Figure 25 Intensity of Competitive Rivalry is Medium Due to the Low Industry Growth Rate
Figure 26 Threat of Substitutes to Be Low as No Major Substitute Product Available for Counterfeit Money Detection
Figure 27 Bargaining Power of Buyers Would Be Medium as the Switching Cost is High
Figure 28 Bargaining Power of Suppliers Expected to Be High as the Switching Cost for the Manufacturer From One Supplier to Other is High
Figure 29 Threat of New Entrants is Medium as the Switching Cost for the Buyer is High
Figure 30 Counterfeit Money Detection Market, By Product
Figure 31 Currency Detector Expected to Dominate the Market During the Forecast Period
Figure 32 Retail Industry Expected to Dominate the Counterfiet Money Detection Market for Coin & Currency Counters During the Forecast Period
Figure 33 Counterfeit Money Detection Market in APAC for Currency Sorters Expected to Grow at the Highest Rate During 2015–2020
Figure 34 Counterfeit Money Detection Market in APAC for Currency Detectors Expected to Grow at the Highest Rate During the Forecast Period
Figure 35 Ultraviolet Technology Expected to Dominate the Counterfeit Detection Market for Pens During the Forecast Period
Figure 36 Counterfeit Money Detection Market, By Technology
Figure 37 Market for Magnetic Technology Expected to Grow at the Highest Rate During the Forecast Period
Figure 38 Counterfeit Money Detection Market for Self-Checkout Machines Integrated With Infrared Technology Expected to Grow at the Highest Rate During the Forecast Period
Figure 39 Market for Currency Sorters Integrated With Magnetic Technology Expected to Grow at the Highest Rate During the Forecast Period
Figure 40 Counterfeit Money Detection Market, By Industry
Figure 41 The Market for the Transportation Industry Expected to Grow at the Highest Rate During the Forecast Period
Figure 42 Counterfeit Money Detection Market for Currency Sorters Deployed in the Retail Industry Would Grow at the Highest Rate During the Forecast Period
Figure 43 Market in APAC for Gaming Industry Expected to Grow at the Highest Rate During the Forecast Period
Figure 44 Currency Detectors Expected to Dominate the Transportation Industry During the Forecast Period
Figure 45 Counterfeit Money Detection Market, By End Device
Figure 46 Market for Self-Checkout Machines Estimated to Grow at the Highest Rate During the Forecast Period
Figure 47 The Kiosk Market for Magnetic Technology Expected Grow at the Highest Rate During the Forecast Period
Figure 48 Vending Machines Integrated With Ultraviolet Technology Would Dominate the Market During the Forecast Period
Figure 49 Counterfeit Money Detection Market, By Region
Figure 50 Geographic Snapshot for the Counterfeit Money Detection Market, 2015–2020
Figure 51 Market Segmentation: North America
Figure 52 Snapshot of the North American Market
Figure 53 Counterfeit Money Detection Market Segmentation: Europe
Figure 54 Snapshot of the European Market
Figure 55 Market Segmentation: Asia-Pacific
Figure 56 Snapshot of the APAC Market
Figure 57 Counterfeit Money Detection Market Segmentation: RoW
Figure 58 Snapshot of the RoW Market
Figure 59 Key Growth Strategies Adopted By Top Companies Between 2013 and 2015
Figure 60 Market Evaluation Framework - New Product Launches Fuelled Growth and Innovation in 2014 and 2015
Figure 61 Battle for Market Share: New Product Launches Was the Key Strategy
Figure 62 Glory Ltd.: Company Snapshot
Figure 63 Glory Ltd.: SWOT Analysis
Figure 64 Cummins Allison Corp.: SWOT Analysis
Figure 65 Innovative Technology Ltd.: SWOT Analysis
Figure 66 Crane Payment Innovations: SWOT Analysis
Figure 67 Cassida Corporation: SWOT Analysis
Figure 68 Japan Cash Machine Co., Ltd.: Company Snapshot
This research study also involves the extensive use of secondary sources, directories, and databases (such as Hoovers, Bloomberg Business, Factiva, and OneSource) to identify and collect information useful for this study. The research methodology is explained below.
- Analysis of all the industries in which counterfeit money detection systems are used worldwide
- Analysis of various counterfeit money detection devices sold in different regions and the technologies used in the devices
- Estimation of percentage share of counterfeit money detection in terms of product, technology, industry, end device, and geography
- Analysis of the market trends in various regions and countries, supported by the ongoing R&D in these regions
- Overall market size finalized by triangulation with supply-side data including product developments, supply chain, and estimated sales of counterfeit money detection systems
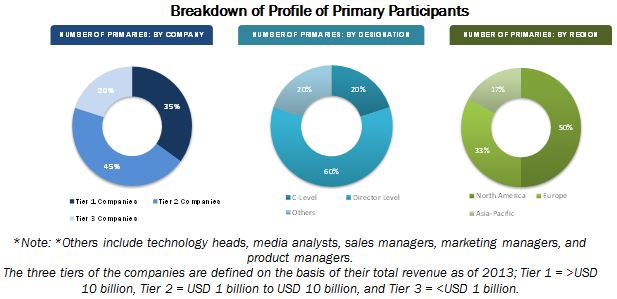
After arriving at the overall market size, the total market has been split into several segments and subsegments and confirmed with the key industry experts. The figure below shows the breakdown of primaries on the basis of company type, designation, and region conducted during the research study.
This report provides valuable insights regarding ecosystem of this market such as chip & other component manufacturers, original equipment manufacturers (OEMs), system integrators, and end users. The key players of counterfeit money detection systems are Crane Payment Innovations (U.S.), Glory Global Solutions (Japan), Japan Cash Machine Co., Ltd. (Japan), Cummins Allison Corp. (U.S.), Cassida Corporation (U.S.), and Royal Sovereign (U.S.) among others.
Target Audience
- Managed security service providers
- Component manufacturers
- Technology providers
- System integrators
- IC manufacturers
- Device manufacturers
- Distributors
The market covered in this report has been segmented as follows:
Counterfeit Money Detection Market, by Product:
- Coin & Currency Counters
- Currency Sorters
- Currency Detectors
- Pens
- Others
Counterfeit Money Detection Market, by Technology:
- Ultraviolet
- Infrared
- Magnetic
- Watermark
- Microprint
- Others
Counterfeit Money Detection Market, by Industry:
- Retail
- Banking
- Gaming
- Transportation
- Hotels
- Others
Counterfeit Money Detection Market, by End Device:
- Kiosks
- Self-Checkout Machines
- Gaming Machines
- Vehicle Parking Machines
- Automatic Fare Collection Machines
- Vending Machines
Counterfeit Money Detection Market, by Geography:
- North America
- Europe
- APAC
- RoW
Available customizations:
With the given market data, MarketsandMarkets offers the following customization options available for the report.
Geographical Analysis
- Country-wise breakdown of all the regions by industry
Company Information
- Detailed analysis and profiling of additional market players (up to five)


Growth opportunities and latent adjacency in Counterfeit Money Detection Market
I am interested in understanding the market for Counterfeit Money Detector market in APAC. Also, I would like to know more about the Counterfeit Money Detector market for specific countries in APAC. Could you please explain me the scope of your report ?
I am looking for in-depth analysis of the Counterfeit Money Detector market. I would like to know more about the segments covered in the report. I would also like to understand the research methodology used to arrive at the market size. Can you help me with the scope of the Counterfeit Money Detector Market?