Downstream Processing Market by Technique (Separation, Concentration, Purification), Product (Chromatography Column & Resin, Filter, Single use), Application (Mab Production), End User (Contract Manufacturing Organization) - Global Forecast to 2021


[139 Pages Report] The global downstream processing market is poised to reach USD 22.03 Billion by 2021 from USD 10.32 Billion in 2016, at a CAGR of 16.4% from 2016 to 2021.
In this report, the global market is broadly segmented by technique, product, application, end user, and region. On the basis of product, the market is classified into chromatography columns and resins, filters, membrane adsorbers, single-use products, and other products. In 2016, the chromatography columns and resins segment accounted for the largest share of the market. The constant need for newer and different types of columns and resins is likely to fuel market growth
Based on technique, the market is segmented into purification, solid-liquid separation, and clarification/concentration. In 2016, the purification segment accounted for the largest share of the market. This high growth is attributed to the need for highly pure biopharmaceutical products to meet the regulatory standards, as downstream purification plays a significant role in enhancing the purity and quality of products aiding the growth of the purification market.
Based on application, the downstream processing market is categorized into monoclonal antibody (mAbs) production, vaccine production, insulin production, immunoglobulin production, erythropoietin production, and other applications. In 2016, the vaccine production segment accounted for the largest share of the market. Technological advancement in the downstream purification technology to develop high-quality products such as Vaccines at lower costs is expected to drive the growth of this segment.
Based on end user, the market is segmented into biopharmaceutical manufacturers and contract manufacturing organizations (CMOs). In 2016, the biopharmaceutical manufacturers segment accounted for the largest share of the market. The increasing demand for biopharmaceuticals among the aging population is expected to accelerate the growth of the biopharmaceutical manufacturers’ end-user segment.
The growth of this market is propelled by the increasing demand for biopharmaceuticals and increasing R&D expenditure in the biopharmaceutical industry. Emerging markets such as Asia-Pacific provide new growth opportunities to players in the market. On the other hand, the high cost of instruments and the need for skilled professionals are expected to restrain the growth of this market to a certain extent during the forecast period. In addition, purification bottleneck, lack of single-use options, and dearth of skilled professionals are the major challenges in the downstream processing market
The market is dominated by established players such as Thermo Fisher Scientific Inc. (U.S.), GE Healthcare (U.S.), Sartorius Stedim Biotech S.A. (France), Merck Millipore (Germany), and Danaher Corporation (U.S.).
Stakeholders
- Vendors/service providers
- Research and consulting firms
- Biopharmaceutical manufacturers
- Contract manufacturing organizations (CMOs)
- Contract research organizations (CROs)
To know about the assumptions considered for the study, download the pdf brochure
Scope of the Report
- The market study doesn’t cover the market size in terms of volume
- Some companies in this market are privately owned and their revenues are not available in the public domain. Hence, revenue for those companies are not included in this report
- Company developments not reported in the public domain are not included in this report
|
Particular |
Scope |
|
Region |
|
|
Historical Years |
2014 |
|
Base Year |
2015 |
|
Estimated Year |
2016-e |
|
Forecast Period |
2016-e–2021-p |
|
Revenue Currency |
USD |
Market Segmentation
This research report categorizes the market on the basis of technique, product, application, end user, and region.
Global Downstream processing Market, by Technique
- Purification
- Solid-liquid Separation
- Clarification/Concentration
Global Downstream processing Market, by Product
- Chromatography Columns and Resins
- Filters
- Membrane Adsorbers
- Single-use Products
- Other Products (Consumables and Accessories)
Global Downstream processing Market, by Application
- Monoclonal Antibody Production
- Vaccine Production
- Insulin Production
- Immunoglobulin Production
- Erythropoietin Production
- Other Applications (Interferons, Fusion Proteins, Growth Hormones, Blood Coagulation Factors, Anticoagulants, Medical Enzymes, Anti-bacterial (Antibiotics), and Colony Stimulating Factors)
Global Downstream processing Market, by End User
- Biopharmaceutical Manufacturers
- Contract Manufacturing Organizations (CMOs)
Global Downstream processing Market, by Region
-
North America
- U.S.
- Canada
- Europe
- Asia-Pacific
- Rest of the World (RoW)
Available Customizations
With the given market data, MarketsandMarkets offers customizations as per the company’s specific needs. The following customization options are available for the report:
Geographical Analysis
- Further breakdown of the APAC downstream processing market into China, Japan, India, and Rest of Asia-Pacific
- Further breakdown of the European market into Germany, France, the U.K., and Rest of Europe
Company Information
- Detailed analysis and profiling of additional market players (Up to 5)
The global downstream processing market is projected to reach USD 22.03 Billion by 2021 from USD 10.32 Billion in 2016, at a CAGR of 16.4% from 2016 to 2021. In this report, the global market is broadly segmented on the basis of technique, product, application, end user, and region.
Major factors driving the growth of the market are increasing R&D expenditure in the biopharmaceutical industry and increasing demand for biopharmaceuticals. However, the need for skilled professionals and the high cost of instruments are expected to restrain the growth of this market. On the other hand, patent expiration of blockbuster biopharmaceutical products represents significant growth opportunities for the key players in the market.
On the basis of product, the market is broadly classified into chromatography columns and resins, membrane adsorbers, single-use products, filters, and other products (consumables and accessories). The chromatography columns and resins segment is expected to grow at the highest CAGR during the forecast period. This growth can be attributed to the constant need for newer and different types of columns and resins.
On the basis of technique, the downstream processing market is segmented into purification, solid-liquid separation, and clarification/concentration. In 2016, the purification segment accounted for the largest share of the market. This high growth is attributed to the need for highly pure biopharmaceutical products to meet the regulatory standards, as downstream purification plays a significant role in enhancing the purity and quality of products aiding the growth of the purification market.
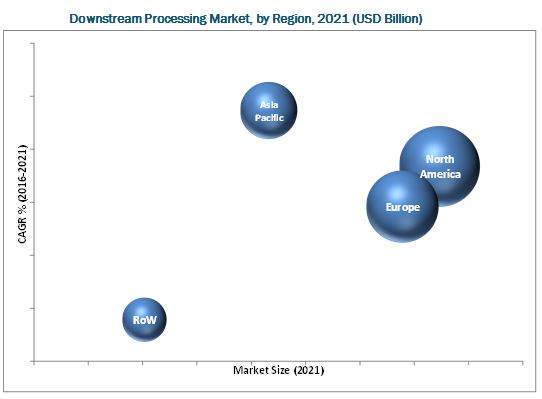
The Asia-Pacific region is expected to grow at the highest CAGR during the forecast period. Countries like China, Japan, India, and South Korea, are expected to drive the demand for downstream processing products in the coming years. Also, growth in these markets will be fueled by significant investments by key market players, increasing government support, developing R&D infrastructure, and growing expertise and academic excellence.
North America is the world’s largest pharmaceutical market and a leader in biopharmaceutical research. North America (comprising the U.S. and Canada) accounted for the largest share of the global market in 2016. Rising quality requirements have emphasized the need for advanced bioproduction technology in this region.
The Downstream Processing Market is dominated by established players such as Thermo Fisher Scientific Inc. (U.S.), GE Healthcare (U.S.), Sartorius Stedim Biotech S.A. (France), Merck Millipore (Germany), and Danaher Corporation (U.S.).
To speak to our analyst for a discussion on the above findings, click Speak to Analyst
 Exclusive indicates content/data unique to MarketsandMarkets and not available with any competitors.
Table of Contents
1 Introduction (Page No. - 12)
1.1 Objectives of the Study
1.2 Market Definition
1.2.1 Markets Covered
1.2.2 Years Considered for the Study
1.3 Currency
1.4 Limitations
1.5 Stakeholders
2 Research Methodology (Page No. - 15)
2.1 Market Size Estimation
2.2 Market Breakdown and Data Triangulation
2.2.1 Key Data From Secondary Sources
2.2.2 Key Data From Primary Sources
2.2.2.1 Key Industry Insights
2.3 Assumptions for the Study
3 Executive Summary (Page No. - 23)
4 Premium Insights (Page No. - 28)
4.1 Downstream Processing Market Snapshot, 2016 vs 2021
4.2 Market, By Product and Region
4.3 Downstream Processing Market, By Technique, 2016 vs 2021 (USD Billion)
4.4 Market, By Application, 2016 vs 2021 (USD Billion)
4.5 Market, By End User, 2016 vs 2021 (USD Billion)
4.6 Downstream Processing Market, By Region
5 Market Overview (Page No. - 32)
5.1 Introduction
5.1.1 Drivers
5.1.1.1 Increasing Demand for Biopharmaceuticals
5.1.1.2 Increasing R&D Expenditure in Biopharmaceutical Companies
5.1.2 Restraints
5.1.2.1 High Cost of Instruments
5.1.3 Opportunities
5.1.3.1 Patent Expiry
5.1.4 Challenges
5.1.4.1 Purification Bottleneck
5.1.4.2 Lack of Single-Use Options
5.1.4.3 Dearth of Skilled Professionals
6 Downstream Processing Market, By Technique (Page No. - 38)
6.1 Introduction
6.2 Purification Techniques
6.2.1 Gel Chromatography
6.2.2 Ion Exchange Chromatography
6.2.3 Affinity Chromatography
6.2.4 Hydrophobic Interaction Chromatography
6.3 Solid-Liquid Separation
6.3.1 Filtration
6.3.1.1 Tangential Flow Filtration
6.3.1.2 Normal Flow Filtration
6.3.2 Centrifugation
6.4 Clarification/Concentration
7 Downstream Processing Market, By Product (Page No. - 47)
7.1 Introduction
7.2 Chromatography Columns and Resins
7.3 Filters
7.4 Membrane Adsorbers
7.5 Single-Use Products
7.6 Other Products
8 Downstream Processing Market, By Application (Page No. - 56)
8.1 Introduction
8.2 Monoclonal Antibody Production
8.3 Vaccines Production
8.4 Insulin Production
8.5 Immunoglobulin Production
8.6 Erythropoietin Production
8.7 Other Applications
9 Downstream Processing Market, By End User (Page No. - 68)
9.1 Introduction
9.2 Biopharmaceutical Manufacturers
9.3 Contract Manufacturing Organizations
10 Downstream Processing Market, By Region (Page No. - 73)
10.1 Introduction
10.2 North America
10.2.1 U.S.
10.2.2 Canada
10.3 Europe
10.4 Asia-Pacific
10.5 Rest of the World
11 Competitive Landscape (Page No. - 92)
11.1 Overview
11.2 Comparative Assessment of Key Market Players
11.3 Competitive Situations and Trends
11.3.1 Product Launches
11.3.2 Acquisitions
11.3.3 Expansions
11.3.4 Collaborations
11.3.5 Other Strategies
12 Company Profiles (Page No. - 98)
(Overview, Products and Services, Financials, Strategy & Development)*
12.1 Introduction
12.2 Thermo Fisher Scientific Inc.
12.3 GE Healthcare
12.4 Sartorius Stedim Biotech S.A.
12.5 Merck Millipore
12.6 Danaher Corporation
12.7 3M Company
12.8 Boehringer Ingelheim
12.9 Lonza Group AG
12.10 Eppendorf AG
12.11 Finesse Solutions, Inc.
*Details on Overview, Products and Services, Financials, Strategy & Development Might Not Be Captured in Case of Unlisted Companies.
13 Appendix (Page No. - 126)
13.1 Insights of Industry Experts
13.2 Discussion Guide
13.3 Other Developments
13.4 Knowledge Store: Marketsandmarkets’ Subscription Portal
13.5 Introducing RT: Real-Time Market Intelligence
13.6 Available Customizations
13.7 Related Reports
13.8 Author Details
List of Tables (68 Tables)
Table 1 Downstream Processing Market Size, By Technique, 2014–2021 (USD Million)
Table 2 Global Market Size for Purification Techniques, By Region, 2014–2021 (USD Million)
Table 3 North America: Market Size for Purification Techniques, By Country, 2014–2021 (USD Million)
Table 4 Global Market Size for Solid-Liquid Separation Techniques, By Region, 2014–2021 (USD Million)
Table 5 North America: Market Size for Solid-Liquid Separation Techniques, By Country, 2014–2021 (USD Million)
Table 6 Global Market Size for Clarification/Concentration Techniques, By Region, 2014–2021 (USD Million)
Table 7 North America: Market Size for Clarification/Concentration Techniques, By Country, 2014–2021 (USD Million)
Table 8 Global Market Size, By Product, 2014–2021 (USD Million)
Table 9 Global Market Size for Chromatography Columns and Resins, By Region, 2014–2021 (USD Million)
Table 10 North America: Market Size for Chromatography Columns and Resins, By Country, 2014–2021 (USD Million)
Table 11 Global Market Size for Filters, By Region, 2014–2021 (USD Million)
Table 12 North America: Market Size for Filters, By Country, 2014–2021 (USD Million)
Table 13 Global Market Size for Membrane Adsorbers, By Region, 2014–2021 (USD Million)
Table 14 North America: Market Size for Membrane Adsorbers, By Country, 2014–2021 (USD Million)
Table 15 Global Market Size for Single-Use Products, By Region, 2014–2021 (USD Million)
Table 16 North America: Market Size for Single-Use Products, By Country, 2014–2021 (USD Million)
Table 17 Global Market Size for Other Products, By Region, 2014–2021 (USD Million)
Table 18 North America: Market Size for Other Products, By Country, 2014–2021 (USD Million)
Table 19 Market Size, By Application, 2014–2021 (USD Million)
Table 20 an Indicative List of Blockbuster Mabs and Their Expiry Dates
Table 21 Global Market Size for Mab Production, By Region, 2014–2021 (USD Million)
Table 22 North America: Market Size for Monoclonal Antibody Production, By Country, 2014–2021 (USD Million)
Table 23 Global Market Size for Vaccine Production, By Region, 2014–2021 (USD Million)
Table 24 North America: Market Size for Vaccine Production, By Country, 2014–2021 (USD Million)
Table 25 Global Market Size for Insulin Production, By Region, 2014–2021 (USD Million)
Table 26 North America: Market Size for Insulin Production, By Country, 2014–2021 (USD Million)
Table 27 Global Market Size for Immunoglobulin Production, By Region, 2014–2021 (USD Million)
Table 28 North America: Market Size for Immunoglobulin Production, By Country, 2014–2021 (USD Million)
Table 29 Global Market Size for Erythropoietin Production, By Region, 2014–2021 (USD Million)
Table 30 North America: Market Size for Erythropoietin Production, By Country, 2014–2021 (USD Million)
Table 31 Global Market Size for Other Applications, By Region, 2014–2021 (USD Million)
Table 32 North America: Market Size for Other Applications, By Country, 2014–2021 (USD Million)
Table 33 Market Size, By End User, 2014–2021 (USD Million)
Table 34 Market Size for Biopharmaceutical Manufacturers, By Region, 2014–2021 (USD Million)
Table 35 North America: Market Size for Biopharmaceutical Manufacturers, By Country, 2014–2021 (USD Million)
Table 36 Market Size for Contract Manufacturing Organizations, By Region, 2014–2021 (USD Million)
Table 37 North America: Market Size for Contract Manufacturing Organizations, By Country, 2014–2021 (USD Million)
Table 38 Market Size, By Region, 2014–2021 (USD Million)
Table 39 North America: Market Size, By Country, 2014–2021 (USD Million)
Table 40 North America: Market Size, By Technique, 2014–2021 (USD Million)
Table 41 North America: Market Size, By Product, 2014–2021 (USD Million)
Table 42 North America: Market Size, By Application, 2014–2021 (USD Million)
Table 43 North America: Market Size, By End User, 2014–2021 (USD Million)
Table 44 U.S.: Market Size, By Technique, 2014–2021 (USD Million)
Table 45 U.S.: Market Size, By Product, 2014–2021 (USD Million)
Table 46 U.S.: Market Size, By Application, 2014–2021 (USD Million)
Table 47 U.S.: Market Size, By End User, 2014–2021 (USD Million)
Table 48 Canada: Market Size, By Technique, 2014–2021 (USD Million)
Table 49 Canada: Market Size, By Product, 2014–2021 (USD Million)
Table 50 Canada: Market Size, By Application, 2014–2021 (USD Million)
Table 51 Canada : Market Size, By End User, 2014–2021 (USD Million)
Table 52 Europe: Downstream Processing Market Size, By Technique, 2014–2021 (USD Million)
Table 53 Europe: Market Size, By Product, 2014–2021 (USD Million)
Table 54 Europe: Market Size, By Application, 2014–2021 (USD Million)
Table 55 Europe : Downstream Processing Market Size, By End User, 2014–2021 (USD Million)
Table 56 Asia-Pacific: Market Size, By Technique, 2014–2021 (USD Million)
Table 57 Asia-Pacific: Downstream Processing Market Size, By Product, 2014–2021 (USD Million)
Table 58 Asia-Pacific: Downstream Processing Market Size, By Application, 2014–2021 (USD Million)
Table 59 Asia-Pacific: Market Size, By End User, 2014–2021 (USD Million)
Table 60 RoW: Downstream Processing Market Size, By Technique, 2014–2021 (USD Million)
Table 61 RoW: Market Size, By Product, 2014–2021 (USD Million)
Table 62 RoW: Market Size, By Application, 2014–2021 (USD Million)
Table 63 RoW : Downstream Processing Market Size, By End User, 2014–2021 (USD Million)
Table 64 Product Launches, 2014–2016
Table 65 Acquisitions, 2014–2016
Table 66 Expansions, 2014–2016
Table 67 Collaborations, 2014–2016
Table 68 Other Strategies, 2014–2016
List of Figures (40 Figures)
Figure 1 Downstream Processing Market Segmentation
Figure 2 Research Design
Figure 3 Market Size Estimation Methodology: Bottom-Up Approach
Figure 4 Market Size Estimation Methodology: Top-Down Approach
Figure 5 Breakdown of Primary Interviews: By Company Type, Designation, and Region
Figure 6 Market Data Triangulation Methodology
Figure 7 Downstream Processing Market, By Technique, 2016 vs 2021 (USD Billion)
Figure 8 Market, By Product, 2016 vs 2021 (USD Billion)
Figure 9 Market Size, By Application, 2016 vs 2021 (USD Billion)
Figure 10 Downstream Processing Market Size, By End User, 2016 vs 2021 (USD Billion)
Figure 11 Geographical Snapshot of the Market
Figure 12 Increasing Demand for Biopharmaceuticals
Figure 13 Chromatography Columns and Resins Accounted for the Largest Market Share in 2016
Figure 14 The Purification Segment Dominated the Downstream Processing Techniques Market in 2016
Figure 15 Vaccine Production to Command Highest Share in the Downstream Processing Market in 2016
Figure 16 Biopharmaceutical Manufacturers Dominated the Downstream Manufacturing End Users Market in 2016
Figure 17 Asia-Pacific to Grow at the Highest Rate During the Forecast Period
Figure 18 Market: Drivers, Restraints, Opportunities, & Challenges
Figure 19 Growth in Aging Population, By Country (2011–2030)
Figure 20 U.S.: Biologics Going Off-Patent in the Coming Years
Figure 21 Processes Followed in Downstream Processing
Figure 22 Purification Techniques Segment to Dominate the Downstream Processing Market During the Forecast Period
Figure 23 Chromatography Column and Resins Dominated the Downstream Processing Products Market in 2016
Figure 24 Vaccine Production Segment to Dominate the Market During the Forecast Period
Figure 25 Biopharmaceutical Manufacturers to Dominate the Downstream Processing End-User Market in 2016
Figure 26 Geographic Snapshot: APAC Will Be the Fastest-Growing Market for Downstream Processing During the Forecast Period
Figure 27 North American Downstream Processing Market Snapshot
Figure 28 Asia-Pacific Market Snapshot
Figure 29 Companies Majorly Pursued the Strategy of Product Launches to Enhance Their Market Presence
Figure 30 Battle for Market Share: Product Launches—Key Growth Strategy Adopted By Market Players
Figure 31 Geographic Revenue Mix of Top Five Market Players
Figure 32 Thermo Fisher Scientific Inc.: Company Snapshot
Figure 33 GE Healthcare: Company Snapshot (2015)
Figure 34 Sartorius Stedim Biotech S.A.: Company Snapshot (2015)
Figure 35 Merck Millipore: Company Snapshot (2015)
Figure 36 Danaher Corporation: Company Snapshot (2015)
Figure 37 3M Company: Company Snapshot (2015)
Figure 38 Boehringer Ingelheim: Company Snapshot (2015)
Figure 39 Lonza Group AG: Company Snapshot (2015)
Figure 40 Eppendorf AG: Company Snapshot (2015)

 Generating Response ...


Growth opportunities and latent adjacency in Downstream Processing Market