Dry Milling Market for Corn by End Product (Ethanol, DDGS, Corn Grits, Cornmeal, and Corn Flour), Application (Fuel, Food, and Feed), Source (Yellow Corn and White Corn), and Region - Global Forecast to 2022


[135 Pages Report] The global dry Milling market for corn is estimated to be valued at USD 67.73 Billion in 2017; and is projected to reach USD 88.61 Billion by 2022, growing at a CAGR of 5.5%. The base year considered for the study is 2016, and the forecast period is from 2017 to 2022. The basic objective of the report is to define, segment, and project the global market for corn in both qualitative and quantitative terms on the basis of end product, application, source, and region. The report also aims to provide detailed information about the crucial factors influencing the growth of the dry milling market for corn, strategically analyze the micro markets, opportunities for stakeholders, details of competitive landscape, and profiles of the key players with respect to their market share and competencies.
Research Methodology:
The top-down and bottom-up approaches were used to arrive at the market size and obtain the market forecast. Data triangulation methods were used to perform market estimation and market forecasting for the entire segmentation listed in this report. Extensive secondary research through databases (Hoovers, Forbes, and Bloomberg Businessweek), Corn-based Associations (Renewable Fuel Association, Corn Growers Association), Food Associations (Food and Agriculture Association) was conducted to understand the market insights and trends, which were further validated through primary interviews. The report provides both qualitative and quantitative analysis of the global dry milling market for corn, the competitive landscape, and the preferred development strategies of the key players.
To know about the assumptions considered for the study, download the pdf brochure
The key players in the market are Cargill (U.S.), Archer Daniels Midland Company (U.S.), Bunge Limited (U.S.), SunOpta, Inc. (Canada), Grain Millers Inc. (U.S.), LifeLine Foods, LLC (U.S.) Didion Milling Inc. (U.S.), Semo Milling, LLC (U.S.), Pacific Ethanol Inc. (U.S.), Green Plains Inc.(U.S.), Flint Hills Resources, LP (U.S.), C.H. Guenther & Son, Incorporated (U.S.), and Valero Energy Corporation (U.S.)..
The Stakeholders for the Dry Milling Market for Corn are Mentioned Below:
- Corn dry millers, corn dry-milled product suppliers, manufacturers, and consumers
- Dry corn products traders, distributors, importers, exporters, and suppliers
- Commercial research & development (R&D) institutions and financial institutions
- Trade associations and industry bodies
- Government health authorities and regulatory bodies such as World Health Organization (WHO), Environmental Protection Agency (EPA), and Food & Drug Administration (FDA)
Scope of the Report:
This research report categorizes the dry milling market for corn on the basis of end product, application, source, and region.
On the Basis of end Product, the Market has been Segmented into the following:
- Ethanol
- DDGS
- Corn Grits
- Cornmeal
- Corn Flour
- Others (Wet distiller grains, dried distiller grains, modified wet distiller grains, distiller oil, and corn bran)
On the Basis of Application, the market has been Segmented into the following:
- Fuel
- Feed
- Food
On the Basis of Source, the Market has been Segmented into the following:
- Yellow corn
- White corn
On the Basis of Region, the Market has been Segmented into the following:
- North America
- Europe
- Asia-Pacific
- Rest of the World
Available Cusmizations
With the given market data, MarketsandMarkets offers customizations according to the client-specific needs.
The following customization options are available for the report:
Product Analysis
- Product matrix, which gives a detailed comparison of the product portfolio of each company
Regional Analysis
- Further breakdown of the Rest of Europe market into Netherlands, Sweden, Ukraine, Hungary, and Russia
- Further breakdown of the Rest of Asia-Pacific region into New Zealand, South Korea, Vietnam, Thailand, and Indonesia.
- Further breakdown of the Rest of the World market into South American, African, and Middle Eastern countries.
Company Information
- Detailed analysis and profiling of additional market players (up to five)
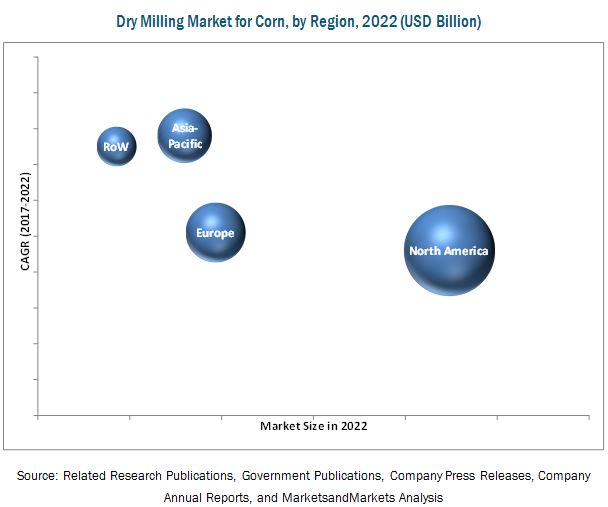
Corn is traditionally a staple food source in many parts of the world. Currently, its range of applications has also extended to feed and biofuel. Corn products extracted by the dry-milling process are used in a wide range of applications. The dry-milling process can be used as a dry grind process for either ethanol extraction from starch or fractioning of grits, meal, flour, and other co-products. The dry milling market for corn is significantly impacted by the increasing usage of ethanol as biofuel. This market is projected to be valued at USD 88.61 Billion by 2022, growing at a CAGR of 5.5% from 2017. The total volume of the dry milling market for corn is projected to reach 215.8 Million MT by 2022.
The global market is segmented on the basis of end product, application, source, and region. On the basis of end product, the corn flour segment is projected to grow at the highest CAGR from 2017 to 2022, owing to its large-sale usage in processed snacks and bakery products.
On the basis of application, the fuel application segment accounted for the largest market in 2016. High demand for biofuel and animal feed products in developed markets such as Europe and North America influences the consumption of corn co-products such as ethanol and distillers grains.
The global market, on the basis of source, is segmented into yellow and white corn. The market for white corn is projected to grow at a higher CAGR during the forecast period. Yellow corn varieties are widely dry-milled to produce ethanol and animal feed, mostly for their high starch content.
The demand for corn dry-milled products is increasing, especially in the Asia-Pacific region due to the increasing consumer awareness for renewable biofuel, growing environmental concerns, along with the need to provide protein feed to livestock, and increasing demand for dry-milled corn products for food. These are a few drivers for the dry milling market for corn in the Asia-Pacific region.
The major restraints in the dry milling market for corn is the high maintenance to retain corn quality during the harvesting and dry milling processes. Corn grain quality is determined by the growing conditions, harvest practices, and drying operations. Hybrid selection and timely harvest of corn are important factors to produce high-quality grain. In many developing countries, these requirements are not met due to poor infrastructural conditions and less economic support, leading to a decreased output.
The key players in the market are Cargill (U.S.), Archer Daniels Midland Company (U.S.), Bunge Limited (U.S.), SunOpta, Inc. (Canada), Grain Millers Inc. (U.S.), Semo Milling, LLC (U.S.), LifeLine Foods, LLC (U.S.), Pacific Ethanol Inc. (U.S.), Green Plains Inc.(U.S.), Flint Hills Resources, LP (U.S.), C.H. Guenther & Son, Incorporated (U.S.), and Valero Energy Corporation (U.S.).
Archer Daniels Midland Company, a leader in the dry milling market for corn, aims to increase its business in most countries to develop a significant global network by adopting acquisitions and expansions as its strategies. The company also aims to expand its sourcing, storing, transporting, transforming, processing, marketing, and distributing facilities to serve its consumers better. It also intends to increase its productivity and the diversity of its product portfolio by launching new products, which would be produced from the corn dry-milling process. For this, the company works closely with its customers and also focuses on extensive research to create innovative approaches and better solutions that accelerate growth and increase business efficiency. The company wants to diversify its corn product portfolio; this will enhance its profitability by expanding corn-based food, feed, and ethanol businesses.
To speak to our analyst for a discussion on the above findings, click Speak to Analyst
 Exclusive indicates content/data unique to MarketsandMarkets and not available with any competitors.
Table of Contents
1 Introduction (Page No. - 13)
1.1 Objectives of the Study
1.2 Market Definition
1.3 Study Scope
1.4 Years Considered for the Study
1.5 Currency Considered
1.6 Unit Considered
1.7 Stakeholders
2 Research Methodology (Page No. - 16)
2.1 Research Data
2.1.1 Secondary Data
2.1.2 Primary Data
2.1.2.1 Breakdown of Primary Interviews
2.2 Market Size Estimation
2.3 Market Breakdown & Data Triangulation
2.4 Research Assumptions & Limitations
2.4.1 Assumptions
2.4.2 Limitations
3 Executive Summary (Page No. - 23)
4 Premium Insights (Page No. - 27)
4.1 Opportunities in this Market
4.2 Dry Milling Market for Corn: Key Countries
4.3 Dry Milling Market for Corn, By End Product
4.4 North America: Dry Milling Market for Corn, By Application & Country
4.5 Market, By Source & Region
5 Market Overview (Page No. - 31)
5.1 Introduction
5.2 Market Dynamics
5.2.1 Drivers
5.2.1.1 Corn is Used as One of the Main Ingredients in Feed
5.2.1.2 Increasing Demand for Corn Ethanol as Biofuel
5.2.2 Restraints
5.2.2.1 High Maintenance Required to Retain Corn Quality During Harvest and Dry Milling Processes
5.2.3 Opportunities
5.2.3.1 Potential Demand for Fortified Corn Products
5.2.4 Challenges
5.2.4.1 Prevention of Mycotoxin Contamination
6 Dry Milling Market for Corn, By End Product (Page No. - 35)
6.1 Introduction
6.2 Ethanol
6.3 DDGS
6.4 Corn Grits
6.5 Cornmeal
6.6 Corn Flour
6.7 Other Co-Products
7 Dry Milling Market for Corn, By Application (Page No. - 43)
7.1 Introduction
7.2 Fuel
7.3 Feed
7.4 Food
8 Dry Milling Market for Corn, By Source (Page No. - 49)
8.1 Introduction
8.2 Yellow Corn
8.3 White Corn
9 Dry Milling Market for Corn, By Region (Page No. - 53)
9.1 Introduction
9.2 North America
9.2.1 U.S.
9.2.2 Canada
9.2.3 Mexico
9.3 Europe
9.3.1 Germany
9.3.2 U.K.
9.3.3 France
9.3.4 Poland
9.3.5 Spain
9.3.6 Rest of Europe
9.4 Asia-Pacific
9.4.1 China
9.4.2 India
9.4.3 Japan
9.4.4 Australia
9.4.5 Rest of Asia-Pacific
9.5 Rest of the World (RoW)
9.5.1 Brazil
9.5.2 Argentina
9.5.3 South Africa
9.5.4 Others in RoW
10 Competitive Landscape (Page No. - 83)
10.1 Introduction
10.2 Vendor Dive Analysis
10.2.1 Vanguards
10.2.2 Innovators
10.2.3 Dynamic
10.2.4 Emerging
10.3 Competitive Benchmarking
10.3.1 Product Offerings (For All 24 Players)
10.3.2 Business Strategy (For All 24 Players)
*Top 24 Companies Analyzed for This Study are - Cargill (U.S.), Archer Daniels Midland Company (U.S.), Bunge Limited (U.S.), Sunopta, Inc (Canada), Didion Milling Inc. (U.S.), Semo Milling, LLC (U.S.), Lifeline Foods, LLC (U.S.), Pacific Ethanol, Inc (U.S.), Green Plains Inc. (U.S.), Flint Hills Resources, LP (U.S.), C.H. Guenther & Son, Incorporated (U.S.), Valero Energy Corporation (U.S.), Poet, LLC (U.S.), Louis Dreyfuss Company LLC (Netherlands), House-Autry Mills Inc (U.S.), Hokinsville Milling Company (U.S.), Prairie Mills Products, LLC (U.S.), Shawnee Milling Company (U.S.), Grain Millers, Inc (U.S.), Agricor, Inc (U.S.), Grainspan Nutrients Private Limited (India), Dacsa Group, Wikins Rogers, Inc (U.S.), Homeland Energy Solutions, LLC (U.S.),
10.4 Market Standing
11 Company Profiles (Page No. - 88)
(Overview, Products and Services, Financials, Strategy & Development)*
11.1 Introduction
11.2 Cargill
11.3 Archer Daniels Midland Company
11.4 Bunge Limited
11.5 Sunopta, Inc.
11.6 Didion Milling Inc.
11.7 Semo Milling, LLC
11.8 Lifeline Foods, LLC
11.9 Pacific Ethanol Inc.
11.10 Green Plains Inc.
11.11 Flint Hills Resources, LP
11.12 C.H. Guenther & Son, Incorporated
11.13 Valero Energy Corporation
*Details on Overview, Products and Services, Financials, Strategy & Development Might Not Be Captured in Case of Unlisted Companies.
12 Appendix (Page No. - 126)
12.1 Insights of Industry Experts
12.2 Discussion Guide
12.3 Knowledge Store: Marketsandmarkets’ Subscription Portal
12.4 Introducing RT: Real-Time Intelligence
12.5 Available Customizations
12.6 Related Reports
12.7 Author Details
hList of Tables (61 Tables)
Table 1 Dry Milling Market for Corn- Market Size, By End Product, 2015–2022 (USD Million)
Table 2 Market Size, By End Product, 2015–2022 (MMT)
Table 3 Dry Milling Market for Corn- Market Size, for Ethanol, By Region, 2015–2022 (USD Million)
Table 4 Market Size, for DDGS, By Region, 2015–2022 (USD Million)
Table 5 Market Size, for Corn Grits, By Region, 2015–2022 (USD Million)
Table 6 Market Size, for Cornmeal, By Region, 2015–2022 (USD Million)
Table 7 Dry Milling Market for Corn- Market Size, for Corn Flour, By Region, 2015–2022 (USD Million)
Table 8 Dry Milling Market for Corn- Market Size, for Other Co-Products, By Region, 2015–2022 (USD Million)
Table 9 Dry Milling Market for Corn- Market Size, By Application, 2015–2022 (USD Million)
Table 10 Market Size, By Application, 2015–2022 (MMT)
Table 11 Dry Milling Market for Corn- Market Size, for Fuel, By Region, 2015–2022 (USD Million)
Table 12 Market Size, for Fuel, By Region, 2015–2022 (Million Mt)
Table 13 Dry Milling Market for Corn- Market Size, for Feed, By Region, 2015–2022 (USD Million)
Table 14 Market Size, for Feed, By Region, 2015–2022 (MMT)
Table 15 Dry Milling Market for Corn- Market Size, for Food, By Region, 2015–2022 (USD Million)
Table 16 Market Size, for Food, By Region, 2015–2022 (MMT)
Table 17 Dry Milling Market for Corn- Market Size , By Source, 2015–2022 (USD Million)
Table 18 Market Size , By Source, 2015–2022 (MMT)
Table 19 Dry Milling Market for Yellow Corn- Market Size , By Region, 2015–2022 (USD Million)
Table 20 Dry Milling Market for White Corn- Market Size, By Region, 2015–2022 (USD Million)
Table 21 Dry Milling Market for Corn- Market Size, By Region, 2015–2022 (USD Million)
Table 22 Market Size , By Region, 2015–2022 (MMT)
Table 23 North America: Dry Milling Market for Corn- Market Size , By Country, 2015–2022 (USD Million)
Table 24 North America: Market Size , By End Product, 2015–2022 (USD Million)
Table 25 North America: Market Size , By Application, 2015–2022 (USD Million)
Table 26 North America: Market Size , By Application, 2015–2022 (MMT)
Table 27 North America: Market Size , By Source, 2015–2022 (USD Million)
Table 28 U.S.: Dry Milling Market for Corn- Market Size , By End Product, 2015–2022 (USD Million)
Table 29 Canada: Dry Milling Market for Corn- Market Size , By End Product, 2015–2022 (USD Million)
Table 30 Mexico: Dry Milling Market for Corn- Market Size , By End Product, 2015–2022 (USD Million)
Table 31 Europe: Dry Milling Market for Corn- Market Size , By Country, 2015–2022 (USD Million)
Table 32 Europe: Market Size , By End Product, 2015–2022 (USD Million)
Table 33 Europe: Market Size , By Application, 2015–2022 (USD Million)
Table 34 Europe: Market Size , By Application, 2015–2022 (MMT)
Table 35 Europe: Market Size , By Source, 2015–2022 (USD Million)
Table 36 Germany: Dry Milling Market for Corn- Market Size , By End Product, 2015–2022 (USD Million)
Table 37 U.K.: Dry Milling Market for Corn- Market Size , By End Product, 2015–2022(USD Million)
Table 38 France: Dry Milling Market for Corn- Market Size , By End Product, 2015–2022(USD Million)
Table 39 Poland: Dry Milling Market for Corn- Market Size , By End Product, 2015–2022 (USD Million)
Table 40 Spain: Dry Milling Market for Corn- Market Size , By End Product, 2015–2022 (USD Million)
Table 41 Rest of Europe: Dry Milling Market for Corn- Market Size , By End Product, 2015–2022(USD Million)
Table 42 Asia-Pacific: Dry Milling Market for Corn- Market Size , By Country, 2015–2022 (USD Million)
Table 43 Asia-Pacific: Market Size , By End Product, 2015–2022 (USD Million)
Table 44 Asia-Pacific: Market Size , By Application, 2015–2022 (USD Million)
Table 45 Asia-Pacific: Market Size , By Application, 2015–2022 (MMT)
Table 46 Asia-Pacific: Market Size , By Source, 2015–2022 (USD Million)
Table 47 China: Dry Milling Market for Corn- Market Size , By End Product, 2015–2022 (USD Million)
Table 48 India: Dry Milling Market for Corn- Market Size , By End Product, 2015–2022 (USD Million)
Table 49 Japan: Dry Milling Market for Corn- Market Size , By End Product, 2015–2022 (USD Million)
Table 50 Australia: Dry Milling Market for Corn- Market Size, By End Product, 2015–2022 (USD Million)
Table 51 Rest of Asia-Pacific: Dry Milling Market for Corn-Market Size, By End Product, 2015–2022(USD Million)
Table 52 RoW: Dry Milling Market for Corn- Market Size , By Country, 2015–2022 (USD Million)
Table 53 RoW: Market Size, By End Product, 2015–2022 (USD Million)
Table 54 RoW: Market Size , By Application, 2015-2022 (USD Million)
Table 55 RoW: Market Size , By Application, 2015-2022 (MMT)
Table 56 RoW: Market Size , By Source, 2015-2022 (USD Million)
Table 57 Brazil: Dry Milling Market for Corn- Market Size , By End Product, 2015–2022 (USD Million)
Table 58 Argentina: Dry Milling Market for Corn-Market Size, By End Product, 2015–2022 (USD Million)
Table 59 South Africa: Dry Milling Market for Corn- Market Size, By End Product, 2015–2022 (USD Million)
Table 60 Others in RoW: Dry Milling Market for Corn- Market Size, By End Product, 2015–2022 (USD Million)
Table 61 Top Five Players in the Dry Milling Market for Corn, 2016
List of Figures (56 Figures)
Figure 1 Market Segmentation
Figure 2 Geographic Scope
Figure 3 Dry Milling Market for Corn: Research Design
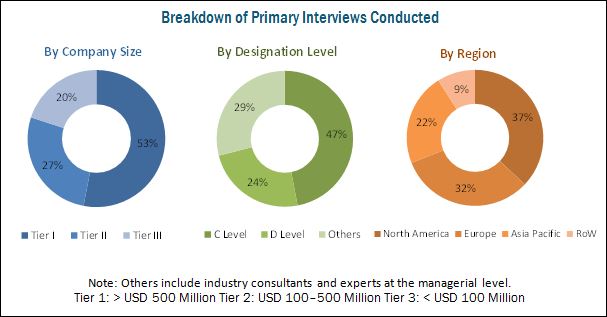
Figure 4 Dry Milling Market for Corn: Breakdown of Primary Interviews
Figure 5 Market Size Estimation Methodology: Bottom-Up Approach
Figure 6 Market Size Estimation Methodology: Top-Down Approach
Figure 7 Data Triangulation Methodology
Figure 8 Dry Milling Market for Corn, By Application, 2017 vs 2022
Figure 9 Corn Flour is Projected to Be the Fastest-Growing End Product (2017-2022)
Figure 10 Asia-Pacific is Projected to Be the Fastest-Growing Dry Milling Market for Corn From 2017 to 2022
Figure 11 Partnerships & Collaborations are Estimated to Boost Market Growth From 2012 to 2017
Figure 12 Opportunities in the Dry Milling Market for Corn, 2017–2022
Figure 13 China to Register the Highest CAGR From 2017 to 2022
Figure 14 North America Estimated to Dominate the Dry Milling Market for Corn, By End Product, in 2017
Figure 15 Fuel Segment Estimated to Dominate the North American Dry Milling Market for Corn in 2017
Figure 16 Yellow Corn Segment Estimated to Dominate the Dry Milling Market for Corn in 2017
Figure 17 Dry Milling Market for Corn: Drivers, Restraints, Opportunities, and Challenges
Figure 18 Market Size , By End Product, 2017 vs 2022 (USD Million)
Figure 19 Market Size , By Application, 2017 vs 2022 (USD Million)
Figure 20 Market Size , By Source, 2017 vs 2022 (USD Million)
Figure 21 Geographic Snapshot (2017-2022): China is Projected to Be the Fastest-Growing Market
Figure 22 North America: Dry Milling Market for Corn Snapshot
Figure 23 Europe: Dry Milling Market for Corn Snapshot
Figure 24 Asia-Pacific Dry Milling Market for Corn: China & India to Drive Regional Market Growth
Figure 25 Dive Chart
Figure 26 Cargill: Company Snapshot
Figure 27 Cargill: Product Offering Scorecard
Figure 28 Cargill, Incorporated: Business Strategy Scorecard
Figure 29 Archer Daniels Midland Company: Company Snapshot
Figure 30 Archer Daniels Midland Company: Product Offering Scorecard
Figure 31 Archer Daniels Midland Company: Business Strategy Scorecard
Figure 32 Bunge Limited: Company Snapshot
Figure 33 Bunge Limited: Product Offering Scorecard
Figure 34 Bunge Limited: Business Strategy Scorecard
Figure 35 Sunopta, Inc.: Company Snapshot
Figure 36 Sunopta, Inc.: Product Offering Scorecard
Figure 37 Sunopta, Inc.: Business Strategy Scorecard
Figure 38 Didion Milling Inc.: Product Offering Scorecard
Figure 39 Didion Milling Inc.: Business Strategy Scorecard
Figure 40 Semo Milling, LLC: Product Offering Scorecard
Figure 41 Semo Milling, LLC: Business Strategy Scorecard
Figure 42 Lifeline Foods, LLC: Product Offering Scorecard
Figure 43 Lifeline Foods, LLC: Business Strategy Scorecard
Figure 44 Pacific Ethanol Inc.: Company Snapshot
Figure 45 Pacific Ethanol Inc.: Product Offering Scorecard
Figure 46 Pacific Ethanol Inc.: Business Strategy Scorecard
Figure 47 Green Plains Inc.: Company Snapshot
Figure 48 Green Plains Inc.: Product Offering Scorecard
Figure 49 Green Plains Inc.: Business Strategy Scorecard
Figure 50 Flint Hills Resources, LP: Product Offering Scorecard
Figure 51 Flint Hills Resources, LP: Business Strategy Scorecard
Figure 52 C.H. Guenther & Son, Incorporated.: Product Offering Scorecard
Figure 53 C.H. Guenther & Son, Incorporated: Business Strategy Scorecard
Figure 54 Valero Energy Corporation: Company Snapshot
Figure 55 Valero Energy Corporation: Product Offering Scorecard
Figure 56 Valero Energy Corporation: Business Strategy Scorecard


Growth opportunities and latent adjacency in Dry Milling Market