Eco-friendly Food Packaging Market by Material (Paper & Paperboard, Plastic, Metal, Glass), Application (Food, Beverages), Type (Recycled Content Packaging, Degradable Packaging, Reusable Packaging), Technique, and Region � Global Forecast to 2025


Eco-friendly food packaging market was valued at USD 174.7 billion in 2020 and is anticipated to grow at a CAGR of 7.4% between 2020 and 2025, to reach USD 249.5 billion by 2025. Eco-friendly food packaging produced using various techniques such as active packaging, molded packaging, and multipurpose packaging are trending globally. With the increasing incidences of food-borne illnes, food manufacturers are moving toward active antimicrobial packaging to avoid the food from contamination. Increased demand for on-the-go products due to the hectic lifestyle of consumers is expected to drive the growth of the packaging industry.

To know about the assumptions considered for the study, Request for Free Sample Report
Eco-friendly Food Packaging Market Dynamics
Driver: Breakthrough in new technologies
Companies are developing new packaging technologies, such as active packaging and molded packaging, as a result of extensive R&D activities and innovations. These technologies focus on developing the use of available resources to the maximum impact and reusing them after recycling.
New technologies targets minimizing the use of water for manufacturing, along with reducing carbon emission during the manufacturing process. In order to develop new techniques for sustainable packaging to reduce waste, global providers of packaging solutions, such as Amcor Limited, Bemis Company, Inc., and Tetra Laval International invest mainly in R&D every year. To reduce the food & beverage packaging waste, with the help of innovative technologies, companies have developed various types of packages, such as edible and soluble packaging. As consumers and manufacturers are inclined toward innovative products, these types of packaging are expected to drive the growth of the market for eco-friendly food packaging.
Restraint: High cost of recycling
Recycling is a process that involves infrastructural facilities, which, in turn, require high investments along with technological and personnel expertise. Recycling of packaging products can be more efficient in terms of energy and other resources, with help of a well-established and designed program, along with the right technology.
As per a leading Plastic News journal, recycling PET pellets costs around 58 to 66 cents per pound, which is much cheaper than the manufacturing of PET virgin bottle resin pellets, which cost around 83 and 85 cents per pound. Recycling costs depend upon various factors, such as the method of recycling and real estate prices, proximity to landfills, labor costs, and amount.
Opportunities: High growth potential in the green packaging market
With an increase in energy and transportation costs, along with growing interest in environmental issues, packaging suppliers and customers are exhibiting an increasing demand for eco-friendly packaging. The environmental deterioration has contributed to the development of the overall sustainable packaging sector. An increase in awareness among the consumers, of their duties in resolving environmental issues through their buying choices, has also led to the growth of this market. Rising awareness pertaining to environmental issues along with initiatives taken by each stakeholder has led to an increase in growth rate of the green packaging market.
Challenge in the Eco-friendly Food Packaging Market: Fluctuations in raw material prices
The operations in the packaging industry had a negative impact due to the rising prices of sustainable raw materials, such as plastic, metal, and paper. Additionally, due to market fluctuations, exchange rates, currency control, weather conditions, and government policies, a constant variation in prices of other raw materials, such as water and fuel, is experienced. Variation in prices leads to an increase in operating cost, which in turn results in an expensive end product. Prices of natural gas will directly affect the prices of plastics, as plastics are manufactured from hydrocarbon gas liquids (HGL) and natural gas.
By type, the degradable packaging segment is projected to account for the highest growth rate in the eco-friendly food packaging equipment market during the forecast period
The degradable packaging market is driven by greater price competitiveness with conventional packaging, increased importance of sustainability in packaging materials, and improved performance brought about by additives and new blending techniques in degradable packaging. Manufacturers are innovating various biodegradable packaging solutions such as edible and water-soluble packaging, which are also biodegradable and can be consumed or degraded with the help of microorganisms, which, therefore, can be considered as eco-friendly packaging.
By material, plastic is expected to experience the second largest market share during the forecast period
Plastic bottles & cans, bags & pouches, carrier bags, films, containers, and wraps are considered in the study, which is either reusable, recyclable, or degradable. Plastic products are used more in the Asia Pacific region for food packaging, which includes single-use plastic products as well. However, for eco-friendly plastics, the European region leads the market due to stringent government regulations and the extended ban on the single-use plastic materials. In addition, consumers in this region are more aware of the hazards of plastic on the environment, which drives the market for eco-friendly food packaging in Europe. Asia Pacific is projected to grow at the highest growth rates as countries, such as China, Japan, India, South Korea, and other emerging countries, are providing opportunities to global and domestic manufacturers for manufacturing eco-friendly packaging products for the food & beverage industry.
The European region is projected to have the largest market for eco-friendly food packaging market from 2020 to 2025.
The European eco-friendly packaging market is more regulated as compared to the North American region. The European Association of Plastics Recycling and Recovery Organization (EPRO) is promoting and organizing recycling and recovering plastics across Europe. Various other organizations are also working constantly to manufacture eco-friendly packaging products by using recyclable and reusable materials. Some of the organizations are EUROPEN (the European Organization for Packaging and the Environment) and INCPEN (the UK-based Industry Council for Packaging and the Environment).

To know about the assumptions considered for the study, download the pdf brochure
Eco-friendly Food Packaging Market Key Players
This report includes a study of marketing and development strategies, along with the product portfolios of the leading companies in the eco friendly food packaging market. The key players in this market include BASF (Germany), Ball Corporation (US), Sonoco Company (US), Tetra Pak (US), Amcor (Australia), Westrock Company (US), and Sealed Air Corporation (US), Smurfit Kappa (Ireland), Mondi Group (Austria), Crown Holdings Inc. (US), Huhtamaki Oyj (Finland), Elopak (Norway), Evergreen (US), and Berry Global (US), Sustainable Packaging Industries (US), Swedbrand (Hong Kong), Printpak (US), Winpak (Canada), Paperfoam (Netherlands), and GWP (England).
Recent Developments
- In February 2020, Amcor launched its first PET container for Ritual Multivitamins made from 100% PCR (Post-Consumer Recycled) resin.
- In February 2020, Mondi partnered with Carto, a Mexican corrugated packaging leader, to enter a fresh segment with new sustainable designs. This helped the company in expanding its reach in Mexico.
- In January 2020, Amcor partnered with Moda (US) to offer innovative, flexible packaging for food processors, specifically for protein applications and meat processors.
Frequently Asked Questions (FAQ):
What is the current size of the global eco-friendly food packaging market?
The eco-friendly food packaging equipment market size is estimated to be valued at USD 174.7 billion in 2020. It is projected to reach USD 249.5 billion by 2025, recording a CAGR of 7.4%, in terms of value.
What are the recent key developments in the market, by any global company, in the eco-friendly food packaging market?
For instance, in February 2020, Huhtamaki launched a new brand of cups called Huhtamaki Compacto vending cups. These cups are made of fiber that has been obtained from forests that are sustainably managed. Through this strategy, the company would offer an eco-friendly alternative for the packaging of vending machine products.
Which are the key star players in the global eco-friendly food packaging market?
Tetra Pak (US), Amcor (Australia), Westrock Company (US), and Sealed Air Corporation (US), Smurfit Kappa (Ireland), Mondi Group (Austria) are the major stars in the eco-friendly food packaging market. .
To speak to our analyst for a discussion on the above findings, click Speak to Analyst
 Exclusive indicates content/data unique to MarketsandMarkets and not available with any competitors.
TABLE OF CONTENTS
1 INTRODUCTION (Page No. - 23)
1.1 OBJECTIVES OF THE STUDY
1.2 ECO-FRIENDLY FOOD PACKAGING MARKET DEFINITION
1.3 STUDY SCOPE
1.3.1 REGIONAL SEGMENTATION
1.3.2 PERIODIZATION CONSIDERED
1.4 CURRENCY CONSIDERED
1.5 UNIT CONSIDERED
1.6 STAKEHOLDERS
2 RESEARCH METHODOLOGY (Page No. - 28)
2.1 RESEARCH DATA
2.1.1 SECONDARY DATA
2.1.1.1 Key Data from Secondary Sources
2.1.2 PRIMARY DATA
2.1.2.1 Key Data from Primary Sources
2.1.2.2 Breakdown of Primaries
2.2 MARKET SIZE ESTIMATION
2.2.1 APPROACH ONE (BASED ON MATERIAL, BY REGION)
2.2.2 APPROACH TWO (BASED ON THE GLOBAL MARKET)
2.3 DATA TRIANGULATION
2.4 ASSUMPTIONS FOR THE STUDY
2.5 LIMITATIONS OF THE STUDY
3 EXECUTIVE SUMMARY (Page No. - 37)
4 PREMIUM INSIGHTS (Page No. - 44)
4.1 ATTRACTIVE OPPORTUNITIES IN THE MARKET
4.2 ECO-FRIENDLY FOOD PACKAGING MARKET, BY REGION, 2020 VS. 2025 (USD BILLION)
4.3 MARKET FOR NORTH AMERICA, BY MATERIAL, 2020 VS. 2025
4.4 MARKET IN ASIA PACIFIC, BY APPLICATION, 2020 VS. 2025
4.5 EUROPE: MARKET, BY MATERIAL AND COUNTRY, 2020
5 MARKET OVERVIEW (Page No. - 50)
5.1 INTRODUCTION
5.1.1 DRIVERS
5.1.1.1 Government initiatives toward eco-friendly packaging
5.1.1.2 Shift in consumer preferences toward recyclable and eco-friendly materials
5.1.1.3 Downsizing of packaging
5.1.1.4 Breakthrough in new technologies
5.1.2 RESTRAINTS
5.1.2.1 Poor infrastructural facilities for recycling
5.1.2.2 High cost of recycling
5.1.3 OPPORTUNITIES
5.1.3.1 Advancements in technologies for new packaging methods
5.1.3.2 High growth potential in the green packaging market
5.1.3.3 Growth opportunities and high potential in the packaging sector in developing countries
5.1.4 CHALLENGES
5.1.4.1 Fluctuations in raw material prices
5.1.4.2 Lack of awareness on importance of sustainability across developing countries
5.2 REGULATIONS
5.2.1 NORTH AMERICA
5.2.2 EUROPE
5.2.3 ASIA PACIFIC
5.3 LEGISLATION FOR PLASTIC FCMS
5.4 VALUE CHAIN
5.5 IMPACT OF COVID-19 ON THE PACKAGING INDUSTRY
6 ECO-FRIENDLY FOOD PACKAGING MARKET, BY MATERIAL (Page No. - 64)
6.1 INTRODUCTION
6.2 PAPER & PAPERBOARD
6.2.1 DEGRADABLE NATURE AND RECYCLABLE PROPERTIES MAKE PAPER & PAPERBOARDS HIGHLY RELIABLE FOR FOOD & BEVERAGE PRODUCTS
6.3 PLASTIC
6.3.1 PLASTIC PACKAGING TO DOMINATE THE GLOBAL MARKET DUE TO ITS DURABILITY, SAFETY, HYGIENE, AND LIGHTWEIGHT PROPERTIES
6.4 METAL
6.4.1 CANS
6.4.1.1 Cans are used in the beverage industry, which eases the storage and transport of these products
6.4.2 BARRELS & DRUMS
6.4.2.1 Import & export of bulk amount of frozen food and beverage products drive the market for barrels & drums
6.4.3 OTHER MATERIALS
6.5 GLASS
6.5.1 JARS
6.5.1.1 Reusable and recyclable property of jars makes it the most preferred in the beverage industry
6.5.2 BOTTLES
6.5.2.1 Easy handling and availability in various sizes is the major factor driving the market for glass bottles in the market
6.5.3 TUBES AND CONTAINERS
6.5.3.1 Increasing demand for premium beverages is driving the market for tubes and containers
6.6 OTHER PACKAGING MATERIALS
7 ECO-FRIENDLY FOOD PACKAGING MARKET, BY APPLICATION (Page No. - 83)
7.1 INTRODUCTION
7.2 FOOD
7.2.1 BAKERY & CONFECTIONERY PRODUCTS
7.2.1.1 Wrapping & bundling and cartoning are the major types of packaging used in the bakery & confectionery industry
7.2.2 CONVENIENCE FOODS
7.2.2.1 The demand for convenience or ready-to-eat food products is rising, fueling the market for eco friendly food packaging market
7.2.3 MEAT, FISH, AND POULTRY
7.2.3.1 Controlled environment packaging, including modified atmosphere packaging, is trending in the meat, fish, and poultry industry
7.2.4 FRUITS & VEGETABLES
7.2.4.1 Increasing demand for fresh and healthy food products is fueling the market for eco-friendly packaging of fruits & vegetables
7.2.5 DAIRY PRODUCTS
7.2.5.1 Eco-friendly packaging products such as recyclable cans and glass bottles are mostly used in dairy products
7.2.6 OTHER FOOD PRODUCTS
7.3 BEVERAGES
7.3.1 ALCOHOLIC BEVERAGES
7.3.1.1 Recyclable and reusable metal & glass packaging is majorly consumed by the alcoholic beverages segment
7.3.2 NON-ALCOHOLIC BEVERAGES
7.3.2.1 Increase in demand for paper & paperboard in fresh juice packaging is driving the market for biodegradable packaging
8 ECO-FRIENDLY FOOD PACKAGING MARKET, BY TYPE (Page No. - 93)
8.1 INTRODUCTION
8.2 RECYCLED CONTENT PACKAGING
8.2.1 CONSUMER DEMAND FOR SUSTAINABILITY IS DRIVING RETAILERS AND BRAND OWNERS TOWARD RECYCLED CONTENT
8.3 DEGRADABLE PACKAGING MARKET
8.3.1 DEGRADABILITY OF PACKAGING MATERIALS USING NATURAL SOURCES SUCH AS MICROORGANISMS, BACTERIA, OR FUNGI IS DRIVING THE MARKET FOR DEGRADABLE PACKAGING
8.4 REUSABLE PACKAGING
8.4.1 HIGHER STRENGTH AND DURABILITY AS COMPARED TO SINGLE-USE PLASTIC MAKES IT POPULAR IN THE MARKET
9 MARKET, BY TECHNIQUE (Page No. - 99)
9.1 INTRODUCTION
9.2 ACTIVE PACKAGING
9.2.1 ANTI-MICROBIAL FILMS AND ANTIOXIDANT FILMS ARE THE MAJOR SOLUTIONS IN ACTIVE PACKAGING
9.3 MOLDED PACKAGING
9.3.1 PLANT SOURCES ARE MAJORLY USED IN MANUFACTURING MOLDED PACKAGING
9.4 ALTERNATE FIBER PACKAGING
9.4.1 LESS CONSUMPTION OF ENERGY IN COMPARISON TO TRADITIONAL PACKAGING IS DRIVING THE MARKET FOR ALTERNATE FIBER PACKAGING
9.5 MULTIPURPOSE PACKAGING
9.5.1 SAFE STORAGE AND TRANSPORT ARE THE KEY FACTORS IN THE MULTIPURPOSE PACKAGING TECHNIQUE
10 MARKET, BY REGION (Page No. - 107)
10.1 INTRODUCTION
10.2 NORTH AMERICA
10.2.1 US
10.2.1.1 Banning of polystyrene or Styrofoam food packaging will fuel the market for eco-friendly materials for packaging
10.2.2 CANADA
10.2.2.1 Government’s initiative on keeping food packaging safe and regulated is driving the eco-friendly food packaging market in Canada
10.2.3 MEXICO
10.2.3.1 Improved lifestyle and increased purchasing power fuel the market for eco-friendly food packaging in the country
10.3 EUROPE
10.3.1 GERMANY
10.3.1.1 Due to the high investments in R&D facilities, the country is projected to dominate the global market
10.3.2 FRANCE
10.3.2.1 Cheaper recycling cost of packaging products to drive the market growth for eco-friendly food packaging in the country
10.3.3 ITALY
10.3.3.1 Improved lifestyle and awareness pertaining to plastic hazards on the environment to drive the growth of the market for eco-friendly food packaging in the country
10.3.4 UK
10.3.4.1 Innovative packaging products to drive the growth of the eco friendly food packaging market in the country
10.3.5 SPAIN
10.3.5.1 Increased demand for on-the-go products due to the hectic lifestyle of consumers to drive the growth of the packaging industry in the country
10.3.6 RUSSIA
10.3.6.1 Investments from foreign players for innovative packaging to drive the market growth for food packaging in the country
10.3.7 NETHERLANDS
10.3.7.1 The high spending capacity of consumers in the country to drive the market growth for eco-friendly packages
10.3.8 REST OF EUROPE
10.4 ASIA PACIFIC
10.4.1 CHINA
10.4.1.1 Improving economy is generating disposable income and hence fueling the eco-friendly food packaging market
10.4.2 JAPAN
10.4.2.1 Awareness among consumers and strict rules and regulations to drive the market for eco-friendly food packaging in Japan
10.4.3 INDIA
10.4.3.1 Increasing trend of online foodservice providers is driving the market for eco-friendly food packaging in India
10.4.4 AUSTRALIA & NEW ZEALAND
10.4.4.1 Consumer demand and awareness are the key factors impacting the growth of eco-friendly food packaging in the region
10.4.5 SOUTH KOREA
10.4.5.1 Consumer safety, convenience, and environmental concerns are driving the market for eco-friendly food packaging in South Korea
10.4.6 REST OF ASIA PACIFIC
10.5 SOUTH AMERICA
10.5.1 BRAZIL
10.5.1.1 Reusable glass bottles are trending in the country, which is projected to drive the market growth for eco-friendly beverage packaging
10.5.2 ARGENTINA
10.5.2.1 Paper packaging for food products is extensively used in the country as it contributes to the market growth
10.5.3 REST OF SOUTH AMERICA
10.6 REST OF THE WORLD (ROW)
10.6.1 MIDDLE EAST
10.6.1.1 Investment by foreign companies in the region is driving the market for eco-friendly packaging
10.6.2 AFRICA
10.6.2.1 Urbanization and changing lifestyles are the major drivers of eco-friendly food packaging in Africa
11 COMPETITIVE LANDSCAPE (Page No. - 155)
11.1 ECO-FRIENDLY FOOD PACKAGING MARKET OVERVIEW
11.2 COMPETITIVE LEADERSHIP MAPPING
11.2.1 DYNAMIC DIFFERENTIATORS
11.2.2 INNOVATORS
11.2.3 VISIONARY LEADERS
11.2.4 EMERGING COMPANIES
11.3 STRENGTH OF PRODUCT PORTFOLIO
11.4 BUSINESS STRATEGY EXCELLENCE
11.5 COMPETITIVE SCENARIO
11.5.1 NEW PRODUCT LAUNCHES
11.5.2 MERGERS & ACQUISITIONS
11.5.3 EXPANSIONS
11.5.4 COLLABORATIONS & JOINT VENTURES
11.5.5 PARTNERSHIPS & AGREEMENTS
12 COMPANY PROFILES (Page No. - 171)
(Business overview, Products offered, Recent Developments, SWOT analysis, MNM view)*
12.1 AMCOR
12.2 MONDI GROUP
12.3 SEALED AIR CORPORATION
12.4 BALL CORPORATION
12.5 TETRA PAK
12.6 CROWN HOLDINGS INC.
12.7 BASF
12.8 HUHTAMAKI OYJ
12.9 WESTROCK COMPANY
12.10 SMURFIT KAPPA GROUP
12.11 SONOCO PRODUCTS COMPANY
12.12 EVERGREEN PACKAGING
12.13 ELOPAK
12.14 WINPAK LTD.
12.15 BERRY GLOBAL
12.16 PRINTPAK INC.
12.17 PAPERFOAM
12.18 SUSTAINABLE PACKAGING INDUSTRIES
12.19 GWP GROUP
12.20 SWEDBRAND GROUPS
*Details on Business overview, Products offered, Recent Developments, SWOT analysis, MNM view might not be captured in case of unlisted companies.
13 APPENDIX (Page No. - 234)
13.1 DISCUSSION GUIDE
13.2 KNOWLEDGE STORE: MARKETSANDMARKETS’ SUBSCRIPTION PORTAL
13.3 AVAILABLE CUSTOMIZATIONS
13.4 RELATED REPORTS
13.5 AUTHOR DETAILS
LIST OF TABLES (133 Tables)
Table 1 USD Exchange Rates, 2014–2018
Table 2 Properties of Food Packaging Materials With Respect to Their Recyclability
Table 3 Eco-Friendly Food Packaging Market Size, by Material, 2018–2025 (USD Billion)
Table 4 Market Size, by Material, 2018–2025 (MMT)
Table 5 Market Size for Paper & Paperboard, by Region, 2018–2025 (USD Billion)
Table 6 Market Size for Paper & Paperboard, by Region, 2018–2025 (MMT)
Table 7 Market Size for Rigid Paper & Paperboard, by Region, 2018–2025 (USD Billion)
Table 8 Market Size for Flexible Paper & Paperboard, by Region, 2018–2025 (USD Billion)
Table 9 Market Size for Plastic, by Region, 2018–2025 (USD Billion)
Table 10 Market Size for Plastic, by Region, 2018–2025 (MMT)
Table 11 Market Size for Rigid Plastic, by Region, 2018–2025 (USD Billion)
Table 12 Market Size for Flexible Plastic, by Region, 2018–2025 (USD Billion)
Table 13 Market Size for Metal, by Region, 2018–2025 (USD Billion)
Table 14 Market Size for Metal, by Region, 2018–2025 (MMT)
Table 15 Market Size for Metal Cans, by Region, 2018–2025 (USD Billion)
Table 16 Market Size for Metal Barrels & Drums, by Region, 2018–2025 (USD Billion)
Table 17 Market Size for Other Metal Packaging, by Region, 2018–2025 (USD Billion)
Table 18 Market Size for Glass, by Region, 2018–2025 (USD Billion)
Table 19 Market Size for Glass, by Region, 2018–2025 (MMT)
Table 20 Market Size for Glass Jars, by Region, 2018–2025 (USD Billion)
Table 21 Market Size for Glass Bottles, by Region, 2018–2025 (USD Billion)
Table 22 Market Size for Other Glass Packaging, by Region, 2018–2025 (USD Billion)
Table 23 Market Size for Other Packaging Materials, by Region, 2018–2025 (USD Billion)
Table 24 Market Size for Other Packaging Materials, by Region, 2018–2025 (MMT)
Table 25 Market Size, by Application, 2018–2025 (USD Billion)
Table 26 Market Size, by Region, 2018–2025 (USD Billion)
Table 27 Eco-Friendly Bakery & Confectionery Product Packaging Market Size, by Region, 2018–20
Table 28 Eco-Friendly Convenience Food Packaging Market Size, by Region, 2018–2025 (USD Billion)
Table 29 Eco-Friendly Meat, Fish, And Poultry Packaging Market Size, by Region, 2018–2025 (USD Billion)
Table 30 Eco-Friendly Fruit & Vegetable Packaging Market Size, by Region, 2018–2025 (USD Billion)
Table 31 Eco-Friendly Dairy Product Packaging Market Size, by Region, 2018–2025 (USD Billion)
Table 32 Eco-Friendly Food Packaging Market Size for Other Food Products, by Region, 2018–2025 (USD Billion)
Table 33 Eco-Friendly Beverage Packaging Market Size, by Region, 2018–2025 (USD Billion)
Table 34 Eco-Friendly Alcoholic Beverage Packaging Market Size, by Region, 2018–2025 (USD Billion)
Table 35 Eco-Friendly Non-Alcoholic Beverage Packaging Market Size, by Region, 2018–2025 (USD Billion)
Table 36 Market Size, by Type, 2018–2025 (USD Billion)
Table 37 Recycled Content Food Packaging Market Size, by Region, 2018–2025 (USD Billion)
Table 38 Eco-Friendly Bakery & Confectionery Product Packaging Market Size, by Region, 2018–2025 (USD Billion)
Table 39 Eco-Friendly Reusable Packaging Market Size, by Region, 2018–2025 (USD Billion)
Table 40 Market Size, by Technique, 2018–2025 (USD Billion)
Table 41 Active Packaging for Food & Beverage Applications
Table 42 Market Size for Active Packaging, by Region, 2018–2025 (USD Billion)
Table 43 Market Size for Molded Packaging, by Region, 2018–2025 (USD Billion)
Table 44 Market Size for Alternate Fiber Packaging, by Region, 2018–2025 (USD Billion)
Table 45 Market Size for Multipurpose Packaging, by Region, 2018–2025 (USD Billion)
Table 46 Market Size, by Region, 2018–2025 (USD Billion)
Table 47 North America: Market Size, by Material, 2018–2025 (USD Billion)
Table 48 North America: Market Size, by Material, 2018–2025 (MMT)
Table 49 North America: Paper & Paperboard Food Packaging Market Size, by Material, 2018–2025 (USD Billion)
Table 50 North America: Eco-Friendly Plastic Food Packaging Market Size, by Material, 2018–2025 (USD Billion)
Table 51 North America: Metal Food Packaging Market Size, by Material, 2018–2025 (USD Billion)
Table 52 North America: Glass Food Packaging Market Size, by Material, 2018–2025 (USD Billion)
Table 53 North America: Market Size, by Application, 2018–2025 (USD Billion)
Table 54 North America: Market for Food, by Application, 2018–2025 (USD Billion)
Table 55 North America: Eco-Friendly Beverage Packaging Market Size, by Application, 2018–2025 (USD Billion)
Table 56 North America: Market Size, by Type, 2018–2025 (USD Billion)
Table 57 North America: Market Size, by Technique, 2018–2025 (USD Billion)
Table 58 North America: Market Size, by Country, 2018–2025 (USD Billion)
Table 59 Us: Market Size, by Material, 2018–2025 (USD Billion)
Table 60 Canada: Market Size, by Material, 2018–2025 (USD Billion)
Table 61 Mexico: Market Size, by Material, 2018–2025 (USD Billion)
Table 62 Europe: Market Size, by Material, 2018–2025 (USD Billion)
Table 63 Europe: Market Size, by Material, 2018–2025 (MMT)
Table 64 Europe: Market Size for Paper & Paperboard, by Material, 2018–2025 (USD Billion)
Table 65 Europe: Market Size for Plastic, by Material, 2018–2025 (USD Billion)
Table 66 Europe: Market Size for Metal, by Material, 2018–2025 (USD Billion)
Table 67 Europe: Market Size for Glass, by Material, 2018–2025 (USD Billion)
Table 68 Europe: Market Size, by Application, 2018–2025 (USD Billion)
Table 69 Europe: Market Size for Food, by Application, 2018–2025 (USD Billion)
Table 70 Europe: Market Size for Beverage, by Application, 2018–2025 (USD Billion)
Table 71 Europe: Eco-Friendly Food Packaging Market Size, by Type, 2018–2025 (USD Billion)
Table 72 Europe: Market Size, by Technique, 2018–2025 (USD Billion)
Table 73 Europe: Market Size, by Country, 2018–2025 (USD Billion)
Table 74 Germany: Eco-Friendly Packaging Market Size, by Material, 2018–2025 (USD Billion)
Table 75 France: Eco-Friendly Packaging Market Size, by Material, 2018–2025 (USD Billion)
Table 76 Italy: Eco-Friendly Packaging Market Size, by Material, 2018–2025 (USD Billion)
Table 77 Uk: Eco-Friendly Packaging Market Size, by Material, 2018–2025 (USD Billion)
Table 78 Spain: Eco-Friendly Packaging Market Size, by Material, 2018–2025 (USD Billion)
Table 79 Russia: Eco-Friendly Packaging Market Size, by Material, 2018–2025 (USD Billion)
Table 80 Netherlands: Eco-Friendly Packaging Market Size, by Material, 2018–2025 (USD Billion)
Table 81 Rest of Europe: Eco-Friendly Packaging Market Size, by Material, 2018–2025 (USD Billion)
Table 82 Asia Pacific: Market Size, by Material, 2018–2025 (USD Billion)
Table 83 Asia Pacific: Market Size, by Material, 2018–2025 (MMT)
Table 84 Asia Pacific: Paper & Paper Board Food Packaging Market Size, by Material, 2018–2025 (USD Billion)
Table 85 Asia Pacific: Eco-Friendly Plastic Food Packaging Market Size, by Material, 2018–2025 (USD Billion)
Table 86 Asia Pacific: Eco-Friendly Metal Food Packaging Market Size, by Material, 2018–2025 (USD Billion)
Table 87 Asia Pacific: Eco-Friendly Glass Food Packaging Market Size, by Material, 2018–2025 (USD Billion)
Table 88 Asia Pacific: Eco-Friendly Food Packaging Market Size, by Application, 2018–2025 (USD Billion)
Table 89 Asia Pacific: Market Size for Food, by Application, 2018–2025 (USD Billion)
Table 90 Asia Pacific: Eco-Friendly Beverage Packaging Market Size, by Application, 2018–2025 (USD Billion)
Table 91 Asia Pacific: Market Size, by Type, 2018–2025 (USD Billion)
Table 92 Asia Pacific: Market Size, by Technique, 2018–2025 (USD Billion)
Table 93 Asia Pacific: Market Size, by Country/Region, 2018–2025 (USD Billion)
Table 94 China: Market Size, by Material, 2018–2025 (USD Billion)
Table 95 Japan: Market Size, by Material, 2018–2025 (USD Billion)
Table 96 India: Market Size, by Material, 2018–2025 (USD Billion)
Table 97 Australia & New Zealand: Market Size, by Material, 2018–2025 (USD Billion)
Table 98 South Korea: Market Size, by Material, 2018–2025 (USD Billion)
Table 99 Rest of Asia Pacific: Market Size, by Material, 2018–2025 (USD Billion)
Table 100 South America: Market Size, by Material, 2018–2025 (USD Billion)
Table 101 South America: Market Size, by Material, 2018–2025 (MMT)
Table 102 South America: Market Size for Paper & Paperboard, by Material, 2018–2025 (USD Billion)
Table 103 South America: Market Size for Plastic, by Material, 2018–2025 (USD Billion)
Table 104 South America: Market Size for Metal, by Material, 2018–2025 (USD Billion)
Table 105 South America: Market Size for Glass, by Material, 2018–2025 (USD Billion)
Table 106 South America: Eco-Friendly Food Packaging Market Size, by Application, 2018–2025 (USD Billion)
Table 107 South America: Market Size for Food, by Application, 2018–2025 (USD Billion)
Table 108 South America: Market Size for Beverage, by Application, 2018–2025 (USD Billion)
Table 109 South America: Market Size, by Type, 2018–2025 (USD Billion)
Table 110 South America: Market Size, by Technique, 2018–2025 (USD Billion)
Table 111 South America: Market Size, by Country, 2018–2025 (USD Billion)
Table 112 Brazil: Eco-Friendly Packaging Market Size, by Material, 2018–2025 (USD Billion)
Table 113 Argentina: Eco-Friendly Packaging Market Size, by Material, 2018–2025 (USD Billion)
Table 114 Rest of South America: Eco-Friendly Packaging Market Size, by Material, 2018–2025 (USD Billion)
Table 115 ROW: Market Size, by Region, 2018–2025 (USD Billion)
Table 116 ROW: Market Size, by Application, 2018–2025 (USD Billion)
Table 117 ROW: Market Size for Food, by Sub-Application, 2018–2025 (USD Billion)
Table 118 ROW: Market Size for Beverages, by Sub-Application, 2018–2025 (USD Billion)
Table 119 ROW: Market Size, by Material, 2018–2025 (USD Billion)
Table 120 ROW: Market Size, by Material, 2018–2025 (MMT)
Table 121 ROW: Market Size for Paper & Paperboard, by Subtype, 2018–2025 (USD Billion)
Table 122 ROW: Eco-Friendly Food Packaging Market Size for Plastic, by Subtype, 2018–2025 (USD Billion)
Table 123 ROW: Market Size for Metal, by Subtype, 2018–2025 (USD Billion)
Table 124 ROW: Market Size for Glass, by Sub application, 2018–2025 (USD Billion)
Table 125 ROW: Market Size, by Technique, 2018–2025 (USD Billion)
Table 126 ROW: Market Size, by Type, 2018–2025 (USD Billion)
Table 127 Middle East: Market Size, by Material, 2018–2025 (USD Billion)
Table 128 Africa: Market Size, by Material, 2018–2025 (USD Billion)
Table 129 New Product Launches, 2018–2020
Table 130 Mergers & Acquisitions, 2018–2020
Table 131 Expansions, 2019
Table 132 Joint Ventures & Collaborations, 2018–2020
Table 133 Partnerships And Agreements, 2018–2020
LIST OF FIGURES (46 Figures)
FIGURE 1 Market Segmentation
FIGURE 2 Research Design
FIGURE 3 Data Triangulation Methodology
FIGURE 4 Market Size, by Material, 2020 Vs. 2025 (USD Billion)
FIGURE 5 Market Size, by Type, 2020 Vs. 2025 (USD Billion)
FIGURE 6 Market Size, by Technique, 2018–2025 (USD Billion)
FIGURE 7 Market Size, by Application, 2019
FIGURE 8 Asia Pacific to be the Fastest-Growing Region in the Market During the Forecast Period
FIGURE 9 Eco-Friendly Food Packaging: A Steady Market with High-Growth Potential
FIGURE 10 Europe to Dominate the Market for Eco-Friendly Food Packaging During the Forecast Period
FIGURE 11 The Paper And Paperboard Segment, by Material, ss Projected to Grow at the Highest Rate from 2020 to 2025
FIGURE 12 The Food Segment to Account for the Largest Share in the Eco-Friendly Food Packaging Market from 2020 to 2025 (USD Billion)
FIGURE 13 The Paper and Paperboard Segment, by Application, Accounted for the Largest Share in the European Eco Friendly Food Packaging Market
FIGURE 14 Countries in Asia Pacific to Grow at the Highest Rates during the Forecast Period
FIGURE 15 Market Dynamics
FIGURE 16 Global Green Packaging Market (2015–2020)
FIGURE 17 Fluctuating Prices of Natural Gas in The US
FIGURE 18 Value Chain: Market
FIGURE 19 Yc-Ycc Shift for the Eco Friendly Food Packaging Market
FIGURE 20 Market Size, by Material, 2020 Vs. 2025 (USD Billion)
FIGURE 21 Market Size, by Application, 2020 Vs. 2025 (USD Billion)
FIGURE 22 Market Size, by Type, 2020 Vs. 2025 (USD Billion)
FIGURE 23 Market Size, by Technique, 2020 Vs. 2025 (USD Billion)
FIGURE 24 Market Share (Value), by Key Country, 2019
FIGURE 25 Europe to Lead the Global Eco-Friendly Food Packaging Market, 2020 –2025 (USD Billion)
FIGURE 26 Europe: Market Snapshot
FIGURE 27 Breakdown of the Russian Packaging Material Market
FIGURE 28 Asia Pacific: Market Snapshot
FIGURE 29 Row: Market Size, by Region, 2020–2025 (USD Billion)
FIGURE 30 Market: Competitive Leadership Mapping, 2019
FIGURE 31 Key Developments of the Leading Players in the Market, 2017–2019
FIGURE 32 Product Portfolio Analysis of Top Players in the Eco Friendly Food Packaging Market
FIGURE 33 Business Strategy Excellence of Top Players in the Market
FIGURE 34 Amcor: Company Snapshot
FIGURE 35 Mondi Group: Company Snapshot
FIGURE 36 Sealed Air Corporation: Company Snapshot
FIGURE 37 Ball Corporation: Company Snapshot
FIGURE 38 Tetra Pak: Company Snapshot
FIGURE 39 Crown Holdings Inc.: Company Snapshot
FIGURE 40 BASF: Company Snapshot
FIGURE 41 Huhtamaki Oyj: Company Snapshot
FIGURE 42 Westrock Packaging Company: Company Snapshot
FIGURE 43 Smurfit Kappa Group: Company Snapshot
FIGURE 44 Sonoco Products Company: Company Snapshot
FIGURE 45 Winpak Ltd.: Company Snapshot
FIGURE 46 Berry Global: Company Snapshot
The study involved four major activities in estimating the market size for the eco-friendly food packaging market. Exhaustive secondary research was conducted to collect information on the market, peer market, and parent market. The next step was to validate these findings, assumptions, and sizing with industry experts across the value chain through primary research. Both the top-down and bottom-up approaches were employed to estimate the complete market size. After that, market breakdown and data triangulation were used to estimate the market size of segments and subsegments.
Secondary Research
In the secondary research process, various secondary sources such as Hoovers, Bloomberg BusinessWeek, and Dun & Bradstreet were referred to, to identify and collect information for this study. These secondary sources included annual reports, press releases & investor presentations of companies, white papers, certified publications, articles by recognized authors, gold & silver standard websites, food safety organizations, regulatory bodies, trade directories, and databases.
Primary Research
The market comprises several stakeholders, such as raw material suppliers, processors, end-product manufacturers, and regulatory organizations in the supply chain. The demand-side of the market is characterized by the presence of various food service providers, food & beverage product manufacturers and suppliers, importers and exporters of food & beverages. The supply-side stakeholders include exogenous eco-friendly food packaging manufacturers. The demand-side stakeholders include distributors, importers, and exporters of eco-friendly food packaging, and end-users. Various primary sources from both the supply- and demand-sides of the market were interviewed to obtain qualitative and quantitative information.
Given below is the breakdown of the primary respondents:
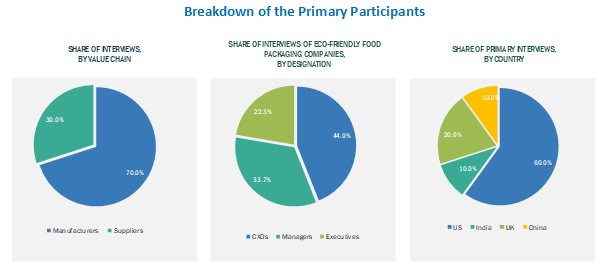
To know about the assumptions considered for the study, download the pdf brochure
Eco-friendly Food Packaging Market Size Estimation
Both the top-down and bottom-up approaches were used to estimate and validate the total size of the eco friendly food packaging market. These methods were also used extensively to estimate the size of various subsegments in the market. The research methodology used to estimate the market size includes the following:
- The key players were identified through extensive primary and secondary research.
- The value chain and market size of the market, in terms of value and volume, were determined through primary and secondary research.
- All percentage shares, splits, and breakdowns were determined using secondary sources and verified through primary sources.
- All possible parameters that affect the market covered in this research study were accounted for, viewed in extensive detail, verified through primary research, and analyzed to obtain the final quantitative and qualitative data.
- The research included the study of reports, reviews, and newsletters of top market players, along with extensive interviews for opinions from key leaders, such as CXOs, directors, and marketing executives.
Data Triangulation
After arriving at the overall market size from the estimation process described above, the total market was split into several segments. To complete the overall market engineering process and arrive at the exact statistics for all segments, the data triangulation and market breakdown procedures were employed, wherever applicable. The data was triangulated by studying various factors and trends from both the demand and supply sides. Also, the market size was validated using both the top-down and bottom-up approaches. It was then verified through primary interviews. Hence, three approaches were adopted—top-down approach, bottom-up approach, and the one involving expert interviews. Only when the values arrived at from the three points match, the data is assumed to be correct.
Report Objectives
- To describe and forecast the eco-friendly food packaging market, in terms of material, application, type, technique, and region
- To describe and forecast the market, in terms of value, by region–North America, Europe, Asia Pacific, South America and the Rest of the World—along with their respective countries
- To provide detailed information regarding the major factors influencing market growth (drivers, restraints, opportunities, and challenges)
- To strategically analyze micro-markets with respect to individual growth trends, prospects, and contributions to the overall market
- To study the complete value chain of the market
- To analyze opportunities in the market for stakeholders by identifying the high-growth segments of the eco friendly food packaging market
- To strategically profile the key players and comprehensively analyze their market positions, in terms of ranking and core competencies, along with details on the competitive landscape of market leaders
- To analyze strategic approaches, such as acquisitions & divestments, expansions, product launches & approvals, and agreements, in the eco-friendly food packaging market
Available Customizations
Based on the given market data, MarketsandMarkets offers customizations in the reports according to client-specific requirements. The available customization options are as follows:
Geographic Analysis
- Further breakdown of the Rest of the World eco-friendly food packaging market into countries in the Middle East & Africa
- Further breakdown of the Rest of Asia Pacific market into Thailand, Malaysia, Indonesia, and Vietnam
- Further breakdown of the Rest of European market into Denmark, Turkey, Sweden, Belgium, and other EU and non-EU countries


Growth opportunities and latent adjacency in Eco-friendly Food Packaging Market