Smart Food Packaging Market

Report Code FB 9292
Published in Jan, 2025, By MarketsandMarkets™
Download PDF

Choose License Type

Buy Report Now Inquire Before Buying

Smart Food Packaging Market by Type (Active Packaging, Intelligent Packaging, Modified Atmosphere Packaging, Edible Packaging), Application, Functionality, Material and Region - Global Forecast to 2029


Overview

The global market for smart food packaging has been estimated to be USD 26.42 billion in 2024 and is projected to grow at a rate of 6.2% between 2024 and 2029.

The smart food packaging market is revolutionizing the preservation, monitoring, and consumption of food products. In response to the increasing demand for improved food safety, extended shelf life, and sustainability, smart packaging solutions have emerged as vital innovations in the global food industry. These solutions utilize advanced technologies, such as active packaging with antimicrobial agents, gas scavengers, and humidity regulators, to actively control and enhance food quality. Intelligent packaging technologies, including indicators, sensors, RFID (Radio Frequency Identification), NFC (Near Field Communication), and blockchain-enabled traceability, facilitate real-time monitoring of food freshness and product authenticity. The integration of these technologies adds value for manufacturers, retailers, and consumers by improving food safety, reducing waste, and ensuring compliance with regulations. The market also features innovations like modified atmosphere packaging (MAP), which optimizes internal conditions within food packaging, and edible and biodegradable packaging, which supports sustainability efforts.

The smart food packaging market is rapidly evolving, driven by technological advancements and changing consumer preferences for sustainability, convenience, and safety. Initially developed to extend shelf life and minimize spoilage, smart packaging now includes a wide range of features, such as real-time monitoring, traceability, and active environmental control within the packaging. Post-pandemic, there is heightened concern over food safety regulations and increased awareness of foodborne illnesses. Consequently, manufacturers and retailers are adopting active and intelligent packaging to ensure product integrity and minimize contamination risks. For example, antimicrobial agents and gas scavengers incorporated into packaging have effectively preserved freshness and prevented spoilage, thus reducing food waste and enhancing profitability for producers and distributors.

Smart Food Packaging Market

Attractive Opportunities in the Smart Food Packaging Market

NORTH AMERICA

North America accounted for the largest market share in 2024, while the US is expected to dominate the North American smart food packaging market.

North America leads in adopting smart packaging technologies like RFID, sensors, and active packaging.

Increase in innovation in eco-friendly, biodegradable, and recyclable smart packaging materials to drive demand.

Growing demand for convenience, food safety, and sustainability drives the need for intelligent packaging solutions.

Strict food safety regulations in the US and Canada promote the use of smart packaging for traceability and safety.

Global Smart Food Packaging Market Dynamics

Driver: Rising Consumer Demand for Convenience and Transparency

The rise of smart packaging is being driven by growing consumer demand for convenience and transparency. Today’s consumers prefer packaging that is not only easy to use but also provides detailed information about product quality, origin, and freshness. Smart packaging utilizes technologies such as indicators, sensors, and QR codes to enhance transparency and build consumer trust. Consequently, the market for smart packaging continues to expand. Smart packaging has significantly evolved by combining advanced technology with sustainable materials, creating a beneficial situation for both businesses and consumers. This trend began in the early 2000s when environmental concerns prompted companies to explore innovative packaging solutions that could reduce waste and improve product safety. By integrating smart technology into packaging, businesses can monitor product conditions in real-time, which helps preserve freshness and minimizes environmental impact. Sensors and QR codes provide real-time data, allowing brands to cultivate stronger relationships with consumers through increased transparency.

Smart packaging offers significant economic advantages by optimizing packaging processes, reducing food waste, and enhancing operational efficiency. For example, freshness-monitoring sensors help ensure food is consumed while still fresh, leading to less spoilage and cost savings. This also aligns with rising consumer demand for eco-friendly solutions and helps lower expenses related to product returns during shipping. QR codes play a vital role in smart packaging by enhancing consumer interactions and improving brand perception. Brands like Coca-Cola, PepsiCo, and Amazon have effectively integrated QR codes, leading to increased sales and customer engagement. Consumers can scan these codes for product information, promotions, and loyalty programs, fostering brand loyalty and transparency regarding ingredients and sourcing. As technology progresses, smart packaging will be essential for competitive businesses, enhancing product safety and sustainability. Its growth reflects the demand for safer, transparent packaging, making it a crucial investment for future success.

Restraint: High Costs of Advanced Packaging Solutions

The high costs associated with advanced packaging solutions present a significant challenge to the adoption of smart food packaging technologies. Solutions that integrate sensors, RFID (Radio Frequency Identification), and blockchain technology for tracking and monitoring product conditions often require sophisticated materials and complex manufacturing processes. This results in a substantial increase in production costs compared to traditional packaging methods. This cost burden is particularly challenging for small and medium-sized manufacturers. Unlike large corporations, which can absorb these additional expenses or pass them on to consumers, smaller businesses often operate with tighter profit margins. Consequently, the high initial investment needed to implement smart packaging technologies can be prohibitive, preventing many of these companies from entering or expanding in the smart packaging market.

This issue is even more pronounced in developing regions, where cost sensitivity is higher, and the infrastructure to support advanced technologies may be less robust. In these areas, manufacturers are likely to prioritize cost-effective solutions over more advanced options, further limiting the market’s growth potential. While the long-term benefits of smart packaging—such as reducing food waste and enhancing supply chain transparency—are evident, the upfront capital investment required for research, development, and implementation remains a significant barrier to widespread adoption.


Opportunity: Adoption of AI and Big Data for Real-Time Analytics

The integration of AI, machine learning, and big data analytics into the smart food packaging industry is revolutionizing how manufacturers and retailers monitor product conditions and analyze consumer behavior. By utilizing these technologies, companies can gain real-time insights into critical factors such as temperature, freshness, and spoilage risks, enabling them to respond quickly to any issues and prevent product waste. This also opens up opportunities for predictive analytics, which can forecast future trends, optimize packaging designs, and streamline supply chain operations. For instance, manufacturers can use data to anticipate demand fluctuations, ensuring optimal inventory management, while retailers can better understand consumer preferences, tailoring packaging and marketing strategies to drive sales. These insights ultimately lead to reduced costs, improved supply chain efficiency, and minimal waste, providing a significant competitive advantage in the marketplace.

Real-world applications of blockchain in food traceability include:

  • Tracking agricultural products: Blockchain can log detailed information about the cultivation, harvest, and transport of food products, allowing consumers to verify the origin and authenticity of the items they purchase. Organic certifications and other labels can also be stored on the blockchain to ensure their validity.
  • Monitoring processing and distribution: Blockchain technology is used to track cold chain logistics, ensuring that perishable goods are kept at the correct temperature throughout the supply chain. It also enables detailed ingredient traceability, which is crucial for managing allergens and food additives.
  • Enhancing retail transparency: Retailers can leverage blockchain to provide consumers with comprehensive product details, including the origin, production methods, and any certifications the product holds. Blockchain also helps prevent fraud by verifying the authenticity of branded products.

Challenge: Potential Consumer Privacy Concerns

In the smart food packaging market, the use of advanced technologies such as RFID and blockchain for product traceability and supply chain optimization raises important consumer privacy concerns. These technologies generate large amounts of data, including information on product movement, handling conditions, and potentially consumer behavior—especially if linked to loyalty programs or apps. This extensive data collection could lead to privacy violations if consumers feel unaware of or uncomfortable with how their information is being used. To address these concerns, companies must prioritize transparency by clearly informing consumers about the data being collected and how it will be used. They should also ensure compliance with strict data protection regulations like GDPR and CCPA. Additionally, maintaining data security is crucial, as smart packaging systems can be vulnerable to cyberattacks, which may expose sensitive consumer information. Implementing opt-in mechanisms for consumer consent and allowing consumers to control or delete their data are essential steps in building trust. Overall, while RFID and blockchain offer operational advantages, companies must carefully manage privacy risks to ensure consumer confidence in smart food packaging technologies.

Global Smart Food Packaging Market Ecosystem Analysis

The smart food packaging market is a dynamic ecosystem driven by consumer demand for convenience, safety, and sustainability. On the demand side, consumers are seeking packaging that enhances food quality, extends shelf life, and provides traceability through features like sensors, temperature indicators, and QR codes. Active packaging, which interacts with the food to extend freshness, modified atmosphere packaging (MAP) for better preservation, and edible packaging made from natural ingredients are becoming increasingly popular. On the supply side, manufacturers are innovating with advanced technologies such as RFID, NFC, and biodegradable materials to meet these demands. Collaborations between packaging producers, technology providers, and food brands are fueling growth, while advancements in raw materials and smart technologies continue to shape the future of this market.

Top Companies in Smart Food Packaging Market
 

The Modified Atmosphere Packaging segment is expected to account for the largest share during the forecast period.

Modified atmosphere packaging (MAP) holds a significant share in the smart food packaging market due to its effectiveness in preserving freshness and extending the shelf life of food products. MAP involves altering the atmosphere inside the packaging, typically by adjusting the levels of oxygen, carbon dioxide, and nitrogen, to slow down the degradation process and maintain food quality. This technology is widely adopted in fresh produce, meat, and dairy products, where maintaining optimal freshness is crucial. As consumer demand for longer shelf life and food safety increases, MAP continues to be a key driver in the growth of the smart food packaging market. There have been various developments in the smart food packaging sector, particularly in the use of MAP to address food spoilage and enhance product shelf life. For instance, in June 2023, ProAmpac launched its innovative fiber-based MAP, known as the RAP Sandwich Wedge, in the North American market. This packaging solution is designed specifically for sandwiches and wraps, bringing the benefits of MAP to a fiber-based format. The packaging aims to address the rising demand for reducing food spoilage and enhancing sustainability, as it combines the advantages of MAP with eco-friendly fiber materials.

The plastic material segment will account for the largest share during the forecast period.

Smart packaging solutions made from plastic materials are preferred for their versatility, cost-effectiveness, and the ease with which they can integrate advanced technologies like sensors, RFID tags, and modified atmosphere packaging (MAP). Plastic materials such as polyethylene, polypropylene, and polyester are commonly used in these solutions due to their durability, lightweight nature, and ability to provide a protective barrier against external elements. Moreover, plastic’s compatibility with features like active and intelligent packaging, which can monitor and extend the shelf life of food, further solidifies its position in the market. Although there are growing concerns regarding environmental impact, innovations in biodegradable and recyclable plastics are addressing sustainability challenges, ensuring that plastic remains a vital material in the smart food packaging sector.

North America dominated the smart food packaging market.

North America has a well-established food supply chain and strict food safety regulations, which significantly contribute to the growth of smart food packaging technologies. There is an increasing focus on extending shelf life, especially for perishable goods in the export-import trade, further solidifying the region’s leading position in the market. As a crucial player in the global food export-import trade, North America benefits from smart food packaging technologies like MAP and active packaging. These solutions are particularly effective in preserving perishable items during long-distance transportation, ensuring the quality and safety of food products across borders. 

The stringent food safety regulations enforced in the US and Canada, including guidelines from the FDA and other local authorities, have raised the standards for food packaging. Smart packaging aids in meeting these requirements by improving product traceability and ensuring the safe transportation and storage of food. Consequently, North America remains the leading region in the smart food packaging market, with the US and Canada making significant contributions in market size, technological innovations, and regulatory support. 

US: HIGHEST CAGR IN 2024–2029
US: LARGEST MARKET IN THE REGION
Smart Food Packaging Market by region

Recent Developments of Smart Food Packaging Market

  • In August 2024, Amcor’s launch of AmFiber Performance Paper packaging in North America, a curbside-recyclable, high-barrier paper solution, strengthened its position in the smart food packaging market. By offering improved barrier properties and easy recyclability, AmFiber caters to consumer demand for sustainable packaging while maintaining operational performance. This innovation supports Amcor’s commitment to sustainability, enabling brands to meet consumer preferences for eco-friendly solutions without compromising on functionality, thus enhancing Amcor’s competitive edge.
  • In March 2024, Berry Global and Mitsubishi Gas Chemical partnered to develop MXD6, a recyclable barrier resin recognized for compatibility with polypropylene recycling streams. This innovation enhanced food packaging by extending shelf life without using EVOH and reducing food and plastic waste. It advanced sustainability in smart food packaging, addressing performance limitations and improving recyclability for tubes, jars, and bottles. 
  • In January 2024, SEE’s CRYOVAC compostable overwrap tray revolutionizes smart food packaging with its biobased, USDA-certified resin and industrial compostability. This sustainable alternative to EPS foam trays maintains strength and performance while reducing environmental impact. The tray aligns with processors’ existing production lines, advancing SEE’s commitment to innovation and sustainability, and supporting customers’ eco-friendly goals in the smart protein packaging market. 
  • In October 2023, Mitsubishi Gas Chemical launched PFAS-free AGELESS, the first oxygen absorber meeting growing regulatory demands in the smart food packaging market. This innovation replaced PFAS with a proprietary formula, addressing environmental concerns while maintaining performance, enabling extended shelf life, and preserving food quality. The launch positioned MGC as a leader in sustainable packaging solutions, enhancing its competitiveness and aligning with trends prioritizing safety and environmental sustainability.
  • In November 2021, Amcor launched IMPRESSIONS in collaboration with MGJ, enabling brands to customize closure liners with QR codes or logos. This innovation enhances digital engagement, allowing consumers to access brand information and promotions directly through their mobile devices. By integrating personalized, interactive experiences, IMPRESSIONS strengthens brand connections and appeals to digitally savvy consumers. In the smart food packaging market, this technology helps Amcor differentiate its offerings, enhances consumer interaction, and drives growth in digital and consumer-focused packaging solutions.

Key Market Players

List of Top Smart Food Packaging Market Companies

The Smart Food Packaging Market is dominated by a few major players that have a wide regional presence. The major players in the Smart Food Packaging Market are

Want to explore hidden markets that can drive new revenue in Smart Food Packaging Market?

Scope of the Report

Report Attribute Details
Market size available for years 2024–2029
Base year considered 2023
Forecast period 2024–2029
Forecast units Value (USD)
Segments Covered By Packaging Type, Application, Funtionality, Material
Regions covered North America, Europe, Asia Pacific, South America and RoW


Key Questions Addressed by the Report

Which region is projected to account for the largest share of the smart food packaging market?
North America dominated the smart food packaging market, worth USD 9.7 billion in 2024, and is projected to reach USD 13.2 billion by 2029, at a CAGR of 6.0% during the forecast period.
What is the current size of the global smart food packaging market?
The global smart food packaging market was valued at USD 26.4 billion in 2024. It is projected to reach USD 35.7 billion by 2029, recording a CAGR of 6.2% during the forecast period.
Who are the key players in the market?
The key players in this market include Amcor plc (Switzerland), Sealed Air (US), Berry Global Inc. (US), THE TETRA LAVAL GROUP (Switzerland), Mondi (UK), Toyo Seikan Group Holdings, Ltd. (Japan), Crown (US), 3M (US), Timestrip UK LTD (UK), MITSUBISHI GAS CHEMICAL COMPANY, INC. (Japan), Multisorb (US), Huhtamäki Oyj (Finland), Stepac (Israel), Checkpoint Systems, Inc. (US) and Novipax Buyer, LLC (US).
What are the factors driving the smart food packaging market?
  • Consumer Demand for Freshness: Increasing preference for longer shelf life and fresher products.
  • Sustainability Initiatives: Shift towards eco-friendly and recyclable packaging materials.
  • Technological Advancements: Integration of sensors and indicators for real-time monitoring of food quality.
  • Regulatory Compliance: Stringent food safety regulations driving the need for smart packaging solutions.
  • Food Waste Reduction: Smart packaging helps reduce food wastage by monitoring spoilage and expiration.
  • Convenience and Safety: Rising demand for packaging that enhances convenience and ensures food safety.
  • E-commerce Growth: Increasing online food delivery boosting the demand for smart packaging solutions
Which packaging type segment accounted for the largest smart food packaging market share?
The Modified Atmosphere packaging segment accounted for the largest market share in the packaging type segent.


Personalize This Research

  • Triangulate with your Own Data
  • Get Data as per your Format and Definition
  • Gain a Deeper Dive on a Specific Application, Geography, Customer or Competitor
  • Any level of Personalization
Request A Free Customisation

Let Us Help You

  • What are the Known and Unknown Adjacencies Impacting the Smart Food Packaging Market
  • What will your New Revenue Sources be?
  • Who will be your Top Customer; what will make them switch?
  • Defend your Market Share or Win Competitors
  • Get a Scorecard for Target Partners
Customized Workshop Request

Table of Contents

Exclusive indicates content/data unique to MarketsandMarkets and not available with any competitors.

TITLE
PAGE NO
INTRODUCTION
28
RESEARCH METHODOLOGY
33
EXECUTIVE SUMMARY
41
PREMIUM INSIGHTS
47
MARKET OVERVIEW
53
  • 5.1 INTRODUCTION
  • 5.2 MACROECONOMIC OUTLOOK
    RISING REGULATORY PRESSURES AND FOOD SAFETY STANDARDS
  • 5.3 MARKET DYNAMICS
    DRIVERS
    - Advancements in IoT and sensor technology
    - Blockchain technology revolutionizing food supply chains
    - Companies’ adoption of RFID technology in food safety and supply chain management
    - Growing awareness of plastic waste driving demand for biodegradable edible packaging from natural polymers like seaweed and starch
    RESTRAINTS
    - Lack of consumer awareness in developing markets
    - Consumer privacy concerns
    OPPORTUNITIES
    - Increased demand for cold chain monitoring
    - Food authentication and anti-counterfeiting
    CHALLENGES
    - High initial costs
  • 5.4 IMPACT OF GEN AI ON SMART FOOD PACKAGING
    INTRODUCTION
    APPLICATIONS OF AI IN SMART PACKAGING
INDUSTRY TRENDS
64
  • 6.1 INTRODUCTION
  • 6.2 VALUE CHAIN
    RAW MATERIAL SOURCING
    MANUFACTURING OF PACKAGING COMPONENTS
    QUALITY CONTROL AND TESTING
    PACKAGING ASSEMBLY
    DISTRIBUTION AND LOGISTICS
    END-USER INTERACTION AND DISPOSAL
    DATA INTEGRATION AND ANALYSIS (DIGITAL SUPPLY CHAIN)
  • 6.3 SUPPLY CHAIN
  • 6.4 TRENDS IMPACTING CUSTOMER BUSINESS
  • 6.5 PRICING ANALYSIS
    AVERAGE SELLING PRICE TREND ANALYSIS
  • 6.6 MARKET MAPPING AND ECOSYSTEM OF SMART FOOD PACKAGING
    DEMAND SIDE
    SUPPLY SIDE
  • 6.7 TRADE DATA
  • 6.8 PORTER’S FIVE FORCES ANALYSIS
    INTENSITY OF COMPETITIVE RIVALRY
    BARGAINING POWER OF SUPPLIERS
    BARGAINING POWER OF BUYERS
    THREAT OF SUBSTITUTES
    THREAT OF NEW ENTRANTS
  • 6.9 TECHNOLOGY ANALYSIS
    KEY TECHNOLOGY
    - Nanotechnology
    - Self-healing packaging
    COMPLEMENTARY TECHNOLOGY
    - Augmented reality (AR)
    - AI & machine learning
    ADJACENT TECHNOLOGY
    - Recycling & circular economy innovation
  • 6.10 PATENT ANALYSIS
  • 6.11 TARIFF AND REGULATORY LANDSCAPE
    REGULATORY BODIES, GOVERNMENT AGENCIES, AND OTHER ORGANIZATIONS
    SMART FOOD PACKAGING REGULATIONS IN NORTH AMERICA
    - US
    - Canada
    SMART FOOD PACKAGING REGULATIONS IN EUROPEAN UNION
    SMART FOOD PACKAGING REGULATIONS IN ASIA PACIFIC
    - China
    - India
  • 6.12 CASE STUDIES
  • 6.13 KEY CONFERENCES AND EVENTS
  • 6.14 KEY STAKEHOLDERS AND BUYING CRITERIA
    KEY STAKEHOLDERS IN BUYING PROCESS
    BUYING CRITERIA
SMART FOOD PACKAGING MARKET, BY APPLICATION
87
  • 7.1 INTRODUCTION
  • 7.2 BEVERAGES
    IMPROVED QUALITY, FRESHNESS, AND SUSTAINABILITY TO DRIVE MARKET
  • 7.3 FRUITS & VEGETABLES
    ENHANCED FRESHNESS AND REDUCED WASTE TO DRIVE GROWTH
  • 7.4 MEAT, POULTRY & SEAFOOD
    FOOD QUALITY AND SAFETY IN MEAT, POULTRY, AND SEAFOOD MARKETS TO DRIVE GROWTH
  • 7.5 BAKED & CONFECTIONERY PRODUCTS
    ENHANCED FOOD FRESHNESS AND SHELF-LIFE EXTENSION TO DRIVE MARKET
  • 7.6 MILK & DAIRY PRODUCTS
    ENHANCED FOOD SAFETY AND SUSTAINABILITY TO DRIVE GROWTH
  • 7.7 PROCESSED FOODS
    INCREASED PRODUCTION AND CONSUMPTION OF PROCESSED FOODS TO DRIVE DEMAND
  • 7.8 OTHER APPLICATIONS
SMART FOOD PACKAGING MARKET, BY FUNCTIONALITY
99
  • 8.1 INTRODUCTION
  • 8.2 BARRIER PROTECTION
    ENHANCED FOOD QUALITY AND SAFETY THROUGH ADVANCED BARRIER PROTECTION TO DRIVE DEMAND
  • 8.3 MOISTURE & GAS CONTROL
    OPTIMIZED FOOD FRESHNESS WITH ADVANCED MOISTURE & GAS CONTROL TO DRIVE GROWTH
  • 8.4 TEMPERATURE REGULATION
    ENHANCED COLD CHAIN EFFICIENCY WITH ADVANCED TEMPERATURE REGULATION TO DRIVE MARKET
  • 8.5 FOOD SAFETY MONITORING
    ADVANCING FOOD SAFETY WITH REAL-TIME MONITORING TO DRIVE DEMAND
  • 8.6 SHELF-LIFE EXTENSION
    ENHANCED FOOD QUALITY AND REDUCED WASTAGE TO DRIVE MARKET
  • 8.7 CONSUMER INTERACTION AND ENGAGEMENT
    EVOLVING RETAIL AND CONSUMER EXPERIENCE TO DRIVE RFID AND NFC PACKAGING
  • 8.8 PRODUCT AUTHENTICATION
    ENHANCED PRODUCT INTEGRITY WITH ADVANCED AUTHENTICITY AND TRACEABILITY PACKAGING TECHNOLOGIES TO DRIVE DEMAND
SMART FOOD PACKAGING MARKET, BY MATERIAL
109
  • 9.1 INTRODUCTION
  • 9.2 PLASTIC
    COST-EFFECTIVENESS AND EASY AVAILABILITY TO DRIVE MARKET
  • 9.3 PAPER & PAPERBOARD
    ECO-FRIENDLY INNOVATION AND SUSTAINABILITY TO DRIVE GROWTH
  • 9.4 METAL
    DURABILITY AND INNOVATION TO DRIVE GROWTH OF METAL IN SMART FOOD PACKAGING
  • 9.5 GLASS
    PREMIUM LOOK AND NON-REACTIVE NATURE OF GLASS TO DRIVE DEMAND
  • 9.6 OTHER MATERIAL TYPES
SMART FOOD PACKAGING MARKET, BY PACKAGING TYPE
117
  • 10.1 INTRODUCTION
  • 10.2 ACTIVE PACKAGING
    ANTIMICROBIAL AGENTS
    - Enhanced food safety and shelf life to drive market
    GAS SCAVENGERS
    - Extended shelf life and quality preservation to drive growth
    MOISTURE CONTROL (HUMIDITY REGULATORS) & TEMPERATURE CONTROL PACKAGING
    - Enhanced food freshness and sustainability with moisture and temperature control packaging to drive demand
  • 10.3 INTELLIGENT PACKAGING
    INDICATORS AND BIOSENSORS
    - Enhanced food safety and freshness with advanced oxygen indicators and sensors in packaging to drive market
    RFID (RADIO-FREQUENCY IDENTIFICATION) & NFC (NEAR FIELD COMMUNICATION)
    - Evolving retail and consumer experience to drive RFID and NFC packaging
    AUTHENTICATION AND TRACEABILITY TECHNOLOGIES
    - Enhanced product integrity with advanced authenticity and traceability packaging technologies to drive demand
  • 10.4 MODIFIED ATMOSPHERE PACKAGING (MAP)
    VACUUM PACKAGING
    - Maximizing freshness and efficiency with vacuum packaging for extended shelf life to drive market
    GAS-FLUSHED PACKAGING
    - Flavor, texture, and color enhancing qualities to drive market growth in snacks and meat industry
  • 10.5 EDIBLE PACKAGING
    SUSTAINABILITY AND ECO-FRIENDLY SOLUTIONS TO DRIVE GROWTH
  • 10.6 OTHER PACKAGING TYPES
SMART FOOD PACKAGING MARKET, BY TECHNOLOGY
131
  • 11.1 INTRODUCTION
  • 11.2 RFID & NFC
    CASE STUDIES OF RFID APPLICATIONS IN FOOD MANUFACTURING INDUSTRY
  • 11.3 SENSORS AND BIOSENSORS
    MONITORING ENVIRONMENTAL CONDITIONS
    BIOSENSORS FOR QUALITY ASSURANCE
    GAS SENSORS FOR SPOILAGE DETECTION
    QUALITY CONTROL AND CONSUMER ENGAGEMENT
  • 11.4 BLOCKCHAIN TECHNOLOGY
  • 11.5 INTERNET OF PACKAGING (IOP)
    INTERNET OF PACKAGING IN FOOD INDUSTRY
    BENEFITS OF INTERNET OF PACKAGING
  • 11.6 ADVANCED 3D PRINTING
  • 11.7 OTHER TECHNOLOGIES
SMART FOOD PACKAGING MARKET, BY REGION
139
  • 12.1 INTRODUCTION
  • 12.2 NORTH AMERICA
    US
    - Rise in consumption and sales of food products to drive demand
    CANADA
    - Increased consumption of baked and confectionary products to drive market
    MEXICO
    - Growth of meat and poultry industry to drive market
  • 12.3 EUROPE
    GERMANY
    - Increased growth in German food processing industry to drive market
    UK
    - Growth in food industry to drive demand for innovative and sustainable smart packaging solutions
    FRANCE
    - Demand for baked goods to drive market
    SPAIN
    - High growth of food industry to drive market
    ITALY
    - Increased demand and production of processed food to drive market
    REST OF EUROPE
  • 12.4 ASIA PACIFIC
    CHINA
    - Increased import & production of meat & seafood to drive market
    INDIA
    - Increased trade of food items to drive MAP and active food packaging market
    JAPAN
    - Increased demand from food industry to drive smart food packaging market
    AUSTRALIA & NEW ZEALAND
    - Growth of food industry and sustainability concerns in packaging to drive market
    REST OF ASIA PACIFIC
  • 12.5 SOUTH AMERICA
    BRAZIL
    - Growth of retail food industry to drive market
    ARGENTINA
    - Increased meat and poultry production to drive smart food packaging market
    REST OF SOUTH AMERICA
  • 12.6 REST OF THE WORLD
    MIDDLE EAST
    - Rising demand for processed foods and meat to drive market
    AFRICA
    - Increased demand for food and meat to drive market
COMPETITIVE LANDSCAPE
192
  • 13.1 OVERVIEW
  • 13.2 KEY PLAYER STRATEGIES/RIGHT TO WIN
  • 13.3 REVENUE ANALYSIS
  • 13.4 MARKET SHARE ANALYSIS, 2023
    MARKET RANKING ANALYSIS
  • 13.5 COMPANY EVALUATION MATRIX: KEY PLAYERS, 2023
    STARS
    EMERGING LEADERS
    PERVASIVE PLAYERS
    PARTICIPANTS
    COMPANY FOOTPRINT: KEY PLAYERS, 2023
    - Company footprint
    - Regional footprint
    - Type footprint
    - Application footprint
  • 13.6 COMPANY EVALUATION MATRIX: START-UPS/SMES, 2023
    PROGRESSIVE COMPANIES
    RESPONSIVE COMPANIES
    DYNAMIC COMPANIES
    STARTING BLOCKS
    COMPETITIVE BENCHMARKING: START-UPS/SMES, 2023
    - Key start-ups/SMEs
    - Competitive benchmarking of key start-ups/SMEs
  • 13.7 COMPANY VALUATION AND FINANCIAL METRICS
  • 13.8 BRAND/PRODUCT COMPARISON
  • 13.9 COMPETITIVE SCENARIO AND TRENDS
    PRODUCT LAUNCHES AND ENHANCEMENTS
    DEALS
    EXPANSIONS
COMPANY PROFILES
220
  • 14.1 KEY PLAYERS
    AMCOR PLC
    - Business overview
    - Products/Solutions/Services offered
    - Recent developments
    - MnM view
    SEALED AIR
    - Business overview
    - Products/Solutions/Services offered
    - Recent developments
    - MnM view
    BERRY GLOBAL INC.
    - Business overview
    - Products/Solutions/Services offered
    - Recent developments
    - MnM view
    THE TETRA LAVAL GROUP
    - Business overview
    - Products/Solutions/Services offered
    - Recent developments
    - MnM view
    MONDI
    - Business overview
    - Products/Solutions/Services offered
    - Recent developments
    - MnM view
    TOYO SEIKAN GROUP HOLDINGS, LTD.
    - Business overview
    - Products/Solutions/Services offered
    - MnM view
    CROWN
    - Business overview
    - Products/Solutions/Services offered
    - MnM view
    3M
    - Business overview
    - Products/Solutions/Services offered
    - MnM view
    MITSUBISHI GAS CHEMICAL COMPANY, INC.
    - Business overview
    - Products/Solutions/Services offered
    - Recent developments
    - MnM view
    MULTISORB
    - Business overview
    - Products/Solutions/Services offered
    - MnM view
    HUHTAMÄKI OYJ
    - Business overview
    - Products/Solutions/Services offered
    - Recent developments
    - MnM view
    STEPAC
    - Business overview
    - Products/Solutions/Services offered
    - Recent developments
    - MnM view
    CHECKPOINT SYSTEMS, INC.
    - Business overview
    - Products/Solutions/Services offered
    - Recent developments
    - MnM view
    NOVIPAX BUYER, LLC
    - Business overview
    - Products/Solutions/Services offered
    - Recent developments
    - MnM view
    TIMESTRIP UK LTD
    - Business overview
    - Products/Solutions/Services offered
    - Recent developments
    - MnM view
  • 14.2 OTHER PLAYERS
    INSIGNIA TECHNOLOGIES LTD.
    - Business overview
    - Products/Solutions/Services offered
    - Recent developments
    - MnM view
    VARCODE
    - Business overview
    - Products/Solutions/Services offered
    - Recent developments
    - MnM view
    TIPA LTD
    - Business overview
    - Products/Solutions/Services offered
    - Recent developments
    - MnM view
    FLEXIBLE PACKAGING SOLUTIONS
    - Business overview
    - Products/Solutions/Services offered
    - Recent developments
    - MnM view
    NOTPLA
    - Business overview
    - Products/Solutions/Services offered
    - MnM view
    VITSAB INTERNATIONAL AB
    TEMPIX AB
    BIOWRAP
    IT'S FRESH LIMITED
    KELP INDUSTRIES LTD
ADJACENT & RELATED MARKETS
294
  • 15.1 INTRODUCTION
  • 15.2 LIMITATIONS
  • 15.3 FOOD PACKAGING FILMS MARKET
    MARKET DEFINITION
    MARKET OVERVIEW
  • 15.4 FOOD & BEVERAGE METAL CANS MARKET
    MARKET DEFINITION
    MARKET OVERVIEW
APPENDIX
298
  • 16.1 DISCUSSION GUIDE
  • 16.2 KNOWLEDGESTORE: MARKETSANDMARKETS’ SUBSCRIPTION PORTAL
  • 16.3 CUSTOMIZATION OPTIONS
  • 16.4 RELATED REPORTS
  • 16.5 AUTHOR DETAILS
LIST OF TABLES
 
  • TABLE 1 USD EXCHANGE RATES CONSIDERED, 2020–2023
  • TABLE 2 SMART FOOD PACKAGING MARKET, 2024 VS. 2029
  • TABLE 3 US FOOD & DRUG ADMINISTRATION (FDA): RECALLS, MARKET WITHDRAWALS, AND SAFETY ALERTS, DECEMBER 2024
  • TABLE 4 BLOCKCHAIN APPLICATIONS IN SUPPLY CHAIN MANAGEMENT
  • TABLE 5 SMART FOOD PACKAGING MARKET: INDICATIVE SELLING PRICE, BY INTELLIGENT PACKAGING, 2020–2022 (USD/PIECE)
  • TABLE 6 SMART FOOD PACKAGING MARKET: SUPPLY CHAIN (ECOSYSTEM)
  • TABLE 7 IMPORT DATA OF PLASTIC-BASED PACKAGES, BY COUNTRY, 2021–2023 (IN KGS)
  • TABLE 8 EXPORT DATA OF PLASTIC-BASED PACKAGES, BY COUNTRY, 2021–2023 (IN KGS)
  • TABLE 9 SMART FOOD PACKAGING MARKET: PORTER’S FIVE FORCES ANALYSIS
  • TABLE 10 PATENTS PERTAINING TO SMART FOOD PACKAGING, 2020–2024
  • TABLE 11 NORTH AMERICA: LIST OF REGULATORY BODIES, GOVERNMENT AGENCIES, AND OTHER ORGANIZATIONS
  • TABLE 12 EUROPE: LIST OF REGULATORY BODIES, GOVERNMENT AGENCIES, AND OTHER ORGANIZATIONS
  • TABLE 13 ASIA PACIFIC: LIST OF REGULATORY BODIES, GOVERNMENT AGENCIES, AND OTHER ORGANIZATIONS
  • TABLE 14 CASE STUDY: CRYOVAC SHRINK EQUIPMENT DELIVERS SUPERIOR PERFORMANCE FOR LEADING MEAT PROCESSOR
  • TABLE 15 CASE STUDY: TETRA PAK’S CONNECTED PACKAGE PLATFORM POWERS CONSUMER ENGAGEMENT AND BOOSTS SALES FOR DAIRY PRODUCERS
  • TABLE 16 SMART FOOD PACKAGING MARKET: KEY CONFERENCES AND EVENTS
  • TABLE 17 INFLUENCE OF STAKEHOLDERS ON BUYING PROCESS IN SMART FOOD PACKAGING TYPES (%)
  • TABLE 18 KEY BUYING CRITERIA FOR TOP THREE APPLICATION INDUSTRIES OF SMART FOOD PACKAGING
  • TABLE 19 SMART FOOD PACKAGING MARKET, BY APPLICATION, 2019–2023 (USD MILLION)
  • TABLE 20 SMART FOOD PACKAGING MARKET, BY APPLICATION, 2024–2029 (USD MILLION)
  • TABLE 21 BEVERAGES: SMART FOOD PACKAGING MARKET, BY REGION, 2019–2023 (USD MILLION)
  • TABLE 22 BEVERAGES: SMART FOOD PACKAGING MARKET, BY REGION, 2024–2029 (USD MILLION)
  • TABLE 23 FRUITS & VEGETABLES: SMART FOOD PACKAGING MARKET, BY REGION, 2019–2023 (USD MILLION)
  • TABLE 24 FRUITS & VEGETABLES: SMART FOOD PACKAGING MARKET, BY REGION, 2024–2029 (USD MILLION)
  • TABLE 25 MEAT, POULTRY & SEAFOOD: SMART FOOD PACKAGING MARKET, BY REGION, 2019–2023 (USD MILLION)
  • TABLE 26 MEAT, POULTRY & SEAFOOD: SMART FOOD PACKAGING MARKET, BY REGION, 2024–2029 (USD MILLION)
  • TABLE 27 BAKED & CONFECTIONERY PRODUCTS: SMART FOOD PACKAGING MARKET, BY REGION, 2019–2023 (USD MILLION)
  • TABLE 28 BAKED & CONFECTIONERY PRODUCTS: SMART FOOD PACKAGING MARKET, BY REGION, 2024–2029 (USD MILLION)
  • TABLE 29 MILK & DAIRY PRODUCTS: SMART FOOD PACKAGING MARKET, BY REGION, 2019–2023 (USD MILLION)
  • TABLE 30 MILK & DAIRY PRODUCTS: SMART FOOD PACKAGING MARKET, BY REGION, 2024–2029 (USD MILLION)
  • TABLE 31 PROCESSED FOODS: SMART FOOD PACKAGING MARKET, BY REGION, 2019–2023 (USD MILLION)
  • TABLE 32 PROCESSED FOODS: SMART FOOD PACKAGING MARKET, BY REGION, 2024–2029 (USD MILLION)
  • TABLE 33 OTHER APPLICATIONS: SMART FOOD PACKAGING MARKET, BY REGION, 2019–2023 (USD MILLION)
  • TABLE 34 OTHER APPLICATIONS: SMART FOOD PACKAGING MARKET, BY REGION, 2024–2029 (USD MILLION)
  • TABLE 35 SMART FOOD PACKAGING MARKET, BY FUNCTIONALITY, 2019–2023 (USD MILLION)
  • TABLE 36 SMART FOOD PACKAGING MARKET, BY FUNCTIONALITY, 2024–2029 (USD MILLION)
  • TABLE 37 BARRIER PROTECTION: SMART FOOD PACKAGING MARKET, BY REGION, 2019–2023 (USD MILLION)
  • TABLE 38 BARRIER PROTECTION: SMART FOOD PACKAGING MARKET, BY REGION, 2024–2029 (USD MILLION)
  • TABLE 39 MOISTURE & GAS CONTROL: SMART FOOD PACKAGING MARKET, BY REGION, 2019–2023 (USD MILLION)
  • TABLE 40 MOISTURE & GAS CONTROL: SMART FOOD PACKAGING MARKET, BY REGION, 2024–2029 (USD MILLION)
  • TABLE 41 TEMPERATURE REGULATION: SMART FOOD PACKAGING MARKET, BY REGION, 2019–2023 (USD MILLION)
  • TABLE 42 TEMPERATURE REGULATION: SMART FOOD PACKAGING MARKET, BY REGION, 2024–2029 (USD MILLION)
  • TABLE 43 FOOD SAFETY MONITORING: SMART FOOD PACKAGING MARKET, BY REGION, 2019–2023 (USD MILLION)
  • TABLE 44 FOOD SAFETY MONITORING: SMART FOOD PACKAGING MARKET, BY REGION, 2024–2029 (USD MILLION)
  • TABLE 45 SHELF-LIFE EXTENSION: SMART FOOD PACKAGING MARKET, BY REGION, 2019–2023 (USD MILLION)
  • TABLE 46 SHELF-LIFE EXTENSION: SMART FOOD PACKAGING MARKET, BY REGION, 2024–2029 (USD MILLION)
  • TABLE 47 CONSUMER INTERACTION AND ENGAGEMENT: SMART FOOD PACKAGING MARKET, BY REGION, 2019–2023 (USD MILLION)
  • TABLE 48 CONSUMER INTERACTION AND ENGAGEMENT: SMART FOOD PACKAGING MARKET, BY REGION, 2024–2029 (USD MILLION)
  • TABLE 49 PRODUCT AUTHENTICATION: SMART FOOD PACKAGING MARKET, BY REGION, 2019–2023 (USD MILLION)
  • TABLE 50 PRODUCT AUTHENTICATION: SMART FOOD PACKAGING MARKET, BY REGION, 2024–2029 (USD MILLION)
  • TABLE 51 SMART FOOD PACKAGING MARKET, BY MATERIAL, 2019–2023 (USD MILLION)
  • TABLE 52 SMART FOOD PACKAGING MARKET, BY MATERIAL, 2024–2029 (USD MILLION)
  • TABLE 53 PLASTIC: SMART FOOD PACKAGING MARKET, BY REGION, 2019–2023 (USD MILLION)
  • TABLE 54 PLASTIC: SMART FOOD PACKAGING MARKET, BY REGION, 2024–2029 (USD MILLION)
  • TABLE 55 PAPER & PAPERBOARD: SMART FOOD PACKAGING MARKET, BY REGION, 2019–2023 (USD MILLION)
  • TABLE 56 PAPER & PAPERBOARD: SMART FOOD PACKAGING MARKET, BY REGION, 2024–2029 (USD MILLION)
  • TABLE 57 METAL: SMART FOOD PACKAGING MARKET, BY REGION, 2019–2023 (USD MILLION)
  • TABLE 58 METAL: SMART FOOD PACKAGING MARKET, BY REGION, 2024–2029 (USD MILLION)
  • TABLE 59 GLASS: SMART FOOD PACKAGING MARKET, BY REGION, 2019–2023 (USD MILLION)
  • TABLE 60 GLASS: SMART FOOD PACKAGING MARKET, BY REGION, 2024–2029 (USD MILLION)
  • TABLE 61 OTHER MATERIAL TYPES: SMART FOOD PACKAGING MARKET, BY REGION, 2019–2023 (USD MILLION)
  • TABLE 62 OTHER MATERIAL TYPES: SMART FOOD PACKAGING MARKET, BY REGION, 2024–2029 (USD MILLION)
  • TABLE 63 SMART FOOD PACKAGING MARKET, BY PACKAGING TYPE, 2019–2023 (USD MILLION)
  • TABLE 64 SMART FOOD PACKAGING MARKET, BY PACKAGING TYPE, 2024–2029 (USD MILLION)
  • TABLE 65 ACTIVE PACKAGING: SMART FOOD PACKAGING MARKET, BY SUB-PACKAGING TYPE, 2019–2023 (USD MILLION)
  • TABLE 66 ACTIVE PACKAGING: SMART FOOD PACKAGING MARKET, BY SUB-PACKAGING TYPE, 2024–2029 (USD MILLION)
  • TABLE 67 ACTIVE PACKAGING: SMART FOOD PACKAGING MARKET, BY REGION, 2019–2023 (USD MILLION)
  • TABLE 68 ACTIVE PACKAGING: SMART FOOD PACKAGING MARKET, BY REGION, 2024–2029 (USD MILLION)
  • TABLE 69 INTELLIGENT PACKAGING: SMART FOOD PACKAGING MARKET, BY SUB-PACKAGING TYPE, 2019–2023 (USD MILLION)
  • TABLE 70 INTELLIGENT PACKAGING: SMART FOOD PACKAGING MARKET, BY SUB-PACKAGING TYPE, 2024–2029 (USD MILLION)
  • TABLE 71 INTELLIGENT PACKAGING: SMART FOOD PACKAGING MARKET, BY REGION, 2019–2023 (USD MILLION)
  • TABLE 72 INTELLIGENT PACKAGING: SMART FOOD PACKAGING MARKET, BY REGION, 2024–2029 (USD MILLION)
  • TABLE 73 MODIFIED ATMOSPHERE PACKAGING: SMART FOOD PACKAGING MARKET, BY SUB-PACKAGING TYPE, 2019–2023 (USD MILLION)
  • TABLE 74 MODIFIED ATMOSPHERE PACKAGING: SMART FOOD PACKAGING MARKET, BY SUB-PACKAGING TYPE, 2024–2029 (USD MILLION)
  • TABLE 75 MODIFIED ATMOSPHERE PACKAGING: SMART FOOD PACKAGING MARKET, BY REGION, 2019–2023 (USD MILLION)
  • TABLE 76 MODIFIED ATMOSPHERE PACKAGING: SMART FOOD PACKAGING MARKET, BY REGION, 2024–2029 (USD MILLION)
  • TABLE 77 EDIBLE PACKAGING: SMART FOOD PACKAGING MARKET, BY REGION, 2019–2023 (USD MILLION)
  • TABLE 78 EDIBLE PACKAGING: SMART FOOD PACKAGING MARKET, BY REGION, 2024–2029 (USD MILLION)
  • TABLE 79 OTHER PACKAGING TYPES: SMART FOOD PACKAGING MARKET, BY REGION, 2019–2023 (USD MILLION)
  • TABLE 80 OTHER PACKAGING TYPES: SMART FOOD PACKAGING MARKET, BY REGION, 2024–2029 (USD MILLION)
  • TABLE 81 SMART FOOD PACKAGING MARKET, BY REGION, 2019–2023 (USD MILLION)
  • TABLE 82 SMART FOOD PACKAGING MARKET, BY REGION, 2024–2029 (USD MILLION)
  • TABLE 83 NORTH AMERICA: SMART FOOD PACKAGING MARKET, BY COUNTRY, 2019–2023 (USD MILLION)
  • TABLE 84 NORTH AMERICA: SMART FOOD PACKAGING MARKET, BY COUNTRY, 2024–2029 (USD MILLION)
  • TABLE 85 NORTH AMERICA: SMART FOOD PACKAGING MARKET, BY PACKAGING TYPE, 2019–2023 (USD MILLION)
  • TABLE 86 NORTH AMERICA: SMART FOOD PACKAGING MARKET, BY PACKAGING TYPE, 2024–2029 (USD MILLION)
  • TABLE 87 NORTH AMERICA: SMART FOOD PACKAGING MARKET, BY APPLICATION, 2019–2023 (USD MILLION)
  • TABLE 88 NORTH AMERICA: SMART FOOD PACKAGING MARKET, BY APPLICATION, 2024–2029 (USD MILLION)
  • TABLE 89 NORTH AMERICA: SMART FOOD PACKAGING MARKET, BY MATERIAL, 2019–2023 (USD MILLION)
  • TABLE 90 NORTH AMERICA: SMART FOOD PACKAGING MARKET, BY MATERIAL, 2024–2029 (USD MILLION)
  • TABLE 91 NORTH AMERICA: SMART FOOD PACKAGING MARKET, BY FUNCTIONALITY, 2019–2023 (USD MILLION)
  • TABLE 92 NORTH AMERICA: SMART FOOD PACKAGING MARKET, BY FUNCTIONALITY, 2024–2029 (USD MILLION)
  • TABLE 93 US: SMART FOOD PACKAGING MARKET, BY APPLICATION, 2019–2023 (USD MILLION)
  • TABLE 94 US: SMART FOOD PACKAGING MARKET, BY APPLICATION, 2024–2029 (USD MILLION)
  • TABLE 95 CANADA: SMART FOOD PACKAGING MARKET, BY APPLICATION, 2019–2023 (USD MILLION)
  • TABLE 96 CANADA: SMART FOOD PACKAGING MARKET, BY APPLICATION, 2024–2029 (USD MILLION)
  • TABLE 97 MEXICO: SMART FOOD PACKAGING MARKET, BY APPLICATION, 2019–2023 (USD MILLION)
  • TABLE 98 MEXICO: SMART FOOD PACKAGING MARKET, BY APPLICATION, 2024–2029 (USD MILLION)
  • TABLE 99 EUROPE: SMART FOOD PACKAGING MARKET, BY COUNTRY, 2019–2023 (USD MILLION)
  • TABLE 100 EUROPE: SMART FOOD PACKAGING MARKET, BY COUNTRY, 2024–2029 (USD MILLION)
  • TABLE 101 EUROPE: SMART FOOD PACKAGING MARKET, BY PACKAGING TYPE, 2019–2023 (USD MILLION)
  • TABLE 102 EUROPE: SMART FOOD PACKAGING MARKET, BY PACKAGING TYPE, 2024–2029 (USD MILLION)
  • TABLE 103 EUROPE: SMART FOOD PACKAGING MARKET, BY APPLICATION, 2019–2023 (USD MILLION)
  • TABLE 104 EUROPE: SMART FOOD PACKAGING MARKET, BY APPLICATION, 2024–2029 (USD MILLION)
  • TABLE 105 EUROPE: SMART FOOD PACKAGING MARKET, BY MATERIAL, 2019–2023 (USD MILLION)
  • TABLE 106 EUROPE: SMART FOOD PACKAGING MARKET, BY MATERIAL, 2024–2029 (USD MILLION)
  • TABLE 107 EUROPE: SMART FOOD PACKAGING MARKET, BY FUNCTIONALITY, 2019–2023 (USD MILLION)
  • TABLE 108 EUROPE: SMART FOOD PACKAGING MARKET, BY FUNCTIONALITY, 2024–2029 (USD MILLION)
  • TABLE 109 GERMANY: SMART FOOD PACKAGING MARKET, BY APPLICATION, 2019–2023 (USD MILLION)
  • TABLE 110 GERMANY: SMART FOOD PACKAGING MARKET, BY APPLICATION, 2024–2029 (USD MILLION)
  • TABLE 111 UK: SMART FOOD PACKAGING MARKET, BY APPLICATION, 2019–2023 (USD MILLION)
  • TABLE 112 UK: SMART FOOD PACKAGING MARKET, BY APPLICATION, 2024–2029 (USD MILLION)
  • TABLE 113 FRANCE: SMART FOOD PACKAGING MARKET, BY APPLICATION, 2019–2023 (USD MILLION)
  • TABLE 114 FRANCE: SMART FOOD PACKAGING MARKET, BY APPLICATION, 2024–2029 (USD MILLION)
  • TABLE 115 SPAIN: SMART FOOD PACKAGING MARKET, BY APPLICATION, 2019–2023 (USD MILLION)
  • TABLE 116 SPAIN: SMART FOOD PACKAGING MARKET, BY APPLICATION, 2024–2029 (USD MILLION)
  • TABLE 117 ITALY: SMART FOOD PACKAGING MARKET, BY APPLICATION, 2019–2023 (USD MILLION)
  • TABLE 118 ITALY: SMART FOOD PACKAGING MARKET, BY APPLICATION, 2024–2029 (USD MILLION)
  • TABLE 119 REST OF EUROPE: SMART FOOD PACKAGING MARKET, BY APPLICATION, 2019–2023 (USD MILLION)
  • TABLE 120 REST OF EUROPE: SMART FOOD PACKAGING MARKET, BY APPLICATION, 2024–2029 (USD MILLION)
  • TABLE 121 ASIA PACIFIC: SMART FOOD PACKAGING MARKET, BY COUNTRY, 2019–2023 (USD MILLION)
  • TABLE 122 ASIA PACIFIC: SMART FOOD PACKAGING MARKET, BY COUNTRY, 2024–2029 (USD MILLION)
  • TABLE 123 ASIA PACIFIC: SMART FOOD PACKAGING MARKET, BY PACKAGING TYPE, 2019–2023 (USD MILLION)
  • TABLE 124 ASIA PACIFIC: SMART FOOD PACKAGING MARKET, BY PACKAGING TYPE, 2024–2029 (USD MILLION)
  • TABLE 125 ASIA PACIFIC: SMART FOOD PACKAGING MARKET, BY APPLICATION, 2019–2023 (USD MILLION)
  • TABLE 126 ASIA PACIFIC: SMART FOOD PACKAGING MARKET, BY APPLICATION, 2024–2029 (USD MILLION)
  • TABLE 127 ASIA PACIFIC: SMART FOOD PACKAGING MARKET, BY MATERIAL, 2019–2023 (USD MILLION)
  • TABLE 128 ASIA PACIFIC: SMART FOOD PACKAGING MARKET, BY MATERIAL, 2024–2029 (USD MILLION)
  • TABLE 129 ASIA PACIFIC: SMART FOOD PACKAGING MARKET, BY FUNCTIONALITY, 2019–2023 (USD MILLION)
  • TABLE 130 ASIA PACIFIC: SMART FOOD PACKAGING MARKET, BY FUNCTIONALITY, 2024–2029 (USD MILLION)
  • TABLE 131 CHINA: SMART FOOD PACKAGING MARKET, BY APPLICATION, 2019–2023 (USD MILLION)
  • TABLE 132 CHINA: SMART FOOD PACKAGING MARKET, BY APPLICATION, 2024–2029 (USD MILLION)
  • TABLE 133 INDIA: SMART FOOD PACKAGING MARKET, BY APPLICATION, 2019–2023 (USD MILLION)
  • TABLE 134 INDIA: SMART FOOD PACKAGING MARKET, BY APPLICATION, 2024–2029 (USD MILLION)
  • TABLE 135 JAPAN: SMART FOOD PACKAGING MARKET, BY APPLICATION, 2019–2023 (USD MILLION)
  • TABLE 136 JAPAN: SMART FOOD PACKAGING MARKET, BY APPLICATION, 2024–2029 (USD MILLION)
  • TABLE 137 AUSTRALIA & NEW ZEALAND: SMART FOOD PACKAGING MARKET, BY APPLICATION, 2019–2023 (USD MILLION)
  • TABLE 138 AUSTRALIA & NEW ZEALAND: SMART FOOD PACKAGING MARKET, BY APPLICATION, 2024–2029 (USD MILLION)
  • TABLE 139 REST OF ASIA PACIFIC: SMART FOOD PACKAGING MARKET, BY APPLICATION, 2019–2023 (USD MILLION)
  • TABLE 140 REST OF ASIA PACIFIC: SMART FOOD PACKAGING MARKET, BY APPLICATION, 2024–2029 (USD MILLION)
  • TABLE 141 SOUTH AMERICA: SMART FOOD PACKAGING MARKET, BY COUNTRY, 2019–2023 (USD MILLION)
  • TABLE 142 SOUTH AMERICA: SMART FOOD PACKAGING MARKET, BY COUNTRY, 2024–2029 (USD MILLION)
  • TABLE 143 SOUTH AMERICA: SMART FOOD PACKAGING MARKET, BY PACKAGING TYPE, 2019–2023 (USD MILLION)
  • TABLE 144 SOUTH AMERICA: SMART FOOD PACKAGING MARKET, BY PACKAGING TYPE, 2024–2029 (USD MILLION)
  • TABLE 145 SOUTH AMERICA: SMART FOOD PACKAGING MARKET, BY APPLICATION, 2019–2023 (USD MILLION)
  • TABLE 146 SOUTH AMERICA: SMART FOOD PACKAGING MARKET, BY APPLICATION, 2024–2029 (USD MILLION)
  • TABLE 147 SOUTH AMERICA: SMART FOOD PACKAGING MARKET, BY MATERIAL, 2019–2023 (USD MILLION)
  • TABLE 148 SOUTH AMERICA: SMART FOOD PACKAGING MARKET, BY MATERIAL, 2024–2029 (USD MILLION)
  • TABLE 149 SOUTH AMERICA: SMART FOOD PACKAGING MARKET, BY FUNCTIONALITY, 2019–2023 (USD MILLION)
  • TABLE 150 SOUTH AMERICA: SMART FOOD PACKAGING MARKET, BY FUNCTIONALITY, 2024–2029 (USD MILLION)
  • TABLE 151 BRAZIL: SMART FOOD PACKAGING MARKET, BY APPLICATION, 2019–2023 (USD MILLION)
  • TABLE 152 BRAZIL: SMART FOOD PACKAGING MARKET, BY APPLICATION, 2024–2029 (USD MILLION)
  • TABLE 153 ARGENTINA: SMART FOOD PACKAGING MARKET, BY APPLICATION, 2019–2023 (USD MILLION)
  • TABLE 154 ARGENTINA: SMART FOOD PACKAGING MARKET, BY APPLICATION, 2024–2029 (USD MILLION)
  • TABLE 155 REST OF SOUTH AMERICA: SMART FOOD PACKAGING MARKET, BY APPLICATION, 2019–2023 (USD MILLION)
  • TABLE 156 REST OF SOUTH AMERICA: SMART FOOD PACKAGING MARKET, BY APPLICATION, 2024–2029 (USD MILLION)
  • TABLE 157 REST OF THE WORLD: SMART FOOD PACKAGING MARKET, BY REGION, 2019–2023 (USD MILLION)
  • TABLE 158 REST OF THE WORLD: SMART FOOD PACKAGING MARKET, BY REGION, 2024–2029 (USD MILLION)
  • TABLE 159 REST OF THE WORLD: SMART FOOD PACKAGING MARKET, BY PACKAGING TYPE, 2019–2023 (USD MILLION)
  • TABLE 160 REST OF THE WORLD: SMART FOOD PACKAGING MARKET, BY PACKAGING TYPE, 2024–2029 (USD MILLION)
  • TABLE 161 REST OF THE WORLD: SMART FOOD PACKAGING MARKET, BY APPLICATION, 2019–2023 (USD MILLION)
  • TABLE 162 REST OF THE WORLD: SMART FOOD PACKAGING MARKET, BY APPLICATION, 2024–2029 (USD MILLION)
  • TABLE 163 REST OF THE WORLD: SMART FOOD PACKAGING MARKET, BY MATERIAL, 2019–2023 (USD MILLION)
  • TABLE 164 REST OF THE WORLD: SMART FOOD PACKAGING MARKET, BY MATERIAL, 2024–2029 (USD MILLION)
  • TABLE 165 REST OF THE WORLD: SMART FOOD PACKAGING MARKET, BY FUNCTIONALITY, 2019–2023 (USD MILLION)
  • TABLE 166 REST OF THE WORLD: SMART FOOD PACKAGING MARKET, BY FUNCTIONALITY, 2024–2029 (USD MILLION)
  • TABLE 167 MIDDLE EAST: SMART FOOD PACKAGING MARKET, BY APPLICATION, 2019–2023 (USD MILLION)
  • TABLE 168 MIDDLE EAST: SMART FOOD PACKAGING MARKET, BY APPLICATION, 2024–2029 (USD MILLION)
  • TABLE 169 AFRICA: SMART FOOD PACKAGING MARKET, BY APPLICATION, 2019–2023 (USD MILLION)
  • TABLE 170 AFRICA: SMART FOOD PACKAGING MARKET, BY APPLICATION, 2024–2029 (USD MILLION)
  • TABLE 171 OVERVIEW OF STRATEGIES ADOPTED BY KEY PLAYERS IN SMART FOOD PACKAGING MARKET
  • TABLE 172 SMART FOOD PACKAGING MARKET: DEGREE OF COMPETITION
  • TABLE 173 SMART FOOD PACKAGING MARKET: REGIONAL FOOTPRINT
  • TABLE 174 SMART FOOD PACKAGING MARKET: TYPE FOOTPRINT
  • TABLE 175 SMART FOOD PACKAGING MARKET: APPLICATION FOOTPRINT
  • TABLE 176 SMART FOOD PACKAGING MARKET: KEY START-UPS/SMES
  • TABLE 177 SMART FOOD PACKAGING MARKET: COMPETITIVE BENCHMARKING OF KEY START-UPS/SMES, 2023
  • TABLE 178 SMART FOOD PACKAGING MARKET: PRODUCT LAUNCHES AND ENHANCEMENTS, JANUARY 2020–AUGUST 2024
  • TABLE 179 SMART FOOD PACKAGING MARKET: DEALS, JANUARY 2020–OCTOBER 2024
  • TABLE 180 SMART FOOD PACKAGING MARKET: EXPANSIONS, MARCH 2020–NOVEMBER 2024
  • TABLE 181 AMCOR PLC: COMPANY OVERVIEW
  • TABLE 182 AMCOR PLC: PRODUCTS/SOLUTIONS/SERVICES OFFERED
  • TABLE 183 AMCOR PLC: PRODUCT LAUNCHES
  • TABLE 184 AMCOR PLC: EXPANSIONS
  • TABLE 185 AMCOR PLC: DEALS
  • TABLE 186 AMCOR PLC: OTHER DEALS/DEVELOPMENTS
  • TABLE 187 SEALED AIR: COMPANY OVERVIEW
  • TABLE 188 SEALED AIR: PRODUCTS/SOLUTIONS/SERVICES OFFERED
  • TABLE 189 SEALED AIR: PRODUCT LAUNCHES
  • TABLE 190 SEALED AIR: EXPANSIONS
  • TABLE 191 SEALED AIR: DEALS
  • TABLE 192 BERRY GLOBAL INC.: COMPANY OVERVIEW
  • TABLE 193 BERRY GLOBAL INC.: PRODUCTS/SOLUTIONS/SERVICES OFFERED
  • TABLE 194 BERRY GLOBAL INC.: EXPANSIONS
  • TABLE 195 BERRY GLOBAL INC.: DEALS
  • TABLE 196 THE TETRA LAVAL GROUP: COMPANY OVERVIEW
  • TABLE 197 THE TETRA LAVAL GROUP: PRODUCTS/SOLUTIONS/SERVICES OFFERED
  • TABLE 198 THE TETRA LAVAL GROUP: DEALS
  • TABLE 199 MONDI: COMPANY OVERVIEW
  • TABLE 200 MONDI: PRODUCTS/SOLUTIONS/SERVICES OFFERED
  • TABLE 201 MONDI: EXPANSIONS
  • TABLE 202 MONDI: DEALS
  • TABLE 203 TOYO SEIKAN GROUP HOLDINGS, LTD.: COMPANY OVERVIEW
  • TABLE 204 TOYO SEIKAN GROUP HOLDINGS, LTD.: PRODUCTS/SOLUTIONS/SERVICES OFFERED
  • TABLE 205 CROWN: COMPANY OVERVIEW
  • TABLE 206 CROWN: PRODUCTS/SOLUTIONS/SERVICES OFFERED
  • TABLE 207 3M: COMPANY OVERVIEW
  • TABLE 208 3M: PRODUCTS/SOLUTIONS/SERVICES OFFERED
  • TABLE 209 MITSUBISHI GAS CHEMICAL COMPANY, INC.: COMPANY OVERVIEW
  • TABLE 210 MITSUBISHI GAS CHEMICAL COMPANY, INC.: PRODUCTS/SOLUTIONS/SERVICES OFFERED
  • TABLE 211 MITSUBISHI GAS CHEMICAL COMPANY, INC.: PRODUCT LAUNCHES
  • TABLE 212 MULTISORB: COMPANY OVERVIEW
  • TABLE 213 MULTISORB: PRODUCTS/SOLUTIONS/SERVICES OFFERED
  • TABLE 214 HUHTAMÄKI OYJ: COMPANY OVERVIEW
  • TABLE 215 HUHTAMÄKI OYJ: PRODUCTS/SOLUTIONS/SERVICES OFFERED
  • TABLE 216 HUHTAMÄKI OYJ: PRODUCT LAUNCHES
  • TABLE 217 STEPAC: COMPANY OVERVIEW
  • TABLE 218 STEPAC: PRODUCTS/SOLUTIONS/SERVICES OFFERED
  • TABLE 219 STEPAC: PRODUCT LAUNCHES
  • TABLE 220 STEPAC: DEALS
  • TABLE 221 CHECKPOINT SYSTEMS, INC.: COMPANY OVERVIEW
  • TABLE 222 CHECKPOINT SYSTEMS, INC.: PRODUCTS/SOLUTIONS/SERVICES OFFERED
  • TABLE 223 CHECKPOINT SYSTEMS, INC.: DEALS
  • TABLE 224 NOVIPAX BUYER, LLC: COMPANY OVERVIEW
  • TABLE 225 NOVIPAX BUYER, LLC: PRODUCTS/SOLUTIONS/SERVICES OFFERED
  • TABLE 226 NOVIPAX BUYER, LLC: PRODUCT LAUNCHES
  • TABLE 227 NOVIPAX BUYER, LLC: EXPANSIONS
  • TABLE 228 TIMESTRIP UK LTD: COMPANY OVERVIEW
  • TABLE 229 TIMESTRIP UK LTD: PRODUCTS/SOLUTIONS/SERVICES OFFERED
  • TABLE 230 TIMESTRIP UK LTD: PRODUCT LAUNCHES
  • TABLE 231 TIMESTRIP UK LTD: DEALS
  • TABLE 232 INSIGNIA TECHNOLOGIES LTD.: COMPANY OVERVIEW
  • TABLE 233 INSIGNIA TECHNOLOGIES LTD.: PRODUCTS/SOLUTIONS/SERVICES OFFERED
  • TABLE 234 INSIGNIA TECHNOLOGIES LTD.: PRODUCT LAUNCHES
  • TABLE 235 VARCODE: COMPANY OVERVIEW
  • TABLE 236 VARCODE: PRODUCTS/SOLUTIONS/SERVICES OFFERED
  • TABLE 237 VARCODE: DEALS
  • TABLE 238 TIPA LTD: COMPANY OVERVIEW
  • TABLE 239 TIPA LTD: PRODUCTS/SOLUTIONS/SERVICES OFFERED
  • TABLE 240 TIPA LTD: PRODUCT LAUNCHES
  • TABLE 241 TIPA LTD: DEALS
  • TABLE 242 FLEXIBLE PACKAGING SOLUTIONS: COMPANY OVERVIEW
  • TABLE 243 FLEXIBLE PACKAGING SOLUTIONS: PRODUCTS/SOLUTIONS/SERVICES OFFERED
  • TABLE 244 FLEXIBLE PACKAGING SOLUTIONS: EXPANSIONS
  • TABLE 245 NOTPLA: COMPANY OVERVIEW
  • TABLE 246 NOTPLA: PRODUCTS/SOLUTIONS/SERVICES OFFERED
  • TABLE 247 ADJACENT MARKETS
  • TABLE 248 FOOD PACKAGING FILMS MARKET, BY TYPE, 2020–2027 (USD MILLION)
  • TABLE 249 FOOD PACKAGING FILMS MARKET, BY TYPE, 2020–2027 (KILOTONS)
  • TABLE 250 FOOD & BEVERAGE METAL CANS MARKET, BY FABRICATION TYPE, 2020–2023 (USD BILLION)
  • TABLE 251 FOOD & BEVERAGE METAL CANS MARKET, BY FABRICATION TYPE, 2024–2029 (USD BILLION)
LIST OF FIGURES
 
  • FIGURE 1 MARKET SEGMENTATION
  • FIGURE 2 SMART FOOD PACKAGING MARKET: RESEARCH DESIGN
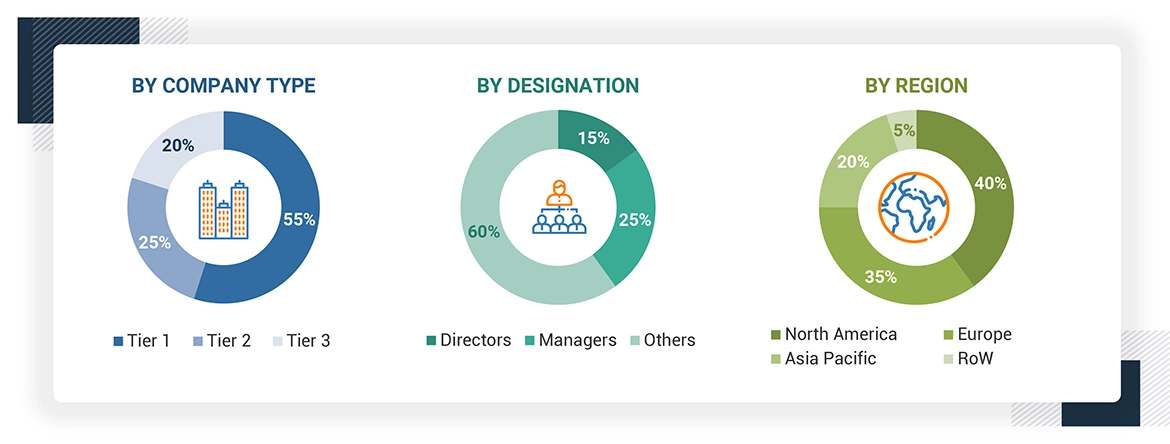
  • FIGURE 3 BREAKDOWN OF PRIMARY INTERVIEWS: BY COMPANY TYPE, DESIGNATION, AND REGION
  • FIGURE 4 MARKET SIZE ESTIMATION METHODOLOGY: APPROACH 1 (SUPPLY SIDE)—COLLECTIVE SHARE OF KEY PLAYERS
  • FIGURE 5 MARKET SIZE ESTIMATION METHODOLOGY: APPROACH 2 (SUPPLY SIDE)—COLLECTIVE REVENUE OF ALL PRODUCTS
  • FIGURE 6 MARKET SIZE ESTIMATION METHODOLOGY: APPROACH 3 (DEMAND SIDE)—PRODUCTS SOLD
  • FIGURE 7 MARKET SIZE ESTIMATION METHODOLOGY: APPROACH 4–TOP-DOWN APPROACH
  • FIGURE 8 DATA TRIANGULATION METHODOLOGY
  • FIGURE 9 SMART FOOD PACKAGING MARKET, BY PACKAGING TYPE, 2024 VS. 2029 (USD MILLION)
  • FIGURE 10 SMART FOOD PACKAGING MARKET, BY MATERIAL, 2024 VS. 2029 (USD MILLION)
  • FIGURE 11 SMART FOOD PACKAGING MARKET, BY FUNCTIONALITY, 2024 VS. 2029 (USD MILLION)
  • FIGURE 12 SMART FOOD PACKAGING MARKET, BY APPLICATION, 2024 VS. 2029 (USD MILLION)
  • FIGURE 13 SMART FOOD PACKAGING MARKET SHARE, BY REGION, 2024
  • FIGURE 14 INCREASE IN DEMAND FOR ENHANCED FOOD SAFETY, EXTENDED SHELF LIFE, AND SUSTAINABLE PACKAGING SOLUTIONS
  • FIGURE 15 US AND ACTIVE PACKAGING TO ACCOUNT FOR LARGEST SHARES IN 2024
  • FIGURE 16 US TO ACCOUNT FOR LARGEST SHARE IN 2024
  • FIGURE 17 PLASTIC PACKAGING MATERIAL TO DOMINATE SMART FOOD PACKAGING MARKET DURING FORECAST PERIOD
  • FIGURE 18 BARRIER PROTECTION TO DOMINATE SMART FOOD PACKAGING MARKET DURING FORECAST PERIOD
  • FIGURE 19 PROCESSED FOOD PRODUCTS TO LEAD MARKET DURING FORECAST PERIOD
  • FIGURE 20 MARKET DYNAMICS: SMART FOOD PACKAGING MARKET
  • FIGURE 21 VALUE CHAIN ANALYSIS OF SMART FOOD PACKAGING MARKET
  • FIGURE 22 SUPPLY CHAIN ANALYSIS OF SMART FOOD PACKAGING MARKET
  • FIGURE 23 REVENUE SHIFT FOR SMART FOOD PACKAGING MARKET
  • FIGURE 24 SMART FOOD PACKAGING: MARKET MAP
  • FIGURE 25 SMART FOOD PACKAGING MARKET: PORTER’S FIVE FORCES ANALYSIS
  • FIGURE 26 NUMBER OF PATENTS GRANTED BETWEEN 2014 AND 2024
  • FIGURE 27 INFLUENCE OF STAKEHOLDERS ON BUYING PROCESS IN SMART FOOD PACKAGING TYPES
  • FIGURE 28 KEY BUYING CRITERIA FOR TOP THREE APPLICATION INDUSTRIES OF SMART FOOD PACKAGING
  • FIGURE 29 SMART FOOD PACKAGING MARKET, BY APPLICATION, 2024 VS. 2029 (USD MILLION)
  • FIGURE 30 SMART FOOD PACKAGING MARKET, BY FUNCTIONALITY, 2024 VS. 2029 (USD MILLION)
  • FIGURE 31 SMART FOOD PACKAGING MARKET, BY MATERIAL, 2024 VS. 2029 (USD MILLION)
  • FIGURE 32 SMART FOOD PACKAGING MARKET, BY PACKAGING TYPE, 2024 VS. 2029 (USD MILLION)
  • FIGURE 33 JAPAN TO BE FASTEST-GROWING MARKET IN SMART FOOD PACKAGING DURING FORECAST PERIOD
  • FIGURE 34 NORTH AMERICA: SMART FOOD PACKAGING MARKET SNAPSHOT
  • FIGURE 35 ASIA PACIFIC: SMART FOOD PACKAGING MARKET SNAPSHOT
  • FIGURE 36 TOP FIVE PLAYERS DOMINATE MARKET, 2021–2023 (USD BILLION)
  • FIGURE 37 RANKING OF TOP FIVE PLAYERS IN SMART FOOD PACKAGING MARKET, 2023
  • FIGURE 38 SMART FOOD PACKAGING MARKET: COMPANY EVALUATION MATRIX (KEY PLAYERS), 2023
  • FIGURE 39 SMART FOOD PACKAGING MARKET: COMPANY FOOTPRINT
  • FIGURE 40 SMART FOOD PACKAGING MARKET: COMPANY EVALUATION MATRIX (START-UPS/SMES), 2023
  • FIGURE 41 COMPANY VALUATION OF FEW MAJOR PLAYERS (USD BILLION)
  • FIGURE 42 EV/EBITDA OF KEY COMPANIES
  • FIGURE 43 BRAND/PRODUCT COMPARISON
  • FIGURE 44 AMCOR PLC: COMPANY SNAPSHOT
  • FIGURE 45 SEALED AIR: COMPANY SNAPSHOT
  • FIGURE 46 BERRY GLOBAL INC.: COMPANY SNAPSHOT
  • FIGURE 47 THE TETRA LAVAL GROUP: COMPANY SNAPSHOT
  • FIGURE 48 MONDI: COMPANY SNAPSHOT
  • FIGURE 49 TOYO SEIKAN GROUP HOLDINGS, LTD.: COMPANY SNAPSHOT
  • FIGURE 50 CROWN: COMPANY SNAPSHOT
  • FIGURE 51 3M: COMPANY SNAPSHOT
  • FIGURE 52 MITSUBISHI GAS CHEMICAL COMPANY, INC.: COMPANY SNAPSHOT
  • FIGURE 53 HUHTAMÄKI OYJ: COMPANY SNAPSHOT

This research study involved the extensive use of secondary sources—directories and databases such as Bloomberg Businessweek and Factiva—to identify and collect information useful for a technical, market-oriented, and commercial study of the smart food packaging market. In-depth interviews were conducted with various primary respondents—such as key industry participants, subject matter experts (SMEs), C-level executives of key market players, and industry consultants—to obtain and verify critical qualitative and quantitative information as well as to assess prospects.

Secondary Research

Secondary research for the smart food packaging market involved sourcing data from various reputable organizations and industry bodies to gather critical insights. Key sources included food safety authorities, packaging associations, and technology research institutions. Secondary research for the smart food packaging market relied on gathering data from several reputable industry and regulatory organizations. Key sources included the Food Packaging Forum, the Flexible Packaging Association (FPA), and the Institute of Packaging Professionals (IoPP) to understand packaging innovations, sustainability trends, and safety standards. Additional data were collected from market reports, white papers, and certified publications focusing on active and intelligent packaging technologies, sustainability trends, and consumer behavior. Industry journals, press releases, and investor presentations from major market players helped track product developments and competitive strategies. Paid databases and trade directories were also consulted to gather statistical data on market segmentation, key growth regions, and emerging technologies. This research provided a comprehensive understanding of the current market landscape and future trends shaping the smart food packaging industry.

Primary Research

The primary research for the smart food packaging market involved engaging key stakeholders across the supply chain to gather both qualitative and quantitative insights. This included raw material suppliers, equipment manufacturers, and smart packaging technology providers. On the supply side, interviews were conducted with smart food packaging manufacturers and technology developers, while on the demand side, primary sources included distributors, retailers, food producers, and end consumers. The objective was to understand the market dynamics, challenges, and opportunities driving adoption, as well as the future outlook for smart packaging technologies in the food industry.
Smart Food Packaging Market Size, and Share

To know about the assumptions considered for the study, download the pdf brochure

Market Size Estimation

Both the top-down and bottom-up approaches have been used to estimate and validate the total size of the smart food packaging market. These approaches were extensively to determine the size of the subsegments in the market. The research methodology used to estimate the market size includes the following details:

Smart Food Packaging Market : Top-Down and Bottom-Up Approach

Smart Food Packaging Market Top Down and Bottom Up Approach

Data Triangulation

After arriving at the overall market size from the estimation process explained above, the total market was split into several segments and subsegments. The data triangulation and market breakdown procedures were employed, wherever applicable, to estimate the overall smart food packaging market and arrive at the exact statistics for all segments and subsegments. The data was triangulated by studying various factors and trends from the demand and supply sides. Along with this, the market size was validated using both the top-down and bottom-up approaches

Stakeholders

  • Raw Material Suppliers
  • Food Packaging Manufacturers
  • Food and Beverage Companies
  • Retailers and Distributors

Report Objectives

MARKET INTELLIGENCE

  • To determine and project the size of the smart food packaging market with respect to the packaging type, application, functionality, material and region, over five years, ranging from 2024 to 2029.
  • To identify the attractive opportunities in the market by determining the largest and fastest-growing segments across the key regions
  • To analyze the demand-side factors based on the following:
    • Impact of macro-and micro-economic factors on the market
    • Shifts in demand patterns across different subsegments and regions.

COMPETITIVE INTELLIGENCE

  • To identify and profile the key market players in the smart food packaging market.
  • To determine the market share of key players operating in the smart food packaging market
  • To provide a comparative analysis of the market leaders based on the following:
    • Product offerings
    • Business strategies
    • Strengths and weaknesses
    • Key financials
  • To understand the competitive landscape and identify the major growth strategies adopted by players across the key regions.

Available Customizations

With the given market data, MarketsandMarkets offers customizations according to company-specific scientific needs.

The following customization options are available for the report:

Product Analysis

  • Product Matrix, which gives a detailed comparison of the product portfolio of each company

Geographic Analysis as per Feasibility

  • Further breakdown of the Rest of Europe market for smart food packaging into the Czech Republic, The Netherlands, Belgium, Hungary, Romania, and Ireland
  • Further breakdown of the Rest of South America market for smart food packaging into Chile, Colombia, Paraguay, and Peru
  • Further breakdown of other countries in the RoW market for smart food packaging into the Middle East & Africa

Company Information

  • Detailed analyses and profiling of additional market players (up to five)

Previous Versions of this Report

"Our USP is "providing game-changing business opportunities reports with free customization" - so please feel free to provide us with your specific areas of interest / business challenges in much greater detail !!"

We appreciate your interest in this report. Once you fill out the form, you'll be immediately directed to an exclusive solution tailored to your needs. This high-value offering can help boost your revenue by 30% - a must-see opportunity for anyone looking to maximize growth.


By clicking the "Submit" button, you are agreeing to the Terms of Use and Privacy Policy.

Custom Market Research Services

We Will Customise The Research For You, In Case The Report Listed Above Does Not Meet With Your Requirements

Get 10% Free Customisation

Growth opportunities and latent adjacency in Smart Food Packaging Market

DMCA.com Protection Status