Enterprise Session Border Controller Market by Session Capacity (Up to 200, Up To 600, Up to 1000, Up to 5000, More Than 5000), Function, Enterprise Level (Small, Medium, Large), Industry, and Geography - Global Forecast to 2022


[146 Pages Report] The enterprise session border controller market was valued at USD 310.1 Million in 2015 and is expected to reach USD 528.4 Million by 2022, at a CAGR of 8.26% between 2016 and 2022. The transition of the enterprises to VoIP networks creates a challenge to safeguard the infrastructure and communications of the company in line with the traditional networks. The enterprises also have to maintain the quality of service of the communications while limiting the expenditures on them. The enterprise session border controllers are specifically designed to overcome the challenge of interoperability, complex security, and service quality in the implementation of VoIP, UC, and mobility initiatives. For the study, the base year considered is 2015, and the market forecast provided is between 2016 and 2022.
The prime objectives of this report can be summarized in the following points.
- To define, describe, and forecast the market on the basis of session capacity, function, enterprise level, industry, and geography
- To forecast and segment the market based on different regions such as the Americas, Europe, APAC and RoW
- To identify and analyze the market dynamics, such as drivers, restraints, opportunities, industry-specific challenges, in the enterprise session border controller market
- To use the Porter’s five forces model to gauge the entry barriers to the market, and provide the value chain analysis and market roadmaps to study the evolution of the market
- To analyze the opportunities in the market for stakeholders and detail the competitive landscape of the market leaders
- To strategically profile the key players operating in the market and comprehensively analyze their market shares and core competencies
The enterprise session border controller market was valued at USD 310.1 Million in 2015 and is expected to reach USD 528.4 Million by 2022, at a CAGR of 8.26% between 2016 and 2022. The major factors that would drive the market for enterprise session border controllers are the increasing concern for security and upgradation of network infrastructure across the globe. The ability of session border controllers to provide secure communications at lower cost has resulted in their growing adoption in the manufacturing and IT industry, state-owned enterprises, and others. Untapped or less explored markets hold tremendous possibilities in terms of market growth opportunities.
The enterprise session border controller market has been segmented on the basis of by session capacity into up to 200 sessions, up to 600 sessions, up to 1000 sessions, up to 5000 sessions, and greater than 5,000 sessions. The market for enterprise session border controllers with session capacity up to 200 held the largest market size in 2015. Though the penetration of the session border controller is very low in small- to medium-sized organizations, the growing trend of unified communication would further drive the market for session border controllers.
The market has been segmented on the basis of enterprise level into three types: small-scale enterprises, medium-scale enterprises, and large-scale enterprises. The market for the small-scale enterprise level is expected to grow at the highest CAGR between 2016 and 2022. The U.S. is witnessing increasing adoption of SBCs by various small-scale enterprises. Small-scale enterprises largely rely on traditional telecommunication systems and have been slow to adopt VoIP combined with session border controllers. As the service providers discontinue providing the traditional network services and shift to IP networks, a large pool of small-scale enterprises would shift to VoIP for their telephony needs.
The market has been segmented on the basis of functions into security, connectivity, revenue optimization, quality of service, regulatory, media and entertainment, and others. Other functions include maintaining high availability, statistics and billing, and management of the network in the enterprise.
The enterprise session border controller market is further segmented on the basis of industries into IT and telecommunication, banking and financial services, manufacturing, healthcare, media and entertainment, transportation, and others. The growth of the E-SBC market is mainly driven by the IT and telecommunication, banking and financial services, and manufacturing industries. The growth of the market for the banking and financial industry is largely attributed to the growing financial services sector and reforms in the economy and banking services worldwide as well as the need to secure the networks in the same.
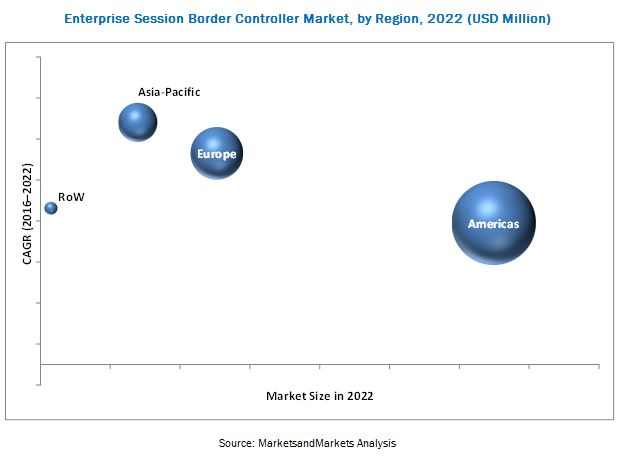
The enterprise session border controller market has been segmented on the basis of geography into the Americas, Europe, APAC, and RoW. The Americas would hold the largest share of the total market in 2016. The region has been an early adopter of session border controllers, which has boosted the demand for enterprise session border controller systems in this region. Major service providers across the globe, such as AT&T, Inc. (U.S.), Verizon (U.S.), British Telecommunications plc (U.K.), Deutsche Telekom AG (Germany), Orange S.A. (France), NTT (Japan), and Telstra Corporation Limited (Australia), plan to shift from the PSTN networks to IP-based networks in the next five to ten years. This would propel the growth of the market for session border controllers to secure and improve the quality of the new VoIP networks.
The key players in the enterprise session border controller market are AudioCodes Ltd. (Israel), ADTRAN, Inc. (U.S.), Avaya Inc. (U.S.), Cisco Systems, Inc. (U.S.), Edgewater Networks, Inc. (U.S.), GENBAND, Inc. (U.S.), Ingate Systems AB (Sweden), Oracle Corporation (U.S.), Patton Electronics Co. (U.S.), and Sonus Networks, Inc. (U.S.).
To speak to our analyst for a discussion on the above findings, click Speak to Analyst
 Exclusive indicates content/data unique to MarketsandMarkets and not available with any competitors.
Table of Contents
1 Introduction (Page No. - 13)
1.1 Study Objectives
1.2 Market Definition
1.3 Study Scope
1.3.1 Markets Covered
1.3.2 Geographic Scope
1.3.3 Years Considered for the Study
1.4 Currency
1.5 Limitations
1.6 Market Stakeholders
2 Research Methodology (Page No. - 18)
2.1 Research Data
2.2 Secondary Data
2.2.1 List of Major Secondary Sources
2.2.2 Key Data From Secondary Sources
2.3 Primary Data
2.3.1 Primary Interviews With Experts
2.3.2 Breakdown of Primaries
2.3.3 Key Data From Primary Sources
2.3.4 Secondary and Primary Research
2.3.5 Key Industry Insights
2.4 Market Size Estimation
2.4.1 Bottom-Up Approach
2.4.1.1 Approach for Capturing the Market Share By Bottom-Up Analysis (Demand Side)
2.4.2 Top-Down Approach
2.4.2.1 Approach for Capturing the Market Share By Top-Down Analysis (Supply Side)
2.5 Market Breakdown and Data Triangulation
2.6 Research Assumptions
3 Executive Summary (Page No. - 29)
4 Premium Insights (Page No. - 34)
4.1 Attractive Market Opportunities in the Global Market
4.2 Enterprise Session Border Controller, By Function
4.3 Enterprise Session Border Controller in the Americas, By Function and Industry
4.4 Country-Wise Analysis of the Market
4.5 Market Size, By Enterprise Level
5 Market Overview (Page No. - 38)
5.1 Introduction
5.2 Market Segmentation
5.2.1 By Session Capacity
5.2.2 By Enterprise Level
5.2.3 By Function
5.2.4 By Industry
5.2.5 By Geography
5.3 Market Dynamics
5.3.1 Drivers
5.3.1.1 Increasing Security Concerns
5.3.1.2 Upgradation of Network Infrastructure
5.3.2 Restraints
5.3.2.1 Lack of Awareness in Various Geographies
5.3.3 Opportunities
5.3.3.1 Growing Demand From Various Industries
5.3.3.2 Increasing Demand From Small- and Medium-Sized Businesses
5.3.4 Challenges
5.3.4.1 Difficulty of Replacing Traditional Telephone Networks
6 Industry Trends (Page No. - 45)
6.1 Introduction
6.2 Value Chain Analysis
6.3 Porter’s Five Forces Analysis
6.3.1 Threat of New Entrants
6.3.2 Threat of Substitutes
6.3.3 Bargaining Power of Suppliers
6.3.4 Bargaining Power of Buyers
6.3.5 Intensity of Competitive Rivalry
7 Market, By Session Capacity (Page No. - 54)
7.1 Introduction
7.2 Up to 200 Sessions
7.3 Up to 600 Sessions
7.4 Up to 1000 Sessions
7.5 Up to 5,000 Sessions
7.6 More Than 5,000 Sessions
8 Market, By Function (Page No. - 60)
8.1 Introduction
8.2 Security
8.3 Connectivity
8.4 Quality of Service
8.5 Regulatory
8.6 Media Services
8.7 Revenue Optimization
8.8 Others
9 Market, By Enterprise Level (Page No. - 70)
9.1 Introduction
9.2 Small-Scale Enterprises
9.3 Medium-Scale Enterprises
9.4 Large-Scale Enterprises
10 Market, By Industry (Page No. - 78)
10.1 Introduction
10.2 Manufacturing
10.3 Banking and Financial Services
10.4 Transportation
10.5 Healthcare
10.6 Media and Entertainment
10.7 IT and Telecommunication
10.8 Other Industries
11 Geographic Analysis (Page No. - 87)
11.1 Introduction
11.2 Americas
11.2.1 North America
11.2.1.1 U.S.
11.2.1.2 Canada
11.2.1.3 Mexico
11.2.2 South America
11.3 Europe
11.3.1 Germany
11.3.2 U.K.
11.3.3 France
11.3.4 Italy
11.3.5 Rest of Europe
11.4 APAC
11.4.1 China
11.4.2 Australia
11.4.3 Japan
11.4.4 Singapore
11.4.5 South Korea
11.4.6 Rest of APAC
11.5 RoW
11.5.1 Middle East
11.5.2 Africa
12 Competitive Landscape (Page No. - 109)
12.1 Overview
12.2 Market Ranking Analysis
12.3 Competitive Scenario
12.3.1 New Product Launches
12.3.2 Partnerships/Agreements
12.3.3 Acquisitions/Collaborations
13 Company Profiles (Page No. - 114)
13.1 Introduction
(Business Overview, Products & Services, Key Insights, Recent Developments, SWOT Analysis, Ratio Analysis, MnM View)*
13.2 Audiocodes Ltd...
13.3 Sonus Networks, Inc.
13.4 Oracle Corporation
13.5 Cisco Systems, Inc.
13.6 Edgewater Networks Inc.
13.7 Avaya Inc.
13.8 Adtran, Inc.
13.9 Patton Electronics Co.
13.10 Ingate Systems AB
13.11 Genband, Inc.
*Details on Business Overview, Products & Services, Key Insights, Recent Developments, SWOT Analysis, MnM View Might Not Be Captured in Case of Unlisted Companies.
14 Appendix (Page No. - 136)
14.1 Insights of Industry Experts
14.2 Discussion Guide
14.3 Knowledge Store: Marketsandmarkets’ Subscription Portal
14.4 Introducing RT: Real-Time Market Intelligence
14.5 Available Customizations
14.6 Related Reports
14.7 Author Details
List of Tables (66 Tables)
Table 1 Porter’s Five Forces Analysis With Their Weightage Impact
Table 2 Market, By Session Capacity, 2014–2022 (USD Million)
Table 3 Market for Session Capacity Up to 200, By Region, 2014–2022 (USD Million)
Table 4 Market for Session Capacity Up to 600, By Region, 2014–2022 (USD Million)
Table 5 Market for Session Capacity Up to 1000, By Region, 2014–2022 (USD Million)
Table 6 Market for Session Capacity Up to 5,000, By Region, 2014–2022 (USD Million)
Table 7 Market for Session Capacity More Than 5,000, By Region, 2014–2022 (USD Million)
Table 8 Market, By Function, 2014–2022 (USD Million)
Table 9 Market for Security, By Enterprise Level, 2014–2022 (USD Million)
Table 10 Market for Security, By Region, 2014–2022 (USD Million)
Table 11 Market for Connectivity, By Enterprise Level, 2014–2022 (USD Million)
Table 12 Market for Connectivity, By Region, 2014–2022 (USD Million)
Table 13 Market for Quality of Service, By Enterprise Level, 2014–2022 (USD Million)
Table 14 Enterprise Session Border Controller for Quality of Service, By Region, 2014–2022 (USD Million)
Table 15 Enterprise Session Border Controller for Regulatory, By Region, 2014–2022 (USD Million)
Table 16 Market for Regulatory, By Enterprise Level, 2014–2022 (USD Million)
Table 17 Enterprise Session Border Controller for Media Services, By Region, 2014–2022 (USD Million)
Table 18 Market for Media Services, By Enterprise Level, 2014–2022 (USD Million)
Table 19 Enterprise Session Border Controller for Revenue Optimization, By Enterprise Level, 2014–2022 (USD Million)
Table 20 Market for Revenue Optimization, By Region, 2014–2022 (USD Million)
Table 21 Enterprise Session Border Controller for Other Functions, By Enterprise Level, 2014–2022 (USD Million)
Table 22 Market for Other Functions, By Region, 2014–2022 (USD Million)
Table 23 Market, By Enterprise Level, 2014–2022 (USD Million)
Table 24 Market for Small-Scale Enterprises, By Session Capacity, 2014–2022 (USD Million)
Table 25 Market for Small-Scale Enterprises, By Region, 2014–2022 (USD Million)
Table 26 Market for Small-Scale Enterprises, By Function, 2014–2022 (USD Million)
Table 27 Enterprise Session Border Controller for Medium-Scale Enterprises, By Session Capacity, 2014–2022 (USD Million)
Table 28 Market for Medium-Scale Enterprises, By Region, 2014–2022 (USD Million)
Table 29 Market for Medium-Scale Enterprises, By Function, 2014–2022 (USD Million)
Table 30 Enterprise Session Border Controller for Large-Scale Enterprises, By Session Capacity, 2014–2022 (USD Million)
Table 31 Market for Large-Scale Enterprises, By Region, 2014–2022 (USD Million)
Table 32 Market for Large-Scale Enterprises, By Region, 2014–2022 (USD Million)
Table 33 Market, By Industry, 2014–2022 (USD Million)
Table 34 Market for Manufacturing, By Region, 2014–2022 (USD Million)
Table 35 Market for Banking and Financial Services, By Region, 2014–2022 (USD Million)
Table 36 Market for Transportation, By Region, 2014–2022 (USD Million)
Table 37 Market for Healthcare, By Region, 2014–2022 (USD Million)
Table 38 Market for Media and Entertainment, By Region, 2014–2022 (USD Million)
Table 39 Market for IT and Telecommunication, By Region, 2014–2022 (USD Million)
Table 40 Market for Other Industries, By Region, 2014–2022 (USD Million)
Table 41 Market, By Region, 2013–2022 (USD Million)
Table 42 Market in the Americas, By Region, 2014–2022 (USD Million)
Table 43 Market in North America, By Country, 2014–2022 (USD Million)
Table 44 Market in the Americas, By Session Capacity, 2014–2022 (USD Million)
Table 45 Market in the Americas, By Enterprise Level, 2014–2022 (USD Million)
Table 46 Market in the Americas, By Function, 2014–2022 (USD Million)
Table 47 Market in the Americas, By Industry, 2014–2022 (USD Million)
Table 48 Market in Europe, By Country, 2014–2022 (USD Million)
Table 49 Market in Europe, By Session Capacity, 2014–2022 (USD Million)
Table 50 Market in Europe, By Enterprise Level, 2014–2022 (USD Million)
Table 51 Market in Europe, By Function, 2014–2022 (USD Million)
Table 52 Market in Europe, By Industry, 2014–2022 (USD Million)
Table 53 Market in APAC, By Country, 2014–2022 (USD Million)
Table 54 Market in APAC, By Session Capacity, 2014–2022 (USD Million)
Table 55 Market in APAC, By Enterprise Level, USD Million, 2014–2022
Table 56 Market in APAC, By Function, 2014–2022 (USD Million)
Table 57 Market in APAC, By Industry, 2014–2022 (USD Million)
Table 58 Market in RoW, By Region, 2014–2022 (USD Million)
Table 59 Market in RoW, By Session Capacity, 2014–2022 (USD Million)
Table 60 Market in RoW, By Enterprise Level, 2014–2022 (USD Million)
Table 61 Market in RoW, By Function, 2014–2022 (USD Million)
Table 62 Market in RoW, By Industry, 2014–2022 (USD Million)
Table 63 Market Ranking of the Top Enterprise Session Border Controller Players in the Market, 2015
Table 64 Recent New Product Launches in the Market, 2015–2016
Table 65 Recent Partnerships/Agreements in the Enterprise Session Border Controller, 2015–2016
Table 66 Recent Acquisitions/Collaborations in the Market, 2015–2016
List of Figures (46 Figures)
Figure 1 Market: Research Design
Figure 2 Process Flow of Market Size Estimation
Figure 3 Market Size Estimation Methodology: Bottom-Up Approach
Figure 4 Market Size Estimation Methodology: Top-Down Approach
Figure 5 Data Triangulation
Figure 6 Security Function Expected to Hold the Largest Size of the Market Till 2022
Figure 7 Small Scale Enterprise and Session Capacity Up to 200 Sessions to Dominate the Market By 2022
Figure 8 Manufacturing and Healthcare Industries to Exhibit the Strongest Growth Potential During the Forecast Period
Figure 9 Market in APAC to Grow at the Highest Rate During the Forecast Period
Figure 10 Increasing Security Concerns, Growing Demand From Small- and Medium-Sized Businesses Expected to Boost the Demand for Enterprise Session Border Controller During the Forecast Period
Figure 11 Security and Connectivity to Dominate the Enterprise Session Border Controller During the Forecast Period
Figure 12 Market Expected to Be Driven By Security Function and IT and Telecommunication Industry in 2016
Figure 13 U.S. to Hold the Largest Share of the Enterprise Session Border Controller in 2016
Figure 14 Small-Scale Enterprises Expected to Witness the Highest Growth Rate During the Forecast Period
Figure 15 Major Parameters Impacting the Dynamics of the Market
Figure 16 Value Chain Analysis: Major Value Added By Device and Software Manufacturers
Figure 17 Porter’s Five Forces Analysis
Figure 18 Threat of New Entrants is Low Owing to Existence of Established Players and Requirement of Technical Capabilities
Figure 19 Presence of Established Players to Increase the Entry Barrier for New Entrants
Figure 20 Price of Substitutes and Switching Cost Result in Medium Threat of Substitutes
Figure 21 High Supplier Concentration Weakening the Bargaining Power of Suppliers
Figure 22 Availability of Substitutes is A Key Factor Supporting Buyers’ Bargaining Power
Figure 23 High Growth Rate Leading to A High Degree of Competition in the Market
Figure 24 Up to 200 Session Capacity to Dominate the Market for Enterprise Session Border Controller
Figure 25 Security Function to Dominate the Market During the Forecast Period
Figure 26 Small-Scale Enterprises to Surpass Large- and Medium-Scale Enterprises to Dominate the Market By 2022
Figure 27 Enterprise Session Border Controller, By Industry
Figure 28 China to Grow at the Highest Rate During the Forecast Period
Figure 29 Americas: Market Snapshot (2016)
Figure 30 Europe: Market Snapshot (2016)
Figure 31 APAC: Market Snapshot (2016)
Figure 32 RoW: Market Snapshot (2016)
Figure 33 Companies Adopted New Product Launches as the Key Growth Strategy Between January 2015 and December 2016
Figure 34 Enterprise Session Border Controller Market: Market Evaluation Framework
Figure 35 Companies Adopted New Product Launches as the Key Strategy to Increase Market Share
Figure 36 Audiocodes Ltd.: Company Snapshot
Figure 37 Audiocodes Ltd.: SWOT Analysis
Figure 38 Sonus Networks, Inc.: Company Snapshot
Figure 39 Sonus Networks, Inc.: SWOT Analysis
Figure 40 Oracle Corporation: Company Snapshot
Figure 41 Oracle Corporation: SWOT Analysis
Figure 42 Cisco Systems, Inc.: Company Snapshot
Figure 43 Cisco Systems, Inc.: SWOT Analysis
Figure 44 Edgewater Networks Inc.: SWOT Analysis
Figure 45 Avaya Inc.: Company Snapshot
Figure 46 Adtran, Inc.: Company Snapshot
The sizing of the market has been done by the top-down and bottom-up approaches. The bottom-up approach has been employed to arrive at the overall size of the enterprise session border controller market from the revenues of key players (companies) and their share in the market. Calculations based on the number of different enterprise session border controllers that are used in different enterprises and the demand from all major countries is further added, and finally the volume is multiplied by the average selling price of each enterprise session border controller product to arrive the overall market size. In the stop-down approach, the overall market size has been used to estimate the size of the individual markets (mentioned in the market segmentation), through percentage splits from secondary and primary researches. For the calculation of specific market segments, the most appropriate parent market size has been used to implement the top-down approach.
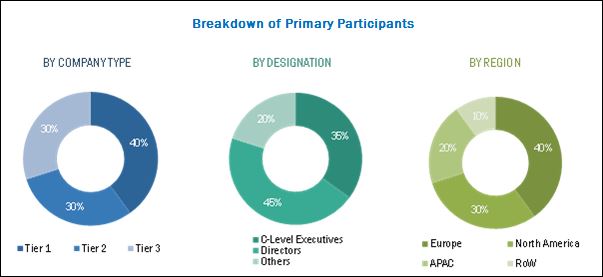
In the process of determining and verifying the market size for several segments and subsegments gathered through secondary research, extensive primary interviews have been conducted with key opinion leaders. The break-up of the profiles of primary participants is given in the chart below:
To know about the assumptions considered for the study, download the pdf brochure
The enterprise session border controller ecosystem comprises major players such as AudioCodes Ltd. (Israel), ADTRAN, Inc. (U.S.), Avaya Inc. (U.S.), Cisco Systems, Inc. (U.S.), Edgewater Networks, Inc. (U.S.), GENBAND, Inc. (U.S.), Ingate Systems AB (Sweden), Oracle Corporation (U.S.), Patton Electronics Co. (U.S.), and Sonus Networks, Inc. (U.S.).
All these companies have their own R&D facilities and extensive sales offices and distribution channels. The products of these companies can be used across various industries for respective applications. The report provides the competitive landscape of the key players, which indicates their growth strategies in the enterprise session border controller market.
Target Audience:
- Raw material suppliers
- Session border controller designers, manufacturers, and suppliers
- Session border controller equipment integrators, suppliers, and service providers
- Application software providers
- Government bodies such as regulating authorities and policy makers
- Session border controller and manufacturing-related associations, organizations, forums, and alliances
- Research institutes and organizations
- Market research and consulting firms
“The study answers several questions for the stakeholders, primarily which market segments to focus on in the next two to five years (depending on the range of the forecast period) for prioritizing the efforts and investments.”
Scope of the Report:
The market covered in this report has been segmented as follows:
By Session Capacity
- Up to 200
- Up to 600
- Up to 1000
- Up to 5,000
- more than 5,000
By Function
- Security
- Connectivity
- Quality Of Service
- Regulatory
- Media Services
- Revenue Optimization
- Others
By Enterprise level
- Small-Scale Enterprises
- Medium-Scale Enterprises
- Large-Scale Enterprises
By Industry
- Manufacturing
- Banking And Financial Services
- Transportation
- Healthcare
- Media And Entertainment
- IT And Telecommunication
- Other Industries
Geographic Analysis
Americas
-
North America
- U.S.
- Canada
- Mexico
- South America
Europe
- Germany
- U.K.
- France
- Italy
- Rest of Europe (Russia, Spain, Poland, The Netherlands, and Finland)
APAC
- China
- Australia
- Japan
- Singapore
- South Korea
- Rest of APAC (Malaysia, India, Philippines, and Thailand)
RoW
- Middle East
- Africa
Available Customizations:
- Detailed analysis and profiling of additional market players on the basis of various blocks of the value chain


Growth opportunities and latent adjacency in Enterprise Session Border Controller Market
Requesting you to send the sample brochure for the current market includes 1. Session Capacity, 2. Function and 3. List of companies