Flexible Display Market by Application (Smartphone, Smartwatch, Wearable, TV, Digital Signage, PC Monitor, E-reader, Electronic Shelf Label, and Automotive), Technology (OLED, Quantum Dots, LED, E-Paper), Panel Size, and Geography - Global Forecast to 2022


Updated date -
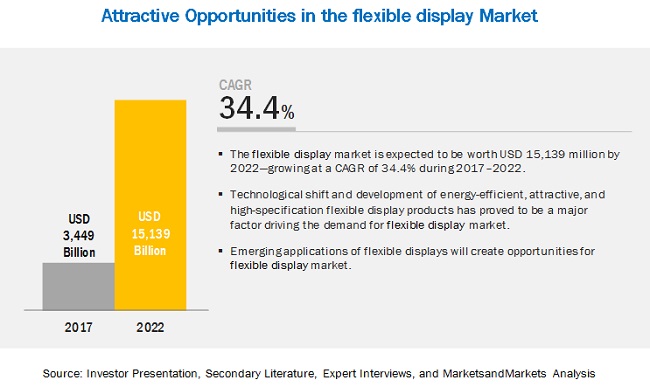
[171 Pages Report] MarketsandMarkets forecasts the flexible display market to grow from USD 3,449 billion in 2017 to USD 15,139 million by 2022, at a compound annual growth rate (CAGR) of 34.4% during the forecast period. The major factors that are expected to be driving the market are rising demand for OLED-based devices and high growth of consumer goods. The objective of the report is to define, describe, and forecast the flexible displays market size based on application, technology, panel size, substrate material and region.
Flexible Display Market By application, the vehicles and public transport segment is expected to grow at the highest growth rate during the forecast period
Vehicles such as cars and motorbikes, among many others, are the leading applications in the automotive domain. Displays utilized in cars range from small- to medium- and medium- to large-sized display panels. These displays can be used in dashboard displays, central control units, entertainment systems, navigation systems, security systems, and many other systems that help drivers in displaying the information. Public transport vehicles such as trains, planes, and ships also use panels for displaying the information for the advertising purpose. These display panels are usually large in size.
Flexible Display Market By technology, the LED-Backlit LCD segment holds the largest share of the market
The main display technology in the flexible display market is LED, or LED-backlit LCDs. LED-based display devices utilize LEDs for white backlighting the LCD panel. In conventional LCD devices, cold cathode fluorescent lamps (CCFLs) were used for backlighting; however, the display market has adopted LEDs for backlighting the LCD panel owing to its favorable features. Although cheap, CCFLs are not as energy-efficient as LEDs. Owing to the features offered and falling prices of LEDs, CCFL-backlit LCD TVs disappeared entirely.
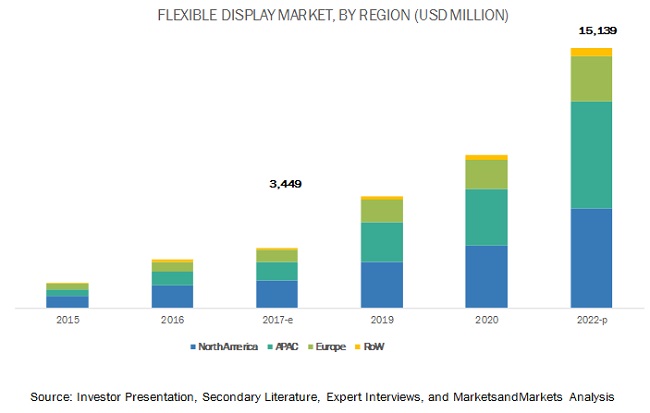
Flexible Display Market in North America to account for the largest market size during the forecast period.
The flexible display market in North America, being technologically advanced and developed, is a leading market for the cutting-edge technology used in flexible display devices.The region accounted for the largest share of the global market in 2016. The US dominated the North American market owing to its well-established economy, which allows for a large consumer electronics market. The rapid adoption of the latest display technologies and increasing applications are some of the reasons for the large market share of the US in the North American market. Leading e-reader brands, such as Kindle, were first available in the US, and hence North America plays an important role in the flexible display market.
Flexible Display Market Dynamics
Driver: Technological shift and development of energy-efficient, attractive, and high-specification flexible display products
The flexible display market has witnessed tremendous technological advancements in the past few years. Display devices have changed from being bulky and space-consuming to slim and bezel-less. They now offer high resolution, improved contrast ratio, and low power consumption compared with traditional display devices based on CRT technology. High competition in the display market has led to new product developments and launches with attractive looks and high-end specifications. Companies such as Samsung Electronics Co., Ltd. (South Korea) and LG Display Co., Ltd. (South Korea) have led the display market toward a new era with the launch of products based on technologies such as OLED and Q-dot LED. OLEDs offer a better viewing angle and an excellent contrast rate, and are brighter than LCDs. OLEDs also exhibit refresh rates, thereby facilitating a high-definition video. Attractive looks and high specifications of display products such as TVs, desktop monitors, notebooks, and mobile phones grab the attention of consumers. Display products based on the OLED technology have revolutionized the display market.
Restraint: Complex manufacturing process
The manufacturing process of flexible displays is complex, and it involves several stages. At present, the designing part of other competing display technologies is superior and involves less number of manufacturing stages. A major challenge with respect to the flexible display technology is to match the performance of the rigid display and electronics technology currently available in the market. Many organic materials used for flexible displays and electronics are susceptible to moisture and oxygen. Exposure to oxygen and moisture reduces the life of a material. Thus, they provide less protection. Additionally, these materials tend to operate at slow speeds and high voltages. They are also sensitive to extreme temperatures. As the technology and the market progress, companies would focus on these issues to gain a competitive edge.
Opportunity: High growth of smart wearable market
Many smart band manufacturers are looking forward to extending their product range by adding small devices with screens. Smart wearables utilize small display panels in applications such as watches and wristbands. The growing factor of smart wearables includes the new applications coming in the market such as augmented reality (AR) and virtual reality (VR), which provides new opportunities to suppliers of OLED displays. The growing market of smart wearables may act as an opportunity for large-sized display panel manufacturers such as Innolux Corp. (Taiwan) and AU Optronics Corp. (Taiwan). Companies may invest to focus on these applications, which will eventually increase their revenue.
Challenge: Fluctuations in ASPs of flexible display panels
Revenues of flexible display panel manufacturers primarily depend on the ASPs and shipment volumes of flexible display panels. This is affected by fluctuations in these prices and volumes. Prices and shipment volumes of flexible display panels are affected by numerous factors, such as raw material cost, yield rates, supply and demand, competition, pricing strategies, and transportation costs.
Key Market Players
LG Display Co., Ltd. (South Korea), Samsung Electronics (South Korea), Innolux Corp. (Taiwan), AU Optronics (Taiwan), Japan Display Inc. (Japan), BOE Technology Group Co., Ltd. (China), Sharp Corp. (Japan), Visionox Corporation (China), E Ink Holdings, Inc. (Taiwan), Corning Incorporated (US), E. I. du Pont de Nemours and Company (US), FlexEnable Limited (UK), Kateeva (US), Cambrios Technologies Corp. (US), Royole Corporation (US) are the key market players in the Flexible display market.
Samsung Electronics Co., Ltd. was ranked first in the flexible display market in 2016. Samsung is one the largest electronics manufacturing companies in the world and has significant market share in medium-sized, and small and large display panels. The company is considered one of the top innovators in this market as it invests huge resources in developing technologies such as AMOLED, OLED, and QLED.
Recent Developments
- In January 2017, LG launched a wallpaper TV, which has a 4 mm deep flexible screen and can be hung on the wall by magnets. This TV product line is known as OLED W TVs. It features super-slim, bendable models that are available in 65- and 77-inch versions.
- In January 2017, Samsung Display launched curved quantum dot displays that include CH711 and the formerly released CFG70 and CF791 gaming monitors. These gaming monitors offer enhanced design and rich colors to promote an immersive and realistic viewing experience.
- In August 2016, Innolux developed a 5.5-inch WQHD flexible AMOLED display panel, which offers a super-refined 534 ppi resolution on a curved surface. The display was built on a plastic substrate through the LTPS process, using the fine metal mask technology and thin-film encapsulation and proprietary pixel rendering methods. The display has features such as high contrast and high color saturation.
- In August 2016, AUO launched 8K4K ultrahigh-resolution TV display technology, having a resolution that is 16 times that of full HD (7680 × 4320). This 65-inch display has notable value additions—4000R golden curvature, edge-to-edge bezel-less design, and REC 2020 90%, the color gamut broadcasting standard published by the ITU for ultrahigh-resolution (4K & 8K) displays.
- In January 2017, Japan Display Inc. (JDI) developed FULL ACTIVETM FLEX, which uses a plastic substrate on both sides of the liquid crystal layer, and introduced it into a 5.5-inch Full HD LCD for smartphone devices. FULL ACTIVETM FLEX can be used for curved shapes in smartphone designs.
Critical questions the report answers:
- Where will all these developments take the industry in the long term?
- What are the upcoming trends for the Flexible display market?
- Which segment provides the most opportunity for growth?
- Who are the leading vendors operating in this market?
- What are the opportunities for new market entrants?
To speak to our analyst for a discussion on the above findings, click Speak to Analyst
 Exclusive indicates content/data unique to MarketsandMarkets and not available with any competitors.
Table of Contents
1 Introduction
1.1 Study Objectives
1.2 Market Definition
1.3 Market Scope
1.3.1 Markets Covered
1.3.2 Years Considered for Study
1.4 Currency
1.5 Package Size
1.6 Limitations
1.7 Stakeholders
2 Research Methodology
2.1 Research Data
2.1.1 Secondary Data
2.1.1.1 Key Data from Secondary Sources
2.1.2 Primary Data
2.1.2.1 Key Data from Primary Sources
2.1.2.2 Key Industry Insights
2.1.2.3 Breakdown of Primaries
2.2 Market Size Estimation
2.2.1.1 Bottom-Up Approach and Top-Down Approach
2.2.1.2 Bottom-Up Approach
2.3 Market Breakdown and Data Triangulation
2.4 Research Assumptions
3 Executive Summary
4 Premium Insights
4.1 Lucrative Opportunities in the Flexible Display Market Growth
4.2 Market, By Technology
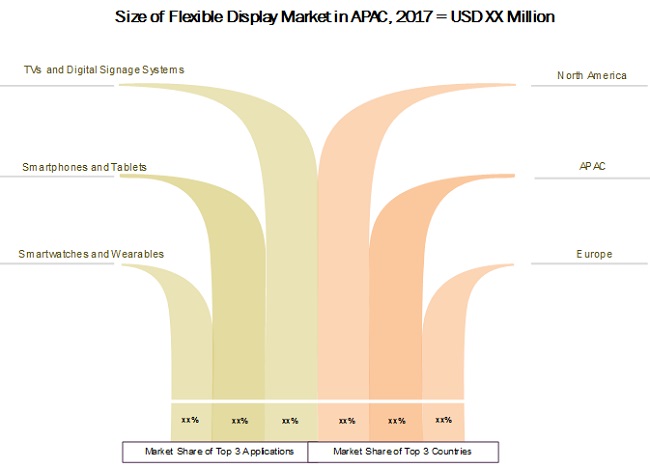
4.3 Market in APAC (2017)
4.4 Market Share of Major Countries and Regions, 2017
4.5 Market, by Panel Size
5 Market Overview
5.1 Introduction
5.2 Evaluation of Flexible Display
5.3 Flexible Electronics Concept
5.4 Basic Components of Flexible Display
5.5 Display Technologies Market Trends
5.6 Comparison of Display Technologies
5.7 Comparison of Flexible OLED, E-Paper, and Flexible LCD
5.8 Types of Flexible Display Technologies
5.9 Market Dynamics
5.9.1 Drivers
5.9.2 Restraints
5.9.3 Opportunities
5.9.4 Challenges
6 Industry Trends
6.1 Introduction
6.2 Value Chain Analysis
6.3 Standards and regulations related to flexible display products
6.4 Start-up companies and investor scenario
7 Flexible display Market by Application
7.1 Introduction
7.2 Smartphone & Tablet
7.3 Smartwatches & Wearables
7.4 Television & Digital Signage Systems
7.5 PC Monitors & Laptops
7.6 E-reader
7.7 Electronic Shelf Labels (ESLS)
7.8 Vehicles & Public Transports
7.9 Smart Home Appliances
8 Flexible display Market by, By Technology
8.1 Introduction
8.2 OLED Display
8.3 E-paper Display
8.4 Quantum dot LED Display
8.5 LED-Backlit LCD
9 Flexible Display Market by Panel Size
9.1 Introduction
9.2 Up to 6”
9.3 Above 50”
9.4 20-50”
9.5 6-20”
10 Flexible Display Market by Substrate Material
10.1 Introduction
10.2 Glass
10.3 Plastic
10.4 Others
11 Geographic Analysis
11.1 Introduction
11.2 North America
11.2.1 US
11.2.2 Canada
11.2.3 Mexico
11.3 Europe
11.3.1 UK
11.3.2 Germany
11.3.3 France
11.3.4 Rest of Europe
11.4 APAC
11.4.1 China
11.4.2 Japan
11.4.3 South Korea
11.4.4 Rest of APAC
11.5 Rest of the World (RoW)
11.5.1 Middle East
11.5.2 South America
11.5.3 Africa
12 Competitive Landscape
12.1 Introduction
12.2 Dive Chart: Flexible Display Market
12.2.1 Vanguards
12.2.2 Dynamic
12.2.3 Innovators
12.2.4 Emerging
12.3 Business Strategy (for all 25 players)
12.4 Product Offering (for all 25 players)
12.5 Market Ranking Analysis: Flexible Display Market
12.6 Competition and Trends
13 Company Profiles
13.1 Introduction
13.2 LG Display Co., Ltd.
13.3 Samsung Electronics
13.4 Innolux Corp.
13.5 AU Optronics Corp.
13.6 Japan Display Inc.
13.7 BOE Technology Group Co., Ltd.
13.8 Sharp Corp.
13.9 Visionox Corporation
13.10 E Ink Holdings, Inc.
13.11 Corning Incorporated
13.12 E. I. du Pont de Nemours and Company (US)
13.13 Key Innovators
13.13.1 FlexEnable Limited
13.13.2 Kateeva
13.13.3 Cambrios Technologies Corp.
13.13.4 Royole Corporation
14 Appendix
14.1 Insights of the Industry Experts
14.2 Discussion Guide
14.3 Knowledge Store: Marketsandmarkets’ Subscription Portal
14.4 Introducing RT: Real-Time Market Intelligence
14.5 Available Customization
14.6 Related Reports
14.7 Author Details
List of Tables (94 Tables)
Table 1 Flexible Display Market, By Application, 2017–2025 (USD Million)
Table 2 Market for Smartphones and Tablets in Terms of Value and Volume, 2017–2025
Table 3 Market for Smartphones and Tablets, By Technology, 2017–2025 (USD Million)
Table 4 Market for Smartphones and Tablets, By Panel Size, 2017–2025 (USD Million)
Table 5 Market for Smartphones and Tablets, By Region, 2017–2025 (USD Million)
Table 6 Market for Smartwatches and Wearables in Terms of Value and Volume, 2017–2025
Table 7 Market for Smartwatches and Wearables, By Technology, 2017–2025 (USD Million)
Table 8 Market for Smartwatches and Wearables, By Panel Size, 2017–2025 (USD Million)
Table 9 Market for Smartwatches and Wearables, By Region, 2017–2025 (USD Million)
Table 10 Market for Television & Digital Signage Systems in Terms of Value and Volume, 2017–2025
Table 11 Market for Television & Digital Signage Systems, By Technology, 2017–2025 (USD Million)
Table 12 Market for Television & Digital Signage Systems, By Panel Size, 2017–2025 (USD Million)
Table 13 Market for Television & Digital Signage Systems, By Region, 2017–2025 (USD Million)
Table 14 Market for PC Monitors & Laptops in Terms of Value and Volume, 2017–2025
Table 15 Market for PC Monitors & Laptops, By Technology, 2017–2025 (USD Million)
Table 16 Market for PC Monitors & Laptops, By Panel Size, 2017–2025 (USD Million)
Table 17 Market for PC Monitors & Laptops, By Region, 2017–2025 (USD Million)
Table 18 Market for E-Readers in Terms of Value and Volume, 2017–2025
Table 19 Market for E-Readers, By Technology, 2017–2025 (USD Million)
Table 20 Market for E-Readers, By Panel Size, 2017–2025 (USD Million)
Table 21 Market for E-Readers, By Region, 2017–2025 (USD Million)
Table 22 Market for Electronic Shelf Labels in Terms of Value and Volume, 2017–2025
Table 23 Market for Electronic Shelf Labels, By Technology, 2017–2025 (USD Million)
Table 24 Market for Electronic Shelf Labels, By Panel Size, 2017–2025 (USD Million)
Table 25 Market for Electronic Shelf Labels, By Region, 2017–2025 (USD Million)
Table 26 Market for Vehicles and Transport in Terms of Value and Volume, 2017–2025
Table 27 Market for Vehicles and Transport, By Technology, 2017–2025 (USD Million)
Table 28 Market for Vehicles and Transport, By Panel Size, 2017–2025 (USD Million)
Table 29 Market for Vehicles and Transport, By Region, 2017–2025 (USD Million)
Table 30 Market for Smart Home Appliances in Terms of Value and Volume, 2017–2025
Table 31 Market for Smart Home Appliances, By Technology, 2017–2025 (USD Million)
Table 32 Market for Smart Home Appliances, By Panel Size, 2017–2025 (USD Million)
Table 33 Market for Smart Home Appliances, By Region, 2017–2025 (USD Million)
Table 34 Flexible Display Market, By Technology, 2017–2025 (USD Million)
Table 35 Market for OLED, By Type, 2017–2025 (USD Million)
Table 36 Market for OLED, By Application, 2017–2025 (USD Million)
Table 37 Market for OLED, By Region, 2017–2025 (USD Million)
Table 38 Market for EPD, By Application, 2017–2025 (USD Million)
Table 39 Market for EPD, By Region, 2017–2025 (USD Million)
Table 40 Market for Quantum Dot LED, By Application, 2017–2025 (USD Million)
Table 41 Market for Quantum Dot LED, By Region, 2017–2025 (USD Million)
Table 42 Market for LED-Backlit LCD, By Application, 2017–2025 (USD Million)
Table 43 Market for LED-Backlit LCD, By Region, 2017–2025 (USD Million)
Table 44 Market, By Panel Size, 2017–2025 (USD Million)
Table 45 Market for Up to 6" Panel Size, By Application, 2017–2025 (USD Million)
Table 46 Market for Up to 6-20" Panel Size, By Application, 2017–2025 (USD Million)
Table 47 Market for Up to 20-50" Panel Size, By Application, 2017–2025 (USD Million)
Table 48 Market for Up to Above 50" Panel Size, By Application, 2017–2025 (USD Million)
Table 49 Market, By Substrate Material, 2017–2025 (USD Million)
Table 50 Market for Glass Material, Application, 2017–2025 (USD Million)
Table 51 Market for Plastic Material, Application, 2017–2025 (USD Million)
Table 52 Market for Other Material, Application, 2017–2025 (USD Million)
Table 53 Flexible Display Market, By Region, 2017–2025 (USD Million)
Table 54 Market in North America, By Application, 2017–2025 (USD Million)
Table 55 Market in North America, By Technology, 2017–2025 (USD Million)
Table 56 Market in North America, By Country, 2017–2025 (USD Million)
Table 57 Market in US, By Application, 2017–2025 (USD Million)
Table 58 Market in US, By Technology, 2017–2025 (USD Million)
Table 59 Market in Canada, By Application, 2017–2025 (USD Million)
Table 60 Market in Canada, By Technology, 2017–2025 (USD Million)
Table 61 Market in Mexico, By Application, 2017–2025 (USD Million)
Table 62 Market in Mexico, By Technology, 2017–2025 (USD Million)
Table 63 Market in Europe, By Application, 2017–2025 (USD Million)
Table 64 Market in Europe, By Technology, 2017–2025 (USD Million)
Table 65 Market in Europe, By Country, 2017–2025 (USD Million)
Table 66 Market in UK, By Application, 2017–2025 (USD Million)
Table 67 Market in UK, By Technology, 2017–2025 (USD Million)
Table 68 Market in Germany, By Application, 2017–2025 (USD Million)
Table 69 Market in Germany, By Technology, 2017–2025 (USD Million)
Table 70 Market in France, By Application, 2017–2025 (USD Million)
Table 71 Market in France, By Technology, 2017–2025 (USD Million)
Table 72 Market in Rest of Europe, By Application, 2017–2025 (USD Million)
Table 73 Market in Rest of Europe, By Technology, 2017–2025 (USD Million)
Table 74 Market in APAC, By Application, 2017–2025 (USD Million)
Table 75 Market in APAC, By Technology, 2017–2025 (USD Million)
Table 76 Market in APAC, By Country, 2017–2025 (USD Million)
Table 77 Market in China, By Application, 2017–2025 (USD Million)
Table 78 Market in China, By Technology, 2017–2025 (USD Million)
Table 79 Market in Japan, By Application, 2017–2025 (USD Million)
Table 80 Market in Japan, By Technology, 2017–2025 (USD Million)
Table 81 Market in South Korea, By Application, 2017–2025 (USD Million)
Table 82 Market in South Korea, By Technology, 2017–2025 (USD Million)
Table 83 Market in Rest of APAC, By Application, 2017–2025 (USD Million)
Table 84 Market in Rest of APAC, By Technology, 2017–2025 (USD Million)
Table 85 Market in RoW, By Application, 2017–2025 (USD Million)
Table 86 Market in RoW, By Technology, 2017–2025 (USD Million)
Table 87 Market in RoW, By Country, 2017–2025 (USD Million)
Table 88 Market in Middle East, By Application, 2017–2025 (USD Million)
Table 89 Market in Middle East, By Technology, 2017–2025 (USD Million)
Table 90 Market in South America, By Application, 2017–2025 (USD Million)
Table 91 Market in South America, By Technology, 2017–2025 (USD Million)
Table 92 Market in Africa, By Application, 2017–2025 (USD Million)
Table 93 Market in Africa, By Technology, 2017–2025 (USD Million)
Table 94 Key Player Market Ranking, 2016
List of Figures (51 Figures)
Figure 1 Flexible Display Market: Process Flow of Market Size Estimation
Figure 2 Market: Research Design
Figure 3 Market Size Estimation Meth0dology: Bottom-Up Approach
Figure 4 Market Size Estimation Meth0dology: Top-Down Approach
Figure 5 Data Triangulation
Figure 6 Assumptions for the Research Study
Figure 7 Market Snapshot (2017 vs 2022): Smartphones and Tablets Expected to Present Huge Market Opportunities During the Forecast Period
Figure 8 Market, By Technology (2016): OLED Expected to Account for the Highest Growing Rate During the Forecast Period
Figure 9 Up to 6" Inch Panel Size Expected to Hold the Largest Size of the Market During the Forecast Period
Figure 10 Market in APAC Expected to Grow at the Highest CAGR Between 2017 and 2022
Figure 11 Smartphones and Tablets Would Create Significant Opportunities for the Market Between 2017 and 2022
Figure 12 Market for OLED Panel Technology Expected to Grow at the Highest CAGR During the Forecast Period
Figure 13 China Held the Largest Share of the Market in APAC in 2016
Figure 14 US Held the Largest Share of the Market in 2016
Figure 15 Up to 6” Panel Size Expected to Hold the Largest Size of the Market During the Forecast Period
Figure 16 Roadmap of Flexible Display
Figure 17 Internal Structure of Flexible OLED Display
Figure 18 Display Technology Segmentation
Figure 19 Road Map to Flexible Flat-Panel Display
Figure 20 Drivers, Restraints, Opportunities, and Challenges for the Flexible Display Market
Figure 21 Market: Value Chain Analysis
Figure 22 Recent Investment Raised By Start-Ups
Figure 23 Market, By Application
Figure 24 Smartphones and Tablets to Hold the Largest Market Size By 2022
Figure 25 APAC to Dominate the Market for Smartphones and Tablets During the Forecast Period
Figure 26 OLED Display Technology to Dominate the Market for Smartwatches and Wearables During the Forecast Period
Figure 27 Televisions and Digital Signage Systems With Above 50 Inches Panel Size to Hold the Largest Market Size During the Forecast Period
Figure 28 Market for PC Monitors and Laptops Largest Market Size in North America During the Forecast Period
Figure 29 Market, By Technology
Figure 30 OLED Technology Expected to Hold the Largest Size of the Market During the Forecast Period
Figure 31 Amoled Will Hold the Larger Market Share in In OLED Subtypes During the Forecast Period
Figure 32 North America Holds the Largest Size of the Market During the Forecast Period
Figure 33 Market for 6–20" Panel Size Expected to Grow at the Highest CAGR During the Forecast Period
Figure 34 US Accounted for the Largest Share in the Market in 2016
Figure 35 Flexible Display Market Snapshot: North America (2016)
Figure 36 Market Snapshot: Europe (2016)
Figure 37 Market Snapshot: APAC (2016)
Figure 38 Companies Adopted New Product Launches and Expansions as Key Growth Strategies Between 2014 and 2017
Figure 39 Market Evolution Framework: New Product Launches and Developments Fueled Growth and Innovation in the Market Between 2014 and 2017
Figure 40 Battle for Market Share: New Product Launches and Developments Were the Key Strategies Adopted During 2014–2017
Figure 41 Geographic Revenue Mix of Top 4 Market Players
Figure 42 LG Display Co., Ltd.: Company Snapshot
Figure 43 Samsung Electronics Co., Ltd.: Company Snapshot
Figure 44 Innolux Corp.: Company Snapshot
Figure 45 AU Optronics Corp.: Company Snapshot
Figure 46 Japan Display Inc.: Company Snapshot
Figure 47 BOE Technology Group Co., Ltd.: Company Snapshot
Figure 48 Sharp Corp.: Company Snapshot
Figure 49 E Ink Holdings, Inc.: Company Snapshot
Figure 50 Corning Incorporated: Company Snapshot
Figure 51 E. I. Du Pont De Nemours and Company: Company Snapshot
The flexible display industry has witnessed high fluctuations in the ASP of raw materials and flexible display panels. When production capacity sharply increases, the ASP of flexible display panels may decrease. In contrast, when supply cannot meet the increasing demand, ASP may increase.
Scope of the Report
|
Report Metric |
Details |
||||
|
Report Name |
Flexible Display Market |
||||
|
Base year considered |
2016 |
||||
|
Forecast period |
2017–2022 |
||||
|
Forecast units |
Million (USD) |
||||
|
Segments covered |
Application, Technology, Panel Size, Substrate Material and Region |
||||
|
Geographies covered |
North America, Europe, Asia Pacific, RoW |
||||
|
Companies covered |
|
||||
Flexible Display Market Segmentation
The research report categorizes the Flexible display to forecast the revenues and analyze the trends in each of the following sub-segments:
Flexible Display Market, By Application
- Smartphone & Tablet
- Smartwatches & Wearables
- Television & Digital Signage Systems
- PC Monitors & Laptops
- E-reader
- Electronic Shelf Labels (ESLS)
- Vehicles & Public Transports
- Smart Home Appliances
Flexible Display Market, By Technology
- OLED Display
- E-paper Display
- Quantum dot LED Display
- LED-Backlit LCD
Flexible Display Market, By Panel Size
- Up to 6”
- Above 50”
- 20-50”
- 6-20”
Flexible Display Market, By Substrate Material
- Glass
- Plastic
- Others
Flexible Display Market, By Region
- Asia Pacific (APAC)
- North America
- Europe
- RoW


Growth opportunities and latent adjacency in Flexible Display Market