Food Authenticity Testing Market by Target Testing (Meat Speciation, Country of Origin & Ageing, Adulteration & False Labeling), Technology (PCR-Based, LC-MS/MS, Isotope), Food Tested (Meat, Dairy, Processed Foods), and Region - Global Forecast to 2022


[207 Pages] The food authenticity testing market, in terms of value, is projected to reach USD 7.50 billion by 2022, at a CAGR of 7.6% from 2016 to 2022. The growing international trade is one of the factors driving this market as compels the manufacturers to comply with the global mandates and regulations for food authenticity due to the growing economically motivated adulterations (EMAs). As international trade increases complexities in the supply chain and the chances of cross-contamination and fraud, the demand for food authentication services is projected to remain high.
Request for Customization to get the global Food Authenticity Market forecasts to 2025
The years considered for the study are as follows:
- Base year � 2015
- Estimated year � 2016
- Projected year � 2022
- Forecast period � 2016 to 2022
The objectives of the report
- To define, segment, and project the size of the global food authenticity testing market on the basis of target testing, technology, and food tested
- To understand the structure of the food authenticity testing market by identifying its various subsegments
- To provide detailed information about the key factors influencing the growth of the market (drivers, restraints, opportunities, and industry-specific challenges)
- To strategically analyze micromarkets with respect to individual growth trends, future prospects, and their contribution to the total market
- To analyze the opportunities in the market for stakeholders and provide a competitive landscape of market trends
- To project the size of the market and its submarkets, in terms of value, with respect to four regions (along with their respective key countries)�North America, Europe, Asia-Pacific, and the Rest of the World (RoW)
Research Methodology:
- Major regions were identified along with countries contributing the maximum share
- Secondary research was carried out to determine the number of food authenticity cases and incidence in regions such as North America, Europe, Asia Pacific, and RoW; trends in the food testing industry and their contribution
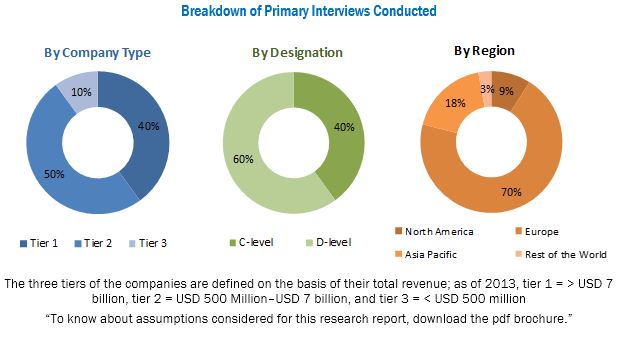
- The market research is carried out through secondary sources, such as World Authenticity Organization (WAO), Codex Alimentaurius Commission (CODEX), Centers for Disease Control and Prevention (CDC), The European Federation of National Associations of Measurement, Testing, and Analytical Laboratories (EUROLAB), and Food and Agriculture Organization (FAO), while their market share in respective regions were determined through both, primary and secondary research. The research methodology includes the study of annual and financial reports of top market players as well as interviews with industry experts (such as CEOs, VPs, directors, and marketing executives) for key insights (both, quantitative and qualitative) for the food authenticity testing market.
To know about the assumptions considered for the study, download the pdf brochure
Target Audience
The stakeholders for the report are as follows:
- Manufacturers, importers & exporters, traders, distributors, and suppliers of equipment, reagents, chemicals, and other related consumables
- Food authenticity testing solutions providers
- Food authenticity testing laboratories
- Food processors
- Food manufacturers
- Government and research organizations
- Trade associations and industry bodies
Scope of the Report
This research report categorizes the food authenticity testing market based on target testing, food tested, technology, and region.
Based on target testing the market has been segmented as follows:
- Meat speciation
- Country of origin and aging
- Adulteration tests
- False labeling
Based on technology the market has been segmented as follows:
- PCR-based
- LC-MS/MS
- Isotope methods
- Immunoassay-based
- Others
Based on food tested the market has been segmented as follows:
- Meat & meat products
- Dairy & dairy products
- Processed foods
- Ingredients
- Cereals, grains, and pulses
Based on region the market has been segmented as follows:
- North America
- Europe
- Asia Pacific
- RoW (Brazil, Argentina, and the Middle East)
Available Customizations
With the given market data, MarketsandMarkets offers customizations according to client-specific scientific needs.
The following customization options are available for the report:
Product Analysis
- Product matrix, which gives a detailed comparison of the product portfolio of each company
Company Information
- Detailed analysis and profiling of additional market players (up to five)
The food authenticity testing market size is projected to reach USD 7.50 billion by 2022, at a CAGR of 7.6% from 2016 to 2022. Growing awareness among consumers about food authenticity and regulations is one of the major factors driving the market for food authenticity testing. Rising concerns pertaining to food authenticity among consumers has been witnessed over the last few decades. To align with the growing requirements of the consumers, leading manufacturers are focusing on improving the quality & safety of food products through labels, claims, and nutrition facts.
The food authenticity testing market, based on target testing, is segmented as meat speciation, country of origin and aging, adulteration tests, and false labeling. The adulteration tests segment is projected to be largest, and the meat speciation segment is projected to be the fastest growing in the food authenticity testing market through 2022. The increasing number of food frauds due to the complexity of the supply chain also contributed to the market growth.
The food authenticity testing market, on the basis of technology, is segmented into PCR-based, LC-MS/MS, isotope methods, immunoassay-based, and others, which includes NMR spectroscopy, test kits, and chemical tests. The PCR-based technology witnesses an increased use in food authenticity testing. It is a molecular technique that uses DNA for the analysis of meat and food products, providing precise results on testing. The technology amplifies fragments of DNA extracted from the food product samples to accurately identify the DNA of each species in the product. This enables cross-checking of the product�s authenticity and confirmation of product claims. LC-MS/MS represents the second largest technology segment in the market. This technology is used to detect the authenticity in the food products as well. The testing market through PCR-based technologies is largely driven by its wide applicability, accurate determination of adulterant, meat species or GMO in products even at 0.1% levels of detection.
The food authenticity testing market, based on food tested, is categorized into meat & meat products, dairy & dairy products, processed foods, ingredients, cereals, grains, and pulses. The processed food segment is projected to be the largest segment, whereas the meat & meat products segment is projected to witness the fastest growth in the market. The growth of the processed food segment is attributed to a wide number of processing applications of products such as infant formula, packaged food, wine, and other processed food products. Due to the increasing fraud and counterfeit instances in processed food products, the demand for the food authentication testing services remains high in this segment. On account of these factors, the processed food segment is projected to be the largest in the food authenticity testing market.
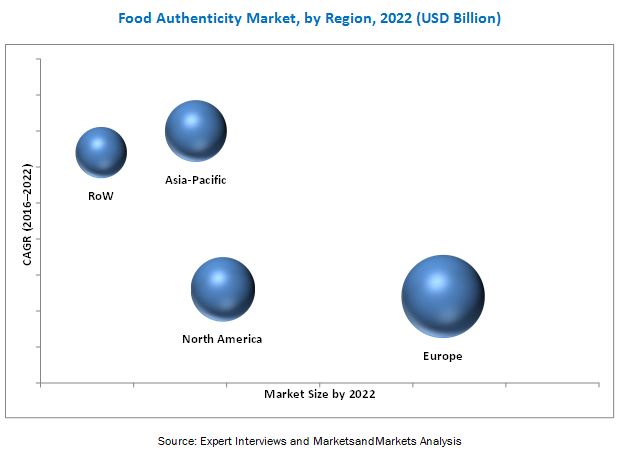
The food authenticity testing market was dominated by Europe in 2015. The food authenticity policies have been strengthened by the contributed efforts from National reference laboratories (NRLs), EU Reference Laboratories (EURLs), and European Academy of Allergy and Clinical Immunology (EAAACI). Implementation of food safety regulations, increasing number of consumer complaints, and labeling compliance have driven the food authenticity testing market in Europe. Asia-Pacific is projected to be the fastest growing food authenticity testing market. The increasing number of international trade for food materials in the North American countries, such as the US has compeled the manufacturers to comply with the labeling requirement and authenticity confirmation in the foods.
The lack of food control infrastructure & resources in developing countries, the complexity of testing techniques, and lack of harmonization of regulations are the restraining factors in the food authenticity testing market. Some of the leading players include SGS SA (Switzerland), Intertek Group plc (U.K.), Eurofins Scientific (Luxembourg), ALS Limited (Australia), and LGC Science Group Ltd (U.K.). In June 2015, Eurofins Scientific launched a new DNA chip technology analytical method, which would detect and identify 21 animal species in feed and food products simultaneously. In May 2014, Eurofins Scientific acquired ViraCor-IBT Laboratories, Inc. (US), which provided biological and large molecular biomarker support; its testing facility included quantitative and qualitative PCR, DNA sequencing, ELISA, and other immunoassay platforms. Intertek Group plc (UK) is one of the leading food authenticity testing service providers due to its strong global presence and service infrastructure. In July 2016, Intertek developed new technology for honey authenticity testing, which is based on NMR (Nuclear Magnetic Resonance) spectroscopy. In May 2016, Intertek launched its AgriTech laboratory at Hyderabad (India) to perform DNA-based testing of various agricultural products. The company introduced its advanced ScanBi DNA testing technology in India with this expansion.
To speak to our analyst for a discussion on the above findings, click Speak to Analyst
 Exclusive indicates content/data unique to MarketsandMarkets and not available with any competitors.
Table of Contents
1 Introduction (Page No. - 20)
1.1 Objectives of the Study
1.2 Market Definition
1.3 Market Scope
1.4 Periodization Considered for the Study
1.5 Currency
1.6 Stakeholders
1.7 Limitations
2 Research Methodology (Page No. - 24)
2.1 Research Data
2.1.1 Secondary Data
2.1.1.1 Key Data From Secondary Sources
2.1.2 Primary Data
2.1.2.1 Key Data From Primary Sources
2.1.2.2 Key Industry Insights
2.1.2.3 Breakdown of Primaries
2.2 Market Size Estimation
2.3 Market Breakdown & Data Triangulation
2.4 Research Assumptions
3 Executive Summary (Page No. - 34)
4 Premium Insights (Page No. - 40)
4.1 Opportunities in the Food Authenticity Testing Market
4.2 Food Authenticity Testing Market: Key Countries
4.3 Developed vs Developing Markets for Food Authenticity Testing
4.4 Food Authenticity Testing Market, By Target Testing & Region
4.5 Food Authenticity Testing Market, By Food Tested & Region
4.6 Europe Food Authenticity Testing Market, By Country & Target Testing
5 Market Overview (Page No. - 46)
5.1 Introduction
5.2 High Investment and R&D Trend in Biotech & Food Authenticity Testing Technologies
5.3 Market Segmentation
5.3.1 By Target Testing
5.3.2 By Technology
5.3.3 By Food Tested
5.3.4 By Region
5.4 Market Dynamics
5.4.1 Drivers
5.4.1.1 Implementation of Stringent Regulations in Developed Countries
5.4.1.2 Increasing Incidences of False Labeling & Certification
5.4.1.3 Increased EMA (Economically Motivated Adulterations) Due to High Competition
5.4.1.3.1 Addition of Exogenous Substance
5.4.1.3.2 Addition of Endogenous Substance
5.4.1.4 Increase in Incidence of Food Frauds
5.4.1.4.1 Usage of Banned Ingredients
5.4.1.4.2 Products Originating From Banned Processes Or Banned Geographic Areas
5.4.1.4.3 Consumer Complaints & Food Recalls
5.4.1.5 Growing International Trade
5.4.1.5.1 Complexity of Supply Chain
5.4.1.5.2 Cross Contamination Due to Complex Processes
5.4.1.6 Growing Awareness Among Consumers About Food Authenticity and Regulations
5.4.2 Restraints
5.4.2.1 Lack of Food Control Infrastructure & Resources in Developing Countries
5.4.2.2 Complexity in Testing Techniques
5.4.2.2.1 Difficulties in Detection of Unknown Adulterants By Chemical Tests
5.4.2.2.2 Varying Test Results With Test Methods
5.4.2.3 Lack of Harmonization of Regulations
5.4.3 Opportunities
5.4.3.1 Emerging Markets in Asian, African, and Other Countries
5.4.3.2 Technological Advancements in the Industry & Test Kits for Onsite Testing
5.4.4 Challenges
5.4.4.1 Unaffordability of Tests By Manufacturers
5.4.4.2 Inappropriate Sample Collection & Standardization
6 Food Authenticity Testing Market, By Target Testing (Page No. - 65)
6.1 Introduction
6.2 Meat Speciation
6.3 Country of Origin and Ageing
6.4 Adulteration Tests
6.5 False Labeling
6.5.1 GMO Testing
6.5.2 Allergen Testing
7 Food Authenticity Testing Market, By Technology (Page No. - 75)
7.1 Introduction
7.2 PCR (Polymerase Chain Reaction)-Based
7.3 Lc-Ms/Ms
7.4 Isotope Methods
7.5 Immunoassay-Based/Elisa (Enzyme-Linked Immunosorbent Assay)
7.6 Others
8 Food Authenticity Testing Market, By Food Tested (Page No. - 86)
8.1 Introduction
8.2 Meat & Meat Products
8.3 Dairy & Dairy Products
8.4 Processed Food
8.5 Ingredients
8.6 Cereals, Grains, and Pulses
9 Food Authenticity Testing Market, By Region (Page No. - 94)
9.1 Introduction
9.2 North America
9.2.1 U.S.
9.2.2 Canada
9.2.3 Mexico
9.3 Europe
9.3.1 Germany
9.3.2 U.K.
9.3.3 France
9.3.4 Italy
9.3.4.1 PDO (Protected Designation of Origin)
9.3.4.2 PGI (Protected Geographical Indication)
9.3.5 Spain
9.3.6 Rest of Europe
9.4 Asia-Pacific
9.4.1 China
9.4.2 Japan
9.4.3 India
9.4.4 Australia & New Zealand
9.4.5 Rest of Asia-Pacific
9.5 Rest of the World (RoW)
9.5.1 Brazil
9.5.2 Argentina
9.5.3 Middle East
9.5.4 Others in RoW
10 Regulations for the Food Authenticity Testing Market (Page No. - 132)
10.1 Introduction
10.2 International Body for Food Safety Standards and Regulations
10.2.1 Codex Alimentarius Commission (CAC)
10.3 Global Food Safety Initiative (GFSI)
10.4 North America
10.4.1 U.S. Regulations
10.4.2 U.S. Food and Drug Administration (FDA)
10.4.2.1 Food Allergen Labeling and Consumer Protection Act
10.4.2.2 U.S. Department of Agriculture's Food Safety and Inspection Service (FSIS)
10.4.2.3 Federal Legislation
10.4.2.3.1 State Legislation
10.4.2.3.2 Food Safety in Retail Food
10.4.2.3.3 Food Safety in Trade
10.4.2.3.4 Haccp Regulation in the U.S.
10.4.2.3.5 Food Safety Regulations for Fruit & Vegetable Growers
10.4.2.3.6 GMOs Regulation in U.S.
10.4.2.3.6.1 FDA Food Safety Modernization Act (FSMA)
10.4.2.3.6.2 Labeling of GM Foods
10.4.3 Canada
10.4.4 Mexico
10.5 Europe
10.5.1 European Union Regulations
10.5.1.1 Melamine Legislation
10.5.1.2 General Food Law for Food Safety
10.5.1.3 GMOs Regulation
10.5.1.4 Country of Origin Labeling Requirements
10.5.2 Germany
10.5.3 U.K.
10.6 Asia-Pacific
10.6.1 China
10.6.2 India
10.6.2.1 Food Safety Standards Amendment Regulations, 2012
10.6.2.2 Food Safety Standards Amendment Regulations, 2011
10.6.2.3 Food Safety and Standards Act, 2006
10.6.3 Australia
10.6.3.1 Food Standards Australia New Zealand
10.6.4 New Zealand
10.6.5 GMOs Labeling Regulation in Asia-Pacific
10.6.6 Japan
10.7 Brazil
11 Competitive Landscape (Page No. - 146)
11.1 Overview
11.2 Key Market Strategies
11.3 Competitive Situation and Trends
11.4 Expansions & Investments
11.5 Acquisitions
11.6 Agreements, Collaborations, Partnerships & New Technology Launches
11.7 New Service Launches
12 Company Profiles (Page No. - 155)
12.1 Introduction
(Business Overview, Products Offered, Recent Developments, MnM View, SWOT Analysis, Key Strategies)*
12.2 SGS S.A.
12.3 Intertek Group PLC
12.4 Eurofins Scientific SE
12.5 ALS Limited
12.6 LGC Science Group Ltd.
12.7 M�rieux Nutrisciences Corporation
12.8 Microbac Laboratories, Inc.
12.9 EMSL Analytical Inc.
12.10 Romer Labs Diagnostic GmbH
12.11 Genetic Id Na, Inc.
*Business Overview, Products Offered, Recent Developments, MnM View, SWOT Analysis, Key Strategies Might Not Be Captured in Case of Unlisted Companies.
13 Appendix (Page No. - 187)
13.1 Discussion Guide
13.2 Knowledge Store: Marketsandmarkets� Subscription Portal
13.3 More Company Developments
13.3.1 Acquisitions
13.3.2 Expansions & Investments
13.3.3 Agreements, Collaborations, Partnerships, and New Technology Launches
13.3.4 New Service Launches
13.4 Introducing RT: Real Time Market Intelligence
13.5 Available Customizations
13.6 Related Reports
13.7 Author Details
List of Tables (113 Tables)
Table 1 Costs of Assurance Activities By Regulatory Bodies Across Supply Chain in Europe
Table 2 Food Recalls, 2010�2015
Table 3 Allergen Recalls in U.S. (2015)
Table 4 Food Products From U.S. Banned in Other Countries
Table 5 Food Authenticity Testing Market Size, By Target Testing, 2014�2022 (USD Million)
Table 6 False Labelling Testing Market Size, By Type, 2014�2022 (USD Million)
Table 7 Meat Speciation: Food Authenticity Testing Market Size, By Region, 2014�2022 (USD Million)
Table 8 Country of Origin and Ageing: Food Authenticity Testing Market Size, By Region, 2014�2022 (USD Million)
Table 9 Adulteration Tests: Food Authenticity Testing Market Size, By Region, 2014�2022 (USD Million)
Table 10 False Labeling: Food Authenticity Testing Market Size, By Region, 2014�2022 (USD Million)
Table 11 GMO Testing: Food Authenticity Testing Market Size, By Region, 2014�2022 (USD Million)
Table 12 Allergen Testing: Food Authenticity Testing Market Size, By Region, 2014�2022 (USD Million)
Table 13 Food Authenticty Testing Market Size, By Technology, 2014-2022 (USD Million)
Table 14 PCR-Based Food Authenticity Testing Market Size, By Region, 2014-2022 (USD Million)
Table 15 Lc-Ms/Ms Food Authenticity Testing Market Size, By Region, 2014-2022 (USD Million)
Table 16 Application of Isotope Method for Certain Food Products
Table 17 Isotope Methods Food Authenticity Testing Market Size, By Region, 2014-2022 (USD Million)
Table 18 Immunoassay-Based Food Authenticity Testing Market Size, By Region, 2014-2022 (USD Million)
Table 19 Others Food Authenticity Testing Market Size, By Region, 2014�2022 (USD Million)
Table 20 Food Authenticity Testing Market Size, By Food Tested, 2014�2022 (USD Million)
Table 21 Meat & Meat Product Testing Market Size, By Food Tested, 2014�2022 (USD Million)
Table 22 Dairy & Dairy Products Market Size, By Food Tested, 2014�2022 (USD Million)
Table 23 Processed Food Market Size, By Food Tested, 2014�2022 (USD Million)
Table 24 Ingredients Market Size, By Food Tested, 2014�2022 (USD Million)
Table 25 Cereals, Grains, and Pulses Market Size, By Food Tested, 2014�2022 (USD Million)
Table 26 Food Authenticity Testing Market Size, By Region, 2014�2022 (USD Million)
Table 27 North America: Food Authenticity Testing Market Size, By Country, 2014�2022 (USD Million)
Table 28 North America: Food Authenticity Testing Market Size, By Technology, 2014�2022 (USD Million)
Table 29 North America: Food Authenticity Testing Market Size, By Food Tested, 2014�2022 (USD Million)
Table 30 U.S.: Food Fraud Details
Table 31 U.S.: Food Authenticity Testing Market Size, By Target Testing, 2014�2022 (USD Million)
Table 32 U.S.: False Labelling Market Size, By Type, 2014�2022 (USD Million)
Table 33 Canada: Food Fraud Details
Table 34 Canada: Food Authenticity Testing Market Size, By Target Testing, 2014�2022 (USD Million)
Table 35 Canada: False Labeling Market Size, By Type, 2014�2022 (USD Million)
Table 36 Mexico: Food Authenticity Testing Market Size, By Target Testing, 2014�2022 (USD Million)
Table 37 Mexico: False Labeling Market Size, By Type, 2014�2022 (USD Million)
Table 38 Europe: Food Authenticity Testing Market Size, By Country, 2014�2022 (USD Million)
Table 39 Europe: Food Authenticity Testing Market Size, By Technology, 2014�2022 (USD Million)
Table 40 Europe: Food Authenticity Testing Market Size, By Food Tested, 2014�2022 (USD Million)
Table 41 Germany: Food Fraud Details
Table 42 Germany: Food Authenticity Testing Market Size, By Target Testing, 2014�2022 (USD Million)
Table 43 Germany: False Labelling Market Size, By Type, 2014�2022 (USD Million)
Table 44 U.K.: Food Fraud Details
Table 45 U.K.: Food Authenticity Testing Market Size, By Target Testing, 2014�2022 (USD Million)
Table 46 U.K.: False Labelling Market Size, By Type, 2014�2022 (USD Million)
Table 47 France: Food Fraud Details
Table 48 France: Food Authenticity Testing Market Size, By Target Testing, 2014�2022 (USD Million)
Table 49 France: False Labelling Market Size, By Type, 2014�2022 (USD Million)
Table 50 Italy: Food Fraud Details
Table 51 Italy: Food Authenticity Testing Market Size, By Target Testing, 2014�2022 (USD Million)
Table 52 Spain: Food Authenticity Testing Market Size, By Target Testing, 2014�2022 (USD Million)
Table 53 Spain: False Labelling Market Size, By Type, 2014�2022 (USD Million)
Table 54 Rest of Europe: Food Fraud Details
Table 55 Rest of Europe: Food Authenticity Testing Market Size, By Target Testing, 2014�2022 (USD Million)
Table 56 Rest of Europe: False Labelling Market Size, By Type, 2014�2022 (USD Million)
Table 57 Asia-Pacific: Food Authenticity Testing Market Size, By Country, 2014�2022 (USD Million)
Table 58 Asia Pacific: Food Authenticity Testing Market Size, By Technology, 2014�2022 (USD Million)
Table 59 Asia Pacific: Food Authenticity Testing Market Size, By Food Tested, 2014�2022 (USD Million)
Table 60 China: Food Fraud Details
Table 61 China: Food Authenticity Testing Market Size, By Target Testing, 2014�2022 (USD Million)
Table 62 China: False Labelling Market Size, By Type, 2014�2022 (USD Million)
Table 63 Japan: Food Authenticity Testing Market Size, By Target Testing, 2014�2022 (USD Million)
Table 64 Japan: False Labelling Market Size, By Type, 2014�2022 (USD Million)
Table 65 India: Food Fraud Details
Table 66 India: Food Authenticity Testing Market Size, By Target Testing, 2014�2022 (USD Million)
Table 67 Australia & New Zealand: Food Fraud Details
Table 68 Australia & New Zealand: Food Authenticity Testing Market Size, By Target Testing, 2014�2022 (USD Million)
Table 69 Australia & New Zealand: False Labelling Market Size, By Type, 2014�2022 (USD Million)
Table 70 Rest of Asia-Pacific: Food Fraud Details
Table 71 Rest of Asia-Pacific: Food Authenticity Testing Market Size, By Target Testing, 2014�2022 (USD Million)
Table 72 Rest of Asia-Pacific: False Labelling Market Size, By Type, 2014�2022 (USD Million)
Table 73 RoW: Food Authenticity Testing Market Size, By Country, 2014-2022 (USD Million)
Table 74 RoW: Food Authenticity Testing Market Size, By Technology, 2014�2022 (USD Million)
Table 75 RoW: Food Authenticity Testing Market Size, By Food Tested, 2014�2022 (USD Million)
Table 76 Brazil: Food Fraud Details
Table 77 Brazil: Food Authenticity Testing Market, By Target Testing, 2014�2022 (USD Million)
Table 78 Brazil: False Labelling Market Size, By Type, 2014�2022 (USD Million)
Table 79 Argentina: Food Authenticity Testing Market, By Target Testing, 2014�2022 (USD Million)
Table 80 Argentina: False Labelling Market Size, By Type, 2014�2022 (USD Million)
Table 81 Middle East: Food Authenticity Testing Market, By Target Testing, 2014�2022 (USD Million)
Table 82 Others in RoW: Food Fraud Details
Table 83 Others in RoW: Food Authenticity Testing Market, By Target Testing, 2014�2022 (USD Million)
Table 84 Others in RoW: False Labelling Market Size, By Type, 2014�2022 (USD Million)
Table 85 Federal Food, Drug & Cosmetic Act, By Tolerances of Raw & Processed Food
Table 86 Maximum Level for Melamine & Its Structural Analogs
Table 87 GMOs: Labeling Requirement
Table 88 GMOs Labeling in Asia-Pacific Countries
Table 89 Expansions & Investments, 2016
Table 90 Acquisitions, 2016
Table 91 Agreements, Collaborations, Partnerships & New Technology Launches, 2016
Table 92 New Service Launches, 2015
Table 93 SGS SA: Services Offered
Table 94 SGS SA: Recent Developments
Table 95 Intertek Group PLC: Services Offered
Table 96 Intertek Group PLC.: Recent Developments
Table 97 Eurofins Scientific: Services Offered
Table 98 Eurofins Scientific: Recent Developments
Table 99 ALS Limited: Services Offered
Table 100 ALS Limited: Recent Developments
Table 101 LGC Science Group Ltd.: Services Offered
Table 102 M�rieux Nutrisciences Corporation : Services Offered
Table 103 M�rieux Nutrisciences Corporation : Recent Developments
Table 104 Microbac Laboratories, Inc.: Services Offered
Table 105 Microbac Laboratories, Inc.: Recent Developments
Table 106 EMSL Analytical Inc.: Services/Products Offered
Table 107 EMSL Analytical Inc.: Recent Developments
Table 108 Romer Labs Diagnostic GmbH: Services/Products Offered
Table 109 Romer Labs Diagnostic GmbH: Recent Developments
Table 110 Acquisitions, 2011�2016
Table 111 Expansions, 202011�2016
Table 112 Agreements, Collaborations, Partnerships, and New Technology Launches, 2012�2015
Table 113 New Service Launches, 2011�2013
List of Figures (55 Figures)
Figure 1 Market Snapshot: Food Authenticity Testing
Figure 2 Geographic Scope of the Food Authenticity Testing Market
Figure 3 Research Design: Food Authenticity Testing
Figure 4 Breakdown of Primaries: By Company, Designation, and Region
Figure 5 Market Size Estimation Methodology: Bottom-Up Approach
Figure 6 Market Size Estimation Methodology: Top-Down Approach
Figure 7 Data Triangulation Methodology
Figure 8 Food Authenticity Testing Market Snapshot, By Target Testing, 2016 vs 2022
Figure 9 Food Authenticity Testing Market Share (Value), By Region, 2016�2022
Figure 10 Food Authenticity Testing Market Size, By Technology, 2016�2022
Figure 11 Food Authenticity Testing Market Size, By Food Tested, 2016�2022
Figure 12 Food Authenticity Testing Market Share (Value), By Region, 2015
Figure 13 Implementation of Stringent Regulations & Labeling Compliance Would Drive the Growth of the Food Authenticity Testing Market
Figure 14 China is Projected to Be the Fastest-Growing Market During the Forecast Period
Figure 15 Developing Countries Projected to Be Relatively Faster Growing Emerging Markets During the Forecast Period
Figure 16 Europe Dominated the Food Authenticity Testing Market Across All Types in 2015
Figure 17 Processed Food Was the Largest Food Tested Segment in 2015
Figure 18 Food Authenticity Testing Market is Dominated By European Region in 2015 (USD Billion)
Figure 19 Research Studies Trend in Food Authenticity
Figure 20 Food Authenticity Testing Market, By Target Testing, 2015
Figure 21 Food Authenticity Testing Market, By Technology, 2015
Figure 22 Food Authenticity Testing Market, By Food Tested
Figure 23 Food Authenticity Testing Market Snapshot, By Region
Figure 24 Market Dynamics: Food Authenticity Testing Market
Figure 25 Survey Results on Labeling Requirement of Consumers to Minimise Unintentional Contamination & Food Frauds
Figure 26 Major Incidents of Economically Motivated Adulterations (EMA) From 1980 to 2013
Figure 27 Types of Food Fraud Cases Across World
Figure 28 Food Authenticity Testing Market Size, By Target Testing, 2016�2022 (USD Million)
Figure 29 Most Problematic Ingredients for EMA
Figure 30 Adulteration Tests: Food Authenticity Testing Market Size, By Region, 2014�2022 (USD Million)
Figure 31 Wide Applications of PCR-Based Technology Drives the Food Authenticity Testing Market Growth
Figure 32 PCR-Based Technology is Projected to Fastest Growing in Food Authenticty Testing Market, 2014-2022 (USD Million)
Figure 33 Europe is Projected to Be the Largest Market for PCR-Based Technology
Figure 34 Food Authenticity Testing Market, By Food Tested
Figure 35 Food Authenticity Testing Market Size, By Food Tested, 2016�2022 (USD Million)
Figure 36 Processed Food Market Size in Food Authenticity Testing Market, By Food Tested, 2016�2022 (USD Million)
Figure 37 U.S. Held the Largest Share in the Food Authenticity Testing Market, in 2015
Figure 38 Economically Motivated Adulteration Incidences, By Country, 1980 to 2014
Figure 39 North American Market Snapshot
Figure 40 Food Fraud Types in European Union, 2014
Figure 41 European Food Authenticity Testing Market Snapshot
Figure 42 Acquisitions, Expansions & Investments: Leading Approach of Key Companies
Figure 43 Food Authenticity Testing Market Developments, By Growth Strategy, 2011�2016
Figure 44 Food Authenticity Testing Market Growth Strategies, By Company, 2011�2016
Figure 45 Geographic Revenue Mix of Top Five Market Players
Figure 46 SGS SA: Company Snapshot
Figure 47 SGS SA: SWOT Analysis
Figure 48 Intertek Group PLC: Company Snapshot
Figure 49 Intertek Group PLC: SWOT Analysis
Figure 50 Eurofins Scientific SE: Company Snapshot
Figure 51 Eurofins Scientific SE: SWOT Analysis
Figure 52 ALS Limited: Company Snapshot
Figure 53 ALS Limited: SWOT Analysis
Figure 54 LGC Science Group Ltd.: Company Snapshot
Figure 55 LGC Group: SWOT Analysis


Growth opportunities and latent adjacency in Food Authenticity Testing Market