GMO Testing Market by Trait (Stacked, Herbicide Tolerance, Insect Resistance), Technology (Polymerase Chain Reaction, Immunoassay), Crop Tested, Processed Food Tested, and Region - Global Forecast to 2022


[179 Pages Report] The GMO testing market is estimated to be valued at USD 1.58 Billion in 2017. It is projected to grow at a CAGR of 8.2% from 2017 to 2022, to reach USD 2.34 Billion by 2022. The base year considered for the study is 2016, and the forecast years are from 2017 to 2022.
GMO testing includes testing of crops and processed food for various traits such as stacked, herbicide tolerance, and insect resistance. The production of genetically modified crops is growing due to increase in nutritional demand, which in turn has led to the rise in stringency in genetically modified food safety regulations. This fueled the growth of the GMO testing market. The market players are responding to these new opportunities by expanding their global presence and product lines. The GMO testing market is segmented on the basis of trait, technology, crop & processed food tested, and region.
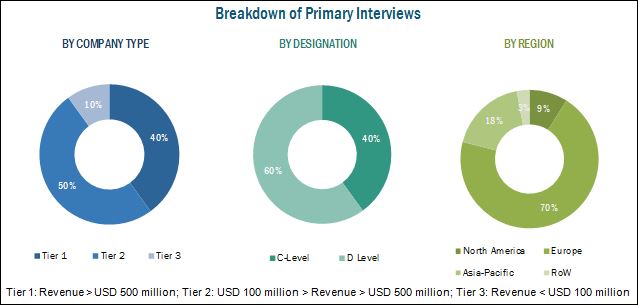
This report includes estimations of market sizes for value (USD million). Both, top-down and bottom-up approaches have been used to estimate and validate the size of the global genetically modified food safety testing market and to estimate the size of various other dependent submarkets in the overall market. Key players in the market have been identified through secondary research, and their market share in respective regions has been determined through primary and secondary research. All percentage share, splits, and breakdowns have been determined using secondary sources and were verified through primary sources. The figure below shows the breakdown of profiles of industry experts who participated in the primary discussions.
To know about the assumptions considered for the study, download the pdf brochure
Key participants in the supply chain of genetically modified food safety testing are raw material suppliers, government bodies, distributors, and end users such as industries, consumers, and researchers. The major key players that are profiled in the report include Thermo Fisher Scientific, Inc. (U.S.), SGS S.A. (Switzerland), Bureau Veritas SA (France), Intertek Group Plc. (U.K.), Eurofins Scientific SE (Luxembourg), and T�V S�D AG (Germany).
This report is targeted at the existing players in the industry, which include
- Food manufacturers
- Distributors of genetically modified crops
- Genetically modified ingredient manufacturers
- Regulatory authorities
�The study answers several questions for stakeholders, primarily which market segenetically modified ents to focus on in next two to five years for prioritizing efforts and investments�.
Scope of the Report
On the basis of Trait, the GMO testing market is segmented as follows:
- Stacked
- Herbicide tolerance
- Insect resistance
On the basis of Technology, the GMO testing market is segmented as follows:
- Polymerase Chain Reaction (PCR)
- Immunoassay
On the basis of Crop Tested, the GMO testing market is segmented as follows:
- Corn
- Soy
- Rapeseed/Canola
- Potato
- Others (tomato, sugarbeet, and rice)
On the basis of Processed Food Tested, GMO testing market is segmented as follows:
- Bakery & confectionery
- Meat & meat products
- Breakfast cereals & snacks
- Food additives
- Other processed food (infant food, dairy products, and processed beverages)
On the basis of Region, the GMO testing market is segmented as follows:
- North America
- Europe
- Asia-Pacific
- RoW
Available Customizations
With the given market data, MarketsandMarkets offers customizations according to the company�s specific needs.
The following customization options are available for the report:
Regional Analysis
- Further country specific data and its regulations
Company Information
- Detailed analysis and profiling of additional market players (Up to five)
The market for GMO testing has grown exponentially in the last few years. The market size is projected to reach USD 2.34 Billion by 2022, at a CAGR of around 8.2% from 2017 to 2022. Both, developed and developing countries have been targeted for this industry as the consumer concerns toward GMOs have been revolutionizing the GMO testing technology. Need to ensure sufficient nutrition, evolution in farming technology, labeling mandates in several countries, diverse GM processed food production, and high investments in biotech R&D have been driving the market for GMO testing.
The GMO testing market, on the basis of trait, is segmented into stacked, herbicide tolerance, and insect resistance. The stacked trait testing market accounted for the largest in 2016, and is projected to be the fastest-growing in GM testing for crops and foods due to the increase in R&D innovations and multiplicity of different traits in one crop or food. Also, the expenses and the procedure associated with the testing stacked trait are higher.
The GMO testing market, on the basis of technology, is segmented into polymerase chain reaction (PCR) and immunoassay. The PCR segment accounted for the largest market in 2016, and is projected to grow at the highest CAGR from 2017 to 2022. The GMO testing market is segmented into crop and processed food tested, where the testing market for crops accounted for the largest. The crop segment is further subsegmented into corn, soy, rapeseed/canola, and potato, for which the testing for corn and soy accounted for the largest, and is projected to be the fastest-growing, as these are largely traded crops. The processed food tested segment includes bakery & confectionery, meat & meat products, breakfast cereals & snacks, food additives, and others, of which breakfast cereals & snacks is projected to be the fastest-growing market for GMO testing.
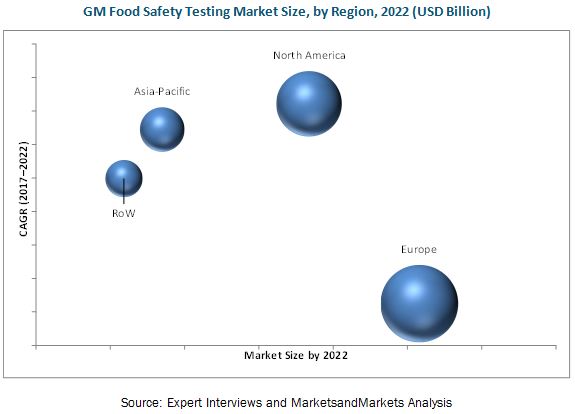
The GMO market was dominated by the European region in 2016. Stringent regulatory affairs for GMO testing and consumers� disapproval toward GM foods have been driving the market in European countries such as Germany, the U.K., Spain, and France. North America is projected to be the fastest-growing region for GM food safety testing, as it is the largest GM crops producing country, along with the need to comply with the GMO labeling regulations from importing countries. The active U.S. players in this market are Thermo Fisher Scientific, Inc. (U.S.), Bio-Rad Laboratories, Inc. (U.S.), M�rieux NutriSciences Corporation (U.S.), EMSL Analytical Inc. (U.S.), Microbac Laboratories, Inc. (U.S.), Genetic ID NA, Inc. (U.S.), and OMIC USA Inc. (U.S.)
Lack of proper implementation of regulations, lack of technical know-how among farmers, ban on the production of GM crops, and unaffordability of tests by food manufacturers & channel members are the major restraints and challenges in the GM food testing market for safety.
One of the leading players, Intertek Group Plc (U.K.), adopted acquisitions as its key strategy; it also focuses on expansions to extend its capabilities in the GMO testing market. The company has been continuously improving its products and services through new and advanced technologies to create new opportunities in food industries.
In 2016, Intertek acquired the Italian company Food International Trust (FIT-Italia), which provided a wide range of assurance, testing, and certification services. It was the first Italian company to receive ISI accreditation as an inspection body for the food sector and the first company in Italy to be accredited to deliver the International Food Standard (IFS) Food Store program. In March 2016, Eurofins Scientific invested in the expansion of its global infrastructure for advanced testing laboratories; it invested USD 800 million in 2016. Through these laboratories, the company would provide services such as food and microbiology testing.
To speak to our analyst for a discussion on the above findings, click Speak to Analyst
 Exclusive indicates content/data unique to MarketsandMarkets and not available with any competitors.
Table of Contents
1 Introduction (Page No. - 16)
1.1 Objectives of the Study
1.2 Market Definition
1.3 Market Scope
1.4 Periodization Considered for the Study
1.5 Currency
1.6 Stakeholders
2 Research Methodology (Page No. - 20)
2.1 Research Data
2.1.1 Secondary Data
2.1.1.1 Key Data From Secondary Sources
2.1.2 Primary Data
2.1.2.1 Key Data From Primary Sources
2.1.2.2 Key Industry Insights
2.1.2.3 Breakdown of Primaries
2.2 Market Size Estimation
2.3 Market Breakdown & Data Triangulation
2.4 Factor Analysis
2.4.1 Introduction
2.4.2 Demand-Side Analysis
2.4.2.1 Rise in the Number of Technical Barriers to Trade (TBT) Concerns Raised By the Wto
2.4.2.2 Labeling Mandates of GM Foods in Various Countries
2.4.3 Supply-Side Analysis
2.4.3.1 Outsourcing GMO Testing to Third-Party Laboratories
2.4.3.2 Growing Market for Food Diagnostics
2.4.3.3 Increasing Areas for GM Crop Production
2.4.3.4 Approved GM Varieties in the U.S.
2.4.3.4.1 GM Varieties, By Crop
2.5 Research Limitations
2.6 Research Assumptions
3 Executive Summary (Page No. - 35)
4 Premium Insights (Page No. - 40)
4.1 Opportunities in the GMO Testing Market
4.2 GMO Testing Market, By Key Country
4.3 GMO Testing Market, By Trait & Region
4.4 GMO Testing Market, By Technology & Region
5 Market Overview (Page No. - 44)
5.1 Introduction
5.2 Market Dynamics
5.2.1 Drivers
5.2.1.1 Need to Ensure Sufficient Nutrient Consumption
5.2.1.2 Technological Evolution of Farming Practices
5.2.1.3 Diverse Processed Foods Through GM Crops
5.2.1.4 Labeling Mandates in Several Countries
5.2.1.5 High Investment in Biotech R&D
5.2.2 Restraints
5.2.2.1 Lack of Implementation of Regulations
5.2.2.2 Lack of Required Technical Know-How Among Farmers
5.2.3 Opportunities
5.2.3.1 Emerging Markets for GMO Testing
5.2.3.2 Increasing Consumer Awareness About GM Foods
5.2.4 Challenges
5.2.4.1 Ban on the Production of GM Crops
5.2.4.2 Unaffordability of Tests By Manufacturers
5.2.4.3 Inappropriate Sample Collection Standards
5.3 Supply Chain Analysis
5.3.1 Upstream Process
5.3.1.1 Research & Development
5.3.1.2 Production
5.3.2 Midstream Process
5.3.2.1 Processing & Transformation
5.3.2.2 Transportation
5.3.3 Downstream Process
5.3.3.1 Final Preparation
5.3.3.2 Distribution
5.4 Value Chain Analysis
5.4.1 Input Market
5.4.2 Product Market
5.4.3 Distribution
5.4.4 End Market
5.5 Industry Insights
5.6 Upcoming Technologies in GMO Testing
5.6.1 PCR Capillary Gel Electrophoresis Technology
5.6.2 Digital PCR
5.6.3 Next-Generation Sequencing Technologies
5.7 Consumer Awareness About GMO
6 Regulations: GMO Testing Market (Page No. - 55)
6.1 Introduction
6.2 Cartagena Protocol
6.3 Wto Regulations
6.4 U.S.
6.5 Canada
6.6 Mexico
6.7 European Union
6.8 Japan
6.9 China
6.9.1 Responsible Agencies
6.9.2 Other GMO Provisions
6.9.3 Local Rules
6.10 Australia & New Zealand
6.11 Brazil
6.12 Russian Federation
6.12.1 Labeling Requirements in Russian Federation
6.13 Argentina
6.14 Egypt
6.15 Israel
6.16 South Africa
7 GMO Testing Market, By Trait (Page No. - 66)
7.1 Introduction
7.2 Stacked
7.3 Herbicide Tolerance
7.4 Insect Resistance
8 GMO Testing Market, By Technology (Page No. - 71)
8.1 Introduction
8.2 Polymerase Chain Reaction (PCR)
8.3 Immunoassay
9 GMO Testing Market, By Crop & Processed Food Tested (Page No. - 76)
9.1 Introduction
9.2 Crop
9.2.1 Corn
9.2.2 Soybean
9.2.3 Canola/Rapeseed
9.2.4 Potato
9.2.5 Other Crops
9.3 Processed Food
9.3.1 Bakery & Confectionery
9.3.2 Meat & Meat Products
9.3.3 Breakfast Cereals & Snacks
9.3.4 Food Additives
9.3.5 Other Processed Food
10 GMO Testing Market, By Region (Page No. - 88)
10.1 Introduction
10.2.1 Political Factors
10.2.2 Economic Factors
10.2.3 Social Factors
10.2.4 Technological Factors
10.3 North America
10.3.1 U.S.
10.3.2 Canada
10.3.3 Mexico
10.4 Europe
10.4.1 Germany
10.4.2 U.K.
10.4.3 France
10.4.4 Spain
10.4.5 Rest of Europe
10.5 Asia-Pacific
10.5.1 China
10.5.2 Japan
10.5.3 South Korea
10.5.4 Rest of Asia-Pacific
10.6 Rest of the World (RoW)
10.6.1 Brazil
10.6.2 Argentina
10.6.3 Others in RoW
11 Competitive Landscape (Page No. - 116)
11.1 Introduction
11.2 Competitive Leadership Mapping
11.2.1 Visionary Leaders
11.2.2 Innovators
11.2.3 Dynamic Differentiators
11.2.4 Emerging Companies
11.3 Competitive Benchmarking
11.3.1 Product Offering Scorecard (For 23 Companies)
11.3.2 Business Strategy Scorecard (For 23 Companies)
12 Company Profiles (Page No. - 120)
(Overview, Products & Services, Strategies & Insights, Developments and MnM View)*
12.1 Introduction
12.2 Thermo Fisher Scientific, Inc.
12.3 SGS S.A.
12.4 Bureau Veritas Sa
12.5 Intertek Group PLC
12.6 Eurofins Scientific Se
12.7 T�v S�d AG
12.8 Bio-Rad Laboratories, Inc.
12.9 ALS Limited
12.10 M�rieux Nutrisciences Corporation
12.11 Asurequality
12.12 Romer Labs Diagnostic GmbH
12.13 Microbac Laboratories, Inc.
"* The companies listed are a representative sample of the market�s ecosystem and in no particular order"
*Details on Overview, Products & Services, Strategies & Insights, Developments and MnM View Might Not Be Captured in Case of Unlisted Companies.
13 Appendix (Page No. - 161)
13.1 Discussion Guide
13.2 More Company Developments
13.2.1 Expansions & Investments
13.2.2 Acquisitions
13.2.3 New Product, Service, and Technology Launches
13.2.4 Agreements, Collaborations, and Partnerships
13.3 Introducing RT: Real-Time Market Intelligence
13.4 Available Customizations
13.5 Related Reports
13.6 Author Details
List of Tables (75 Tables)
Table 1 Labeling Requirements in Different Countries
Table 2 Area Under GM Crops, By Country
Table 3 GMO Testing Market Size, By Trait, 2015�2022 (USD Million)
Table 4 Stacked Traits Testing Market Size, By Region, 2015�2022 (USD Million)
Table 5 Herbicide Tolerance Testing Market Size, By Region, 2015�2022 (USD Million)
Table 6 Insect Resistance Testing Market Size, By Region, 2015�2022 (USD Million)
Table 7 GMO Testing Market Size, By Technology, 2015�2022 (USD Million)
Table 8 PCR: GMO Testing Market Size, 2015�2022 (USD Million)
Table 9 Immunoassay: GMO Testing Market Size, 2015�2022 (USD Million)
Table 10 GMO Testing Market Size, By Crop & Processed Food Tested, 2015�2022 (USD Million)
Table 11 GMO Testing Market Size, By Crop Tested, 2015�2022 (USD Million)
Table 12 Crop Tested: GMO Testing Market Size, By Region, 2015�2022 (USD Million)
Table 13 Corn: GMO Testing Market Size, By Region, 2015�2022 (USD Million)
Table 14 Soybean: GMO Testing Market Size, By Region, 2015�2022 (USD Million)
Table 15 Canola/Rapeseed: GMO Testing Market Size, By Region, 2015�2022 (USD Million)
Table 16 Potato: GMO Testing Market Size, By Region, 2015�2022 (USD Million)
Table 17 Other Crops: GMO Testing Market Size, By Region, 2015�2022 (USD Million)
Table 18 GMO Testing Market Size, By Processed Food Tested, 2015�2022 (USD Million)
Table 19 GMO Testing Market Size in Processed Food, By Region, 2015�2022 (USD Million)
Table 20 GMO Testing Market Size in Bakery & Confectionery, By Region, 2015�2022 (USD Million)
Table 21 GMO Testing Market Size in Meat & Meat Products, By Region, 2015�2022 (USD Million)
Table 22 GMO Testing Market Size in Breakfast Cereals & Snacks, By Region, 2015�2022 (USD Million)
Table 23 GMO Testing Market Size in Food Additives, By Region, 2015�2022 (USD Million)
Table 24 GMO Testing Market Size in Other Processed Food, By Region, 2015�2022 (USD Million)
Table 25 GMO Testing Market Size, By Region, 2015�2022 (USD Million)
Table 26 North America: GMO Testing Market Size, By Country, 2015�2022 (USD Million)
Table 27 North America: GMO Testing Market Size, By Trait, 2015�2022 (USD Million)
Table 28 North America: GMO Testing Market Size, By Technology, 2015�2022 (USD Million)
Table 29 North America: GMO Testing Market Size, By Crop & Processed Food Tested, 2015�2022 (USD Million)
Table 30 U.S.: GMO Testing Market Size, By Trait, 2015�2022 (USD Million)
Table 31 U.S.: GMO Testing Market Size, By Technology, 2015�2022 (USD Million)
Table 32 Canada: GMO Testing Market Size, By Trait, 2015�2022 (USD Million)
Table 33 Canada: GMO Testing Market Size, By Technology, 2015�2022 (USD Million)
Table 34 Mexico: GMO Testing Market Size, By Trait, 2015�2022 (USD Million)
Table 35 Mexico: GMO Testing Market Size, By Technology, 2015�2022 (USD Million)
Table 36 Europe: GMO Testing Market Size, By Country, 2015�2022 (USD Million)
Table 37 Europe: GMO Testing Market Size, By Trait, 2015�2022 (USD Million)
Table 38 Europe: GMO Testing Market Size, By Technology, 2015�2022 (USD Million)
Table 39 Europe: GMO Testing Market Size, By Crop & Processed Food Tested, 2015�2022 (USD Million)
Table 40 Germany: GMO Testing Market Size, By Trait, 2015�2022 (USD Million)
Table 41 Germany: GMO Testing Market Size, By Technology, 2015�2022 (USD Million)
Table 42 U.K.: GMO Testing Market Size, By Trait, 2015�2022 (USD Million)
Table 43 U.K.: GMO Testing Market Size, By Technology, 2015�2022 (USD Million)
Table 44 France: GMO Testing Market Size, By Trait, 2015�2022 (USD Million)
Table 45 France: GMO Testing Market Size, By Technology, 2015�2022 (USD Million)
Table 46 Spain: GMO Testing Market Size, By Trait, 2015�2022 (USD Million)
Table 47 Spain: GMO Testing Market Size, By Technology, 2015�2022 (USD Million)
Table 48 Rest of Europe: GMO Testing Market Size, By Trait, 2015�2022 (USD Million)
Table 49 Rest of Europe: GMO Testing Market Size, By Technology, 2015�2022 (USD Million)
Table 50 Asia-Pacific: GMO Testing Market Size, By Country, 2015�2022 (USD Million)
Table 51 Asia-Pacific: GMO Testing Market Size, By Trait, 2015�2022 (USD Million)
Table 52 Asia-Pacific: GMO Testing Market Size, By Technology, 2015�2022 (USD Million)
Table 53 Asia-Pacific: GMO Testing Market Size, By Crop & Processed Food Tested, 2015�2022 (USD Million)
Table 54 China: GMO Testing Market Size, By Trait, 2015�2022 (USD Million)
Table 55 China: GMO Testing Market Size, By Technology, 2015�2022 (USD Million)
Table 56 Japan: GMO Testing Market Size, By Trait, 2015�2022 (USD Million)
Table 57 Japan: GMO Testing Market Size, By Technology, 2015�2022 (USD Million)
Table 58 South Korea: GMO Testing Market Size, By Trait, 2015�2022 (USD Million)
Table 59 South Korea: GMO Testing Market Size, By Technology, 2015�2022 (USD Million)
Table 60 Rest of Asia-Pacific: GMO Testing Market Size, By Trait, 2015�2022 (USD Million)
Table 61 Rest of Asia-Pacific: GMO Testing Market Size, By Technology, 2015�2022 (USD Million)
Table 62 RoW: GMO Testing Market Size, By Country, 2015�2022 (USD Million)
Table 63 RoW: GMO Testing Market Size, By Trait, 2015�2022 (USD Million)
Table 64 RoW: GMO Testing Market Size, By Technology, 2015�2022 (USD Million)
Table 65 RoW: GMO Testing Market Size, By Crop & Processed Food Tested, 2015�2022 (USD Million)
Table 66 Brazil: GMO Testing Market Size, By Trait, 2015�2022 (USD Million)
Table 67 Brazil: GMO Testing Market Size, By Technology, 2015�2022 (USD Million)
Table 68 Argentina: GMO Testing Market Size, By Trait, 2015�2022 (USD Million)
Table 69 Argentina: GMO Testing Market Size, By Technology, 2015�2022 (USD Million)
Table 70 Others in RoW: GMO Testing Market Size, By Trait, 2015�2022 (USD Million)
Table 71 Others in RoW: GMO Testing Market Size, By Technology, 2015�2022 (USD Million)
Table 72 Expansions & Investments, 2012�2017
Table 73 Acquisitions, 2012�2017
Table 74 New Product, Service, and Technology Launches, 2012�2017
Table 75 Agreements, Collaborations, and Partnerships, 2012�2017
List of Figures (50 Figures)
Figure 1 Market Snapshot: GMO Testing Market
Figure 2 Regional Scope: GMO Testing Market
Figure 3 Research Design: GMO Testing
Figure 4 Breakdown of Primaries: By Company, Designation, and Region
Figure 5 Market Size Estimation Methodology: Bottom-Up Approach
Figure 6 Market Size Estimation Methodology: Top-Down Approach
Figure 7 Data Triangulation Methodology
Figure 8 TBT-Specific Trade Concerns From 2010�2014
Figure 9 Global GM Food Labeling
Figure 10 Global Food Diagnostics Market Size, 2012�2016 (USD Million)
Figure 11 Global Area of GM Crops, 2001�2014 (Million Hectares)
Figure 12 Approved GM Crops in the U.S.
Figure 13 GMO Testing Market Snapshot, By Trait, 2017 vs 2022 (USD Million)
Figure 14 North America to Be the Fastest-Growing Market for GMO Testing, 2017�2022
Figure 15 GMO Testing Market Size, By Technology, 2017 vs 2022 (USD Million)
Figure 16 GMO Testing Market Size, By Crop & Food Tested, 2017 vs 2022 (USD Million)
Figure 17 GMO Testing Market Share (Value), By Region
Figure 18 Evolution in Farming Technology to Drive the Growth of the GMO Testing Market
Figure 19 China Projected to Be the Fastest-Growing Market From 2017 to 2022
Figure 20 Stacked Trait Segment Dominated the Market in 2016
Figure 21 Europe Dominated the GMO Testing Market, By Technology, in 2016
Figure 22 European GMO Testing Market, By Crop & Processed Food Tested, 2016 (USD Million)
Figure 23 High Usage of GMO in Processed Foods Drives the GMO Testing Market
Figure 24 U.S. Venture Investment in Biotechnology (2005�2011)
Figure 25 Supply Chain Analysis: GMO Testing Market
Figure 26 Value Chain Analysis: GMO Testing Market
Figure 27 GMO Labeling Mandates: Changing the Scope for the GMO Testing Market
Figure 28 U.S. Survey: Support for FDA Labeling Policy (2014)
Figure 29 U.S. Survey: Impression of Consumers on Biotech Usage for Food (2014)
Figure 30 Global Revenue Generated By the Sales of Genetically Modified Seeds, 1996-2012 (USD Billion)
Figure 31 GMO Testing Market Size, By Trait, 2017 & 2022 (USD Million)
Figure 32 Stacked Traits: GMO Testing Market Size, By Region, 2015�2022 (USD Million)
Figure 33 GMO Testing Market Size, By Technology, 2017 vs 2022 (USD Million)
Figure 34 PCR: GMO Testing Market Size, By Region, 2017 vs 2022 (USD Million)
Figure 35 Crop Segment is Projected to Dominate the Market Through 2022
Figure 36 GMO Testing Market Size, By Crop Tested, 2017 vs 2022 (USD Million)
Figure 37 U.S. Accounted for the Largest Share in the Genetically Modified Food Safety Testing Market
Figure 38 North American GMO Testing Market Snapshot
Figure 39 Europe: GMO Testing Market Snapshot
Figure 40 Asia-Pacific: GMO Testing Market Snapshot
Figure 41 GMO Testing Market (Global): Competitive Leadership Mapping, 2017
Figure 42 Thermo Fisher Scientific, Inc.: Company Snapshot
Figure 43 SGS S.A.: Company Snapshot
Figure 44 Bureau Veritas Sa: Company Snapshot
Figure 45 Intertek Group PLC.: Company Snapshot
Figure 46 Eurofins Scientific Se: Company Snapshot
Figure 47 T�v S�d AG: Company Snapshot
Figure 48 Bio-Rad Laboratories, Inc.: Company Snapshot
Figure 49 ALS Limited: Company Snapshot
Figure 50 Asurequality: Company Snapshot


Growth opportunities and latent adjacency in GMO Testing Market