Frozen Bakery Additives Market by Types (Color & Flavor, Preservative, Oxidizing Agent, Reducing Agent, Enzyme, Emulsifier, Others), Applications (Frozen Bread, Cake, Pastry, Pizza Crust, Others) & Geography - Global Trends & Forecasts to 2018


The global frozen bakery additives market is growing at a very rapid pace. Additives such as preservatives, antioxidants, emulsifiers & stabilizers, colors, and flavor enhancers have attracted attention over the years.
This report provides a study on the global frozen bakery additive market. This research report categorizes the global market based on types, applications, and geography. It estimates demand for frozen bakery additive in global as well as different regional markets. Market revenues have also been identified for all regional markets and segmented on the basis of product types and applications.
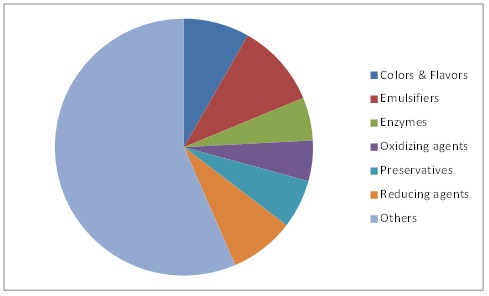
This report provides a comprehensive analysis of the global market, which is witnessing steady growth because of its diverse product portfolio. Frozen bakery additives such as colors & flavors, emulsifiers, enzymes, oxidizing agents, reducing agents, and other additives have been identified in the report. Other additives comprise of the largest share of the frozen bakery additive market. In addition, emulsifiers also account for the second-largest share of the market due to its function of increasing shelf life and improving the structure of the products.
This report describes the frozen bakery additives market across the globe. The regions covered include North America (U.S., Canada, and Mexico), Europe (U.K., Germany, France, Italy, Spain, Russia, etc.), Asia-Pacific (China, Japan, Australia, etc.), and Rest of the World (Brazil, South Africa, etc.). The growth strategies of the market players have been identified and analyzed. The manufacturers are keenly aware of the emerging Asian and Latin American markets as potential drivers of the frozen bakery additive business. The market is predicted to continue flourishing in both developed and developing regions. The growth is also attributed to the growing demand for healthy and nutritious frozen bakery products and increase in the demand for processed food. U.S. is one of the largest players in the frozen bakery additive business.
Frozen Bakery Additives Market Value, By Geography, 2011-2018 ($Million)
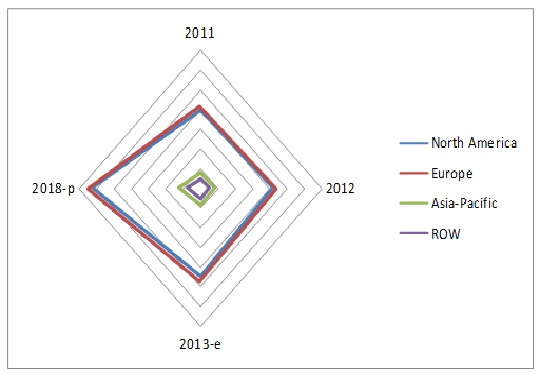
Source: Expert Interviews, Government Authorities, Related Associations/Institutes, Related Research Publication, Government Publication, Company Press Release, Company Annual Report, Company Website, Company Publication, and MarketsandMarkets Analysis
Europe is the largest market for frozen bakery additives followed by North America and Asia-Pacific. The European market is estimated to grow at a CAGR of 6.6% from 2013 to 2018. Asia-Pacific represents the fastest growing market followed by ROW.
Scope of the report
This report focuses on the frozen bakery additive market. This research categorizes the global market based on geography, types, and applications.
Based on geography:
- North America
- Europe
- Asia-Pacific
- ROW
Based on types:
- Colors and Flavors
- Preservatives
- Oxidizing agents
- Reducing agents
- Enzymes
- Emulsifiers
- Others
Based on applications:
- Breads
- Pizza crusts
- Pastries
- Cakes
- Others
The global frozen bakery additives market has been on a higher growth trajectory for the last few years. The role of food additives in food processing has been very important over the years. There are a number of classes of additives which include preservatives, antioxidants, emulsifiers, stabilizers, thickeners, flavor enhancers, sweeteners, colors, etc. It would be impossible without food additives for the food manufacturing industry to provide a wide range of safe, wholesome, nutritious, and attractive products at affordable prices all year round in order to meet consumer requirements for quality, convenience, and variety. They are essential in the batteries of tools used by the food manufacturer to convert agricultural raw materials into products that are safe, stable, of consistent quality, and readily prepared and consumed. Different types of additives are used for the frozen bakery industry, though many individual additives perform more than one function. For the purpose of both classification and regulation, they are grouped according to their primary function.
The world is witnessing an increase in the number of bakery additives businesses, with consumers opting for the more reasonably priced frozen bakery products. Hence, the frozen bakery additives market is also growing. Since additives are used for one or more functions, they are an important part of the bakery industry. For example, lecithin is used in frozen bakery as an emulsifier or a stabilizing agent. Similarly, different acids act as preservatives and antioxidants. For example, lactic acid found in milk and milk products is used in the frozen bakery industry for increasing the shelf life and flavor of the product. The growth of this market segment banks on the consumer�s preference of frozen bakery products. This growth will be maintained in the future with an opportunity to produce new specialty bakery additives with plenty of innovations for health-conscious consumers which will provide nutritive value as well.
Types of Frozen Bakery Additives
Source: Expert Interviews, Government Authorities, Related Research Publication, Government Publication, Company Press Release, Company Annual Report, Company Website, Company Publication, and MarketsandMarkets Analysis
Emulsifiers comprise of important share of the total frozen bakery additive market. Other frozen bakery additives account for largest share of the total market.
Frozen Bakery Additive Market Value, By Geography, 2012 ($Million)
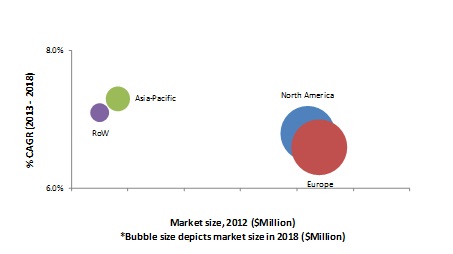
Source: Expert Interviews, Government Authorities, Related Research Publication, Government Publication, Company Press Release, Company Annual Report, Company Website, Company Publication, and MarketsandMarkets Analysis
Europe forms the largest segment of the frozen bakery additives market in 2012. It is poised to grow at a steady CAGR of 6.8% over the forecast period. North America is estimated to be the second-largest market due to increase in demand for processed food. Asia-Pacific is projected to gain the fastest growth of 7.3% during the concerned period.
 Exclusive indicates content/data unique to MarketsandMarkets and not available with any competitors.
Table Of Contents
1 Introduction (Page No. - 18)
1.1 Key Take-Aways
1.2 Analyst Insight
1.3 Report Description
1.4 Market Segments Covered
1.5 Stakeholders
1.6 Report Assumptions
1.6.1 General Assumptions
1.6.2 Year-Wise & Forecast Assumptions
1.7 Research Methodology
1.7.1 Market Size Estimation
1.7.2 Market Crackdown & Data Triangulation
1.7.3 Secondary Sources
1.7.4 Key Data Points Taken From Primary & Secondary Sources
1.7.5 Key Companies of Primary Research
1.7.6 Key Questions Answered
2 Executive Summary (Page No. - 28)
3 Market Overview (Page No. - 31)
3.1 Introduction
3.2 History & Evolution
3.3 Market Statistics
3.3.1 Frozen Bakery Additives Market
3.3.2 Total Addressable Market
3.3.3 Related Market
3.3.3.1 Bakery Additives Market
4 Industry Analysis (Page No. - 35)
4.1 Introduction
4.2 Supply Chain Analysis
4.3 Market Share Analysis
5 Market Analysis (Page No. - 38)
5.1 Introduction
5.2 Market Dynamics
5.2.1 Market Drivers
5.2.1.1 Environment Friendly Manufacturing Process
5.2.1.2 Improving Product Quality
5.2.1.3 Increasing Demand for Processed Food
5.2.1.4 Waste Reduction and Energy Savings in Food Processing
5.2.2 Market Restraints
5.2.2.1 Restricted Temperature and Ph Operational Range
5.2.2.2 Consolidated Market of Frozen Bakery
5.2.3 Market Opportunities
5.2.3.1 Emerging Applications in Bakery
5.2.3.2 innovative Technological Platforms
5.3 Burning Issue
5.3.1 Change in Food & Beverage Enzyme Safety Legislations in Europe
5.3.1.1 Characteristics Restrict Applicability
5.4 Winning Imperative
5.4.1 New Product Launches
5.5 Impact Analysis
5.6 Porter�s Five forces Analysis
5.6.1 Bargaining Power of Suppliers
5.6.2 Bargaining Power of Buyers
5.6.3 Threat of New Entrants
5.6.4 Threat of Substitutes
5.6.5 Degree of Competition
6 Frozen Bakery Additives Market, By Type (Page No. - 50)
6.1 introduction
6.2 Colors & Flavors
6.3 Emulsifiers
6.3.1 Key Features
6.3.1.1 Awareness About Impact of Low Fat Food on Health Creates Demand
6.3.2 Mono & Di-Glyceride
6.3.3 Lecithin
6.3.4 Others
6.4 Enzymes
6.5 Oxidizing Agents
6.6 Preservatives
6.7 Reducing Agents
6.7.1 Ascorbic Acid
6.7.2 L-Cysteine
6.7.3 Sorbic Acid
6.7.4 Others
6.8 Other Additives
7 Frozen Bakery Additive Market, By Application (Page No. - 94)
7.1 Introduction
7.2 Frozen Breads
7.3 Frozen Cakes
7.4 Frozen Pastry
7.5 Frozen Pizza Crust
7.6 Other Frozen Bakery Products
8 Frozen Bakery Additives Market, By Geography (Page No. - 135)
8.1 Introduction
8.2 North America
8.3 Europe
8.4 Asia-Pacific
8.5 Rest of the World
9 Competitive Landscape (Page No. - 168)
9.1 Introduction
9.2 Most Preferred Strategy - New Product Launch/Development
9.3 Mergers & Acquisitions
9.4 Agreements, Partnerships, Collaborations & Joint Ventures
9.5 New Product Launches/Developments
9.6 Expansions & Investments
10 Company Profiles (Overview, Financial*, Products & Services, Strategy, and Developments) (Page No. - 182)
10.1 Ab Nordbakels
10.2 Associated British Foods Plc
10.3 Archer Daniels Midland Co.
10.4 Cargill Inc.
10.5 Ddw-the Color House
10.6 David Michael & Co.
10.7 E.I. Dupont De Nemours & Company
10.8 Engrain
10.9 Jungbunzlauer AG
10.10 Kerry Group
10.11 Lasenor Emul S.L.
10.12 Lonza Group Ltd.
10.13 Novozymes A/S
10.14 Palsgaard A/S
10.15 Purac Biochem B.V.
10.16 Puratos Group N.V.
10.17 Royal Dsm N.V.
10.18 Riken Vitamin Co. Ltd.
10.19 Shenzhen Leveking Bio-Engineering Co. Ltd.
10.20 Sensient Technologies Corp.
*Details Might Not Be Captured in Case of Unlisted Companies.
List Of Tables (131 Tables)
Table 1 Frozen Bakery Additives Market Value, By Geography, 2011-2018
Table 2 Market Value, By Type, 2011-2018 ($Million)
Table 3 Frozen Bakery Additives Market Volume, By Type, 2011-2018 (KT)
Table 4 Frozen Bakery Colors and Flavors Market Value, By Application, 2011-2018 ($Million)
Table 5 Frozen Bakery Colors and Flavors Market Volume, By Application, 2011-2018 (KT)
Table 6 Frozen Bakery Emulsifiers Market Value, By Application, 2011-2018 ($Million)
Table 7 Frozen Bakery Emulsifiers Market Volume, By Application, 2011-2018 (KT)
Table 8 Frozen Bakery Emulsifier Market Value, By Sub-Type, 2011-2018 ($Million)
Table 9 Frozen Bakery Emulsifier Market Volume, By Sub-Type, 2011-2018 (KT)
Table 10 Frozen Bread Emulsifier Market Value, By Sub-Type, 2011-2018 ($Million)
Table 11 Frozen Bread Emulsifier Market Volume, By Sub-Type, 2011-2018 (KT)
Table 12 Frozen Pizza Crust Emulsifier Market Value, By Sub-Types, 2011-2018 ($Million)
Table 13 Frozen Pizza Crust Emulsifier Market Volume, By Sub-Types, 2011-2018 (KT)
Table 14 Frozen Pastry & Cake Emulsifier Market Value, By Sub-Type, 2011-2018 ($Million)
Table 15 Frozen Pastry & Cake Emulsifier Market Volume, By Sub-Type, 2011-2018 (KT)
Table 16 Other Frozen Bakery Products Emulsifier Market Value, By Sub-Type, 2011-2018 ($Million)
Table 17 Other Frozen Bakery Products Emulsifier Market Volume, By Sub-Type, 2011-2018 (KT)
Table 18 Frozen Bakery: Enzymes & Their Functions
Table 19 Frozen Bakery Enzymes Market Value, By Application, 2011-2018 ($Million)
Table 20 Frozen Bakery Enzymes Market Volume, By Application, 2011-2018 (KT)
Table 21 Frozen Bakery Oxidizing Agents Market Value, By Application, 2011-2018 ($Million)
Table 22 Frozen Bakery Oxidizing Agents Market Volume, By Application, 2011-2018 (KT)
Table 23 Frozen Bakery Preservatives Market Value, By Application, 2011-2018 ($Million)
Table 24 Frozen Bakery Preservatives Market Volume, By Application, 2011-2018 (KT)
Table 25 Frozen Bakery Reducing Agents Market Value, By Application, 2011-2018 ($Million)
Table 26 Frozen Bakery Reducing Agents Market Volume, By Application, 2011-2018 (KT)
Table 27 Frozen Bakery Reducing Agents Market Value, By Sub-Type, 2011-2018 ($Million)
Table 28 Frozen Bakery Reducing Agents Market Volume, By Sub-Type, 2011-2018 (KT)
Table 29 Frozen Bread Reducing Agents Market Value, By Sub-Type, 2011-2018 ($Million)
Table 30 Frozen Bread Reducing Agents Market Volume, By Sub-Type, 2011-2018 (KT)
Table 31 Frozen Pizza Crust Reducing Agents Market Value, By Sub-Type, 2011-2018 ($Million)
Table 32 Frozen Pizza Crust Reducing Agents Market Volume, By Sub-Type, 2011-2018 (KT)
Table 33 Frozen Pastry & Cake Reducing Agents Market Value, By Sub-Type, 2011-2018 ($Million)
Table 34 Frozen Pastry & Cake Reducing Agents Market Volume, By Sub-Type, 2011-2018 (KT)
Table 35 Other Frozen Bakery Products Reducing Agents Market Value, By Sub-Type, 2011-2018 ($Million)
Table 36 Other Frozen Bakery Products Reducing Agents Market Volume, By Sub-Type, 2011-2018 (KT)
Table 37 Frozen Bakery Other Additives Market Value, By Application, 2011-2018 ($Million)
Table 38 Frozen Bakery Other Additives Market Volume, By Application, 2011-2018 (KT)
Table 39 Frozen Bakery Additives Market Value, By Application, 2011-2018 ($Million)
Table 40 Market Volume, By Application, 2011-2018 (KT)
Table 41 Frozen Breads Additives Market Value, By Geography, 2011-2018 ($Million)
Table 42 Frozen Breads Additives Market Value, By Sub-Application, 2011-2018 ($Million)
Table 43 North America: Frozen Breads Additives, Market Value, By Country, 2011-2018 ($Million)
Table 44 North America: Frozen Breads Additives, Market Value, By Sub-Application, 2011-2018 ($Million)
Table 45 Europe: Frozen Breads Additives, Market Value, By Country, 2011-2018 ($Million)
Table 46 Europe: Frozen Breads Additives, Market Value, By Sub-Application, 2011-2018 ($Million)
Table 47 Asia-Pacific: Frozen Breads Additives, Market Value, By Country, 2011-2018 ($Million)
Table 48 ROW: Frozen Breads Additives, Market Value, By Country, 2011-2018 ($Million)
Table 49 Frozen Cake Additives Market Value, By Geography, 2011-2018 ($Million)
Table 50 Frozen Cake Additives Market Value, By Sub-Application, 2011-2018 ($Million)
Table 51 North America: Frozen Cake Additives, Market Value, By Country, 2011-2018 ($Million)
Table 52 North America: Frozen Cake Additives, Market Value, By Sub-Application, 2011-2018 ($Million)
Table 53 Europe: Frozen Cake Additives, Market Value, By Country, 2011-2018 ($Million)
Table 54 Europe: Frozen Cake Additives, Market Value, By Sub-Application, 2011-2018 ($Million)
Table 55 Asia-Pacific: Frozen Cake Additives, Market Value, By Country, 2011-2018 ($Million)
Table 56 ROW: Frozen Cake Additives, Market Value, By Country, 2011-2018 ($Million)
Table 57 Frozen Pastry Additives Market Value, By Geography, 2011-2018 ($Million)
Table 58 Frozen Pastry Additives Market Value, By Sub-Application, 2011-2018 ($Million)
Table 59 North America: Frozen Pastry Additives, Market Value, By Country, 2011-2018 ($Million)
Table 60 North America: Frozen Pastry Additives, Market Value, By Sub-Application, 2011-2018 ($Million)
Table 61 Europe: Frozen Pastry Additives, Market Value, By Country, 2011-2018 ($Million)
Table 62 Europe: Frozen Pastry Additives, Market Value, By Sub-Application, 2011-2018 ($Million)
Table 63 Asia-Pacific: Frozen Pastry Additives, Market Value, By Country, 2011-2018 ($Million)
Table 64 ROW: Frozen Pastry Additives, Market Value, By Country, 2011-2018 ($Million)
Table 65 Frozen Pizza Crust Additives Market Value, By Geography, 2011-2018 ($Million)
Table 66 North America: Frozen Pizza Crust Additives, Market Value, By Country, 2011-2018 ($Million)
Table 67 Europe: Frozen Pizza Crust Additives, Market Value, By Country, 2011-2018 ($Million)
Table 68 Asia-Pacific: Frozen Pizza Crust Additives, Market Value, By Country, 2011-2018 ($Million)
Table 69 ROW: Frozen Pizza Crust Additives, Market Value, By Country, 2011-2018 ($Million)
Table 70 Other Frozen Bakery Product Additives Market Value, By Geography, 2011-2018 ($Million)
Table 71 Other Frozen Bakery Product Additives: Market Value, By Sub-Application, 2011-2018 ($Million)
Table 72 North America: Other Frozen Bakery Product Additives, Market Value, By Country, 2011-2018 ($Million)
Table 73 North America: Other Frozen Bakery Product Additives, Market Value, By Sub-Application, 2011-2018 ($Million)
Table 74 Europe: Other Frozen Bakery Product Additives, Market Value, By Country, 2011-2018 ($Million)
Table 75 Europe: Other Frozen Bakery Product Additives, Market Value, By Sub-Application, 2011-2018 ($Million)
Table 76 Asia-Pacific: Other Frozen Bakery Product Additives, Market Value, By Country, 2011-2018 ($Million)
Table 77 ROW: Other Frozen Bakery Product Additives, Market Value, By Country, 2011-2018 ($Million)
Table 78 Frozen Bakery Additives Market Value, By Geography, 2011-2018 ($Million)
Table 79 Frozen Bakery Additive Market Volume, By Geography, 2011-2018 (KT)
Table 80 North America: Frozen Bakery Additive Market Value, By Country, 2011-2018 ($Million)
Table 81 North America: Frozen Bakery Market Volume, By Country, 2011-2018 (KT)
Table 82 North America: Frozen Bakery Additives Market Value, By Application, 2011-2018 ($Million)
Table 83 U.S.: Frozen Bakery Additives Market Value, By Application, 2011-2018 ($Million)
Table 84 Canada: Frozen Bakery Additives Market Value, By Application, 2011-2018 ($Million)
Table 85 Mexico: Frozen Bakery Additives Market Value, By Application, 2011-2018 ($Million)
Table 86 Europe: Frozen Bakery Additives Market Value, By Country, 2011-2018 ($Million)
Table 87 Europe: Frozen Bakery Market Volume, By Country, 2011-2018 (KT)
Table 88 Europe: Frozen Bakery Additives Market Value, By Application, 2011-2018 ($Million)
Table 89 France: Frozen Bakery Additives Market Value, By Application, 2011-2018 ($Million)
Table 90 Germany: Frozen Bakery Additives Market Value, By Application, 2011-2018 ($Million)
Table 91 Italy: Frozen Bakery Additives Market Value, By Application, 2011-2018 ($Million)
Table 92 Russia: Frozen Bakery Additives Market Value, By Application, 2011-2018 ($Million)
Table 93 Spain: Frozen Bakery Additive Market Value, By Application, 2011-2018 ($Million)
Table 94 U.K.: Frozen Bakery Additive Market Value, By Application, 2011-2018 ($Million)
Table 95 Others: Frozen Bakery Additive Market Value, By Application, 2011-2018 ($Million)
Table 96 Asia-Pacific: Frozen Bakery Additive Market Value, By Country, 2011-2018 ($Million)
Table 97 Asia-Pacific: Market Volume, By Country, 2011-2018 (KT)
Table 98 Asia-Pacific: Market Value, By Application, 2011-2018 ($Million)
Table 99 Australia: Frozen Bakery Additive Market Value, By Application, 2011-2018 ($Million)
Table 100 China: Frozen Bakery Additives Market Value, By Application, 2011-2018 ($Million)
Table 101 Japan: Frozen Bakery Additives Market Value, By Application, 2011-2018 ($Million)
Table 102 Others: Frozen Bakery Additives Market Value, By Application, 2011-2018 ($Million)
Table 103 ROW: Frozen Bakery Additive Market Value, By Country, 2011-2018 ($Million)
Table 104 ROW: Frozen Bakery Market Volume, By Country, 2011-2018 (KT)
Table 105 ROW: Frozen Bakery Additives Market Value, By Application, 2011-2018 ($Million)
Table 106 Brazil: Frozen Bakery Additives Market Value, By Application, 2011-2018 ($Million)
Table 107 South Africa: Frozen Bakery Additives Market Value, By Application, 2011-2018 ($Million)
Table 108 Others: Frozen Bakery Additive Market Value, By Application, 2011-2018 ($Million)
Table 109 Mergers & Acquisitions, 2011-2013
Table 110 Agreements, Partnerships, Collaborations & Joint Ventures, 2010-2013
Table 111 New Product Launches/Developments, 2010-2013
Table 112 Expansions & investments, 2010-2013
Table 113 AB Nordbakels: Products & Their Descriptions
Table 114 Associated British Foods PLC: Products & Their Descriptions
Table 115 Archer Daniels Midland Co.: Products & Their Descriptions
Table 116 Cargill Inc.: Products & Their Descriptions
Table 117 DDW: Products & Their Descriptions
Table 118 David Michael & Co.: Products & Their Descriptions
Table 119 E.I. Dupont DE Nemours & Company: Products & Their Descriptions
Table 120 Engrain: Products & Their Descriptions
Table 121 Jungbunzlauer AG: Products & Their Descriptions
Table 122 Kerry Group: Products & Their Descriptions
Table 123 Lasenor Emul S.L.: Products & Their Descriptions
Table 124 Lonza Group Ltd.: Products & Their Descriptions
Table 125 Novozymes A/S: Products & Their Descriptions
Table 126 Palsgaard A/S: Products & Their Descriptions
Table 127 Purac Biochem B.V.: Products & Their Descriptions
Table 128 Puratos Group N.V.: Products & Their Descriptions
Table 129 Royal Dsm N.V.: Products & Their Descriptions
Table 130 Riken Vitamin Co. Ltd.: Products & Their Descriptions
Table 131 Shenzhen Leveking Bio-Engineering Co. Ltd.: Products & Their Descriptions
List Of Figures (19 Figures)
Figure 1 Research Methodology
Figure 2 Market Size Estimation Methodology
Figure 3 Data Triangulation Methodology
Figure 4 Frozen Bakery Additives: Market Size, By Geography, 2012 ($Million)
Figure 5 Frozen Bakery Additives: Market Segmentation, By Type
Figure 6 Frozen Bakery Additives: Supply Chain Analysis
Figure 7 Market Share Analysis
Figure 8 Market Dynamics
Figure 9 New Product Launches
Figure 10 Impact Analysis
Figure 11 Porter�s Analysis
Figure 12 Frozen Bakery Additives: Market Size, By Application, 2012 ($Million)
Figure 13 Market Size, By Geography, 2012-2018 ($Million)
Figure 14 Market Share, By Growth Strategy, 2010-2013
Figure 15 Frozen Bakery Additives: Market Developments, By Growth Strategy, 2010-2013
Figure 16 Market Developments, By Company, 2010-2013
Figure 17 Archer Daniels Midland Co.: SWOT Analysis
Figure 18 Cargill Inc.: SWOT Analysis
Figure 19 Jungbunzlauer AG: SWOT Analysis


Growth opportunities and latent adjacency in Frozen Bakery Additives Market