The study involved significant activities to estimate the current size of the Healthcare EDI market. Exhaustive secondary research was done to collect information on the healthcare EDI market. The next step was to validate these findings, assumptions, and sizing with industry experts across the value chain using primary research. Different approaches, such as top-down and bottom-up, were employed to estimate the total market size. After that, the market breakup and data triangulation procedures were used to estimate the market size of the segments and subsegments of the healthcare EDI market.
Secondary Research
This research study involved the wide use of secondary sources, directories, and databases such as Dun & Bradstreet, Bloomberg Businessweek, and Factiva; white papers, annual reports, and companies’ house documents; investor presentations; and the SEC filings of companies. The market for the companies offering healthcare EDI solutions is arrived at by secondary data available through paid and unpaid sources, analyzing the product portfolios of the major companies in the ecosystem, and rating the companies by their performance and quality. Various sources were referred to in the secondary research process to identify and collect information for this study. The secondary sources include annual reports, press releases, investor presentations of companies, white papers, journals, certified publications, and articles from recognized authors, directories, and databases.
Various secondary sources were referred to in the secondary research process to identify and collect information related to the study. These sources included annual reports, press releases, investor presentations of healthcare EDI vendors, forums, certified publications, and whitepapers. The secondary research was used to obtain critical information on the industry’s value chain, the total pool of key players, market classification, and segmentation from the market and technology-oriented perspectives.
Primary Research
In the primary research process, various primary sources from both the supply and demand sides were interviewed to obtain qualitative and quantitative information for this report. The primary sources from the supply side included industry experts, such as Chief Executive Officers (CEOs), Vice Presidents (VPs), marketing directors, technology and innovation directors, and related key executives from various key companies and organizations operating in the healthcare EDI market.
After the complete market engineering (calculations for market statistics, market breakdown, market size estimations, market forecasting, and data triangulation), extensive primary research was conducted to gather information and verify and validate the critical numbers arrived at. Primary research was also undertaken to identify the segmentation types, industry trends, competitive landscape of Healthcare EDI solutions offered by various market players, and key market dynamics, such as drivers, restraints, opportunities, challenges, industry trends, and key player strategies.
In the complete market engineering process, the top-down and bottom-up approaches and several data triangulation methods were extensively used to perform the market estimation and market forecasting for the overall market segments and subsegments listed in this report. Extensive qualitative and quantitative analysis was performed on the complete market engineering process to list the key information/insights throughout the report.
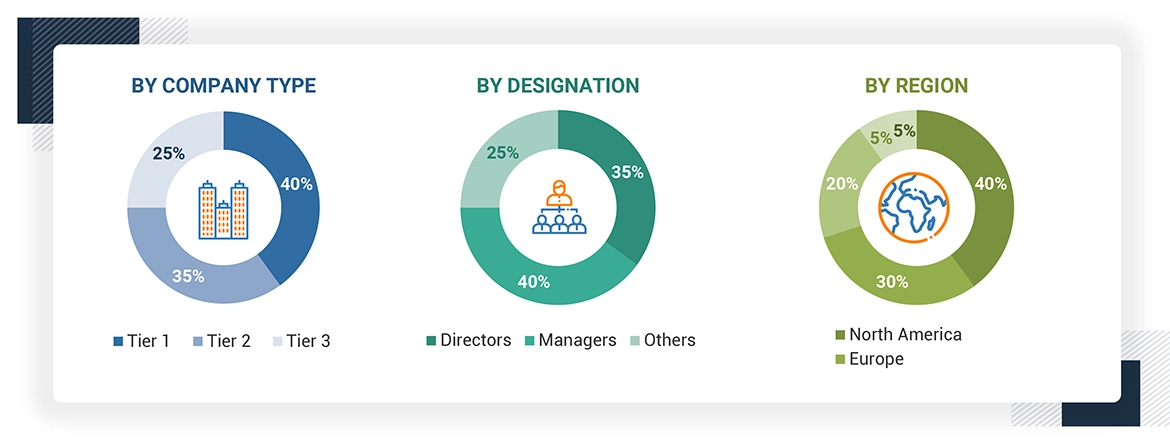
Note 1: Others include sales managers, marketing managers, and product managers.
Note 2: Tiers of companies are defined based on their total revenues in 2023. Tier 1 = >USD 1 billion, Tier 2 = USD 500 million to USD 1 billion, and Tier 3 = < USD 500 million.
To know about the assumptions considered for the study, download the pdf brochure
Market Size Estimation
Both top-down and bottom-up approaches were used to estimate and validate the total size of the Healthcare EDI market. These methods were also used extensively to estimate the size of various subsegments in the market. The research methodology used to estimate the market size includes the following:
-
The key players in the industry and markets have been identified through extensive secondary research.
-
The industry’s supply chain and market size, in terms of value, have been determined through primary and secondary research processes.
-
All percentage shares, splits, and breakdowns have been determined using secondary sources and verified through primary sources.
Data Triangulation
After arriving at the overall market size using the market size estimation processes explained above, the market was split into several segments and subsegments. The data triangulation and market breakup procedures were employed, wherever applicable, to complete the overall market engineering process and arrive at the exact statistics of each market segment and subsegment. The data was triangulated by studying various factors and trends from both the demand and supply sides.
Market Definition
Healthcare electronic data interchange (EDI) is a structured way to exchange healthcare information in a standardized format between providers, payers, clearinghouses, pharmacies, suppliers, and manufacturers. Healthcare EDI applies to documents such as claims, medical billing, health records, purchase orders, invoices, and shipping notices, as well as other essential or classified healthcare-related information.
Stakeholders
-
Transfection products manufacturing companies
-
Pharmaceutical & Biopharmaceutical Companies
-
Chemical Companies
-
Biopharmaceutical Companies
-
Contract Research Organizations (CROs)
-
Contract Development and Manufacturing Organizations (CDMOs)
-
Research Institutes and Universities
-
Venture Capitalists & Investors
-
Government Associations
Report Objectives
-
To define, describe, and forecast the healthcare EDI market based on component, transmission type, end user, and region
-
To provide detailed information about the major factors (drivers, opportunities, restraints, and challenges) influencing the growth of the market
-
To analyze opportunities for stakeholders by identifying the high-growth segments of the market
-
To forecast the size of the market segments with respect to five main regions: North America, Europe, Asia Pacific, the Middle East & Africa, and Latin America
-
To analyze subsegments of the market with respect to individual growth trends, prospects, and contributions to the overall market
-
To profile the key players and comprehensively analyze their market sizes and core competencies
-
To track and analyze competitive developments such as acquisitions, collaborations, agreements, mergers, product launches & updates, partnerships, expansions, and other recent developments in the market globally


 HIGHEST CAGR MARKET IN 2024-2029
 CANADA FASTEST GROWING MARKET IN THE REGION


Growth opportunities and latent adjacency in Healthcare EDI Market