Identity Threat Detection and Response (ITDR) Market

Identity Threat Detection and Response (ITDR) Market by Offering (Solutions and Services), Organization Size, Deployment Mode (Cloud and On-premises), Vertical (BFSI, Healthcare & Life Sciences, Government & Defense), & Region - Global Forecast to 2029

Report Code: TC 9016 May, 2024, by marketsandmarkets.com

[273 Pages Report] The global identity threat detection and response market size is projected to grow from USD 12.8 billion in 2024 to USD 35.6 billion by 2029 at a Compound Annual Growth Rate (CAGR) of 22.6% during the forecast period.

Expanded attack surfaces, including cloud adoption and interconnected systems, demand robust identity and access management solutions. Stricter data privacy regulations like GDPR and CCPA drive the need for ITDR to ensure compliance and prevent breaches. The shortage of cybersecurity professionals amplifies these challenges, making automation crucial. Market trends focus on combatting fraudulent activities in retail and e-commerce, safeguarding national security in government and defense, and protecting patient data in healthcare. The ITDR market is set for continuous expansion and innovation as industries prioritize identity and access management.

Identity Threat Detection and Response (ITDR) Market

To know about the assumptions considered for the study, Request for Free Sample Report

Identity Threat Detection and Response (ITDR) Market Opportunities

To know about the assumptions considered for the study, download the pdf brochure

Identity Threat Detection and Response Market Trends

Driver:  Escalating Threat Landscape

The increasing sophistication and frequency of cyberattacks, particularly those targeting individuals' digital identities, are propelling the demand for robust Identity Threat Detection and Response solutions. With identity-related breaches becoming more prevalent and damaging, organizations prioritize implementing ITDR technologies to safeguard against unauthorized access, identity theft, and other malicious activities. This escalating threat landscape underscores the critical need for proactive monitoring, rapid detection, and effective response mechanisms, driving the growth of the ITDR market as organizations strive to fortify their security posture and protect sensitive digital identities.

Restraint: Complexity and Integration Challenges

The complexity of integrating ITDR solutions into existing infrastructure and workflows poses a significant restraint on the market. Organizations often need help aligning ITDR technologies with security architectures, identity management systems, and compliance requirements. The diverse nature of identity-related threats necessitates a comprehensive approach, which may involve integrating multiple ITDR solutions and coordinating efforts across different teams and departments. This complexity can lead to implementation delays, increased costs, and operational inefficiencies, hindering the widespread adoption of ITDR solutions despite the growing need for enhanced identity threat detection and response capabilities.

Opportunity: Rising Demand for Cloud-based Solutions

The increasing adoption of cloud computing presents a significant opportunity for the ITDR market. As organizations migrate their IT infrastructure to the cloud, there is a growing need for cloud-native ITDR solutions that seamlessly integrate with cloud platforms and provide comprehensive protection for digital identities across distributed environments. Cloud-based ITDR solutions offer scalability, flexibility, and ease of management, making them well-suited to address the evolving threat landscape and the dynamic nature of modern IT ecosystems. By capitalizing on the opportunity presented by the shift to the cloud, ITDR vendors can expand their market reach and deliver innovative solutions that meet the evolving security needs of organizations in an increasingly digital world.

Challenge: Resource Constraints and Budget Limitations

A notable challenge for organizations in implementing ITDR solutions is the allocation of resources and budget limitations. Deploying and maintaining effective ITDR capabilities requires investment in technology, skilled personnel, training programs, and ongoing operational expenses. Many organizations face constraints in terms of financial resources, manpower, or expertise, which can impede their ability to implement comprehensive ITDR strategies. Competing organizational priorities may deprioritize ITDR initiatives in favor of other business objectives, further impairing resource constraints. Overcoming these challenges requires careful prioritization of ITDR investments, leveraging cost-effective solutions, and advocating for the importance of identity threat detection and response within the organization to secure necessary support and funding.

Identity Threat Detection and Response Market Ecosystem

The ITDR market ecosystem involves key players like IT security vendors, MSSPs, regulators, and end-user organizations across sectors. They work together to create and implement advanced AI and machine learning solutions. Continuous innovation is driven by evolving threats and regulations, aiming to strengthen defenses against identity-based attacks in cybersecurity.

Key players like Microsoft (US), IBM (US), Crowdstrike (US), and Zscaler (US) offer comprehensive solutions covering various application areas. These offerings reflect the industry's commitment to enhancing cybersecurity across diverse technological domains to safeguard against evolving cyber risks.

Top Companies in Identity Threat Detection and Response (ITDR) Market

The services segment will experience the highest growth rate during the forecast period by offering

The services segment is poised to experience the highest growth rate during the forecast period. As organizations increasingly recognize the importance of robust identity threat detection and response capabilities, there is a growing demand for expertise and assistance in deploying, configuring, and optimizing ITDR solutions to address their specific security needs. Service providers offer tailored solutions and domain expertise to help organizations navigate the complexities of ITDR implementation, ensuring seamless integration with existing infrastructure and workflows. Ongoing support and training services empower organizations to effectively utilize ITDR technologies, enhance their security posture, and respond promptly to emerging threats, driving the growth of the services segment in the ITDR market.

Based on organization size, the large enterprises segment accounts for the largest market size in the identity threat detection and response market.

The large enterprises segment dominates the ITDR market based on organization size, accounting for the largest market size. Large enterprises typically have extensive IT infrastructures, diverse digital ecosystems, and a higher risk profile due to their size and complexity, making them prime targets for identity-related threats. These organizations prioritize investing in comprehensive ITDR solutions to protect their valuable assets, sensitive data, and brand reputation. Moreover, large enterprises often have more significant financial resources and dedicated cybersecurity teams to implement and manage sophisticated ITDR technologies effectively. With a heightened focus on mitigating security risks and ensuring compliance with regulatory requirements, large enterprises drive substantial demand for advanced identity threat detection and response solutions, thus leading to their significant market share in the ITDR landscape.

The Asia Pacific region is projected to exhibit the highest growth rate in the identity threat detection and responsemarket.

The Asia Pacific region is anticipated to demonstrate the highest growth rate in the ITDR market. This surge is attributed to several factors, including rapid digital transformation, increasing internet penetration, and the proliferation of mobile devices across emerging economies in the region. As businesses expand their online presence and adopt cloud-based services, the risk of identity-related threats escalates, prompting organizations to invest in robust ITDR solutions. Stringent regulatory mandates and growing awareness of cybersecurity risks drive the demand for advanced identity threat detection and response capabilities in the Asia Pacific region. With governments and enterprises prioritizing cybersecurity initiatives, the Asia Pacific market presents lucrative opportunities for ITDR vendors to capitalize on the burgeoning demand and address the evolving security needs of organizations across various industries.

Asia Pacific Identity Threat Detection and Response (ITDR) Market Size, and Share

Key Market Players:

The major players in the identity threat detection and response market include Microsoft (US), IBM (US), CrowdStrike (US), Zscaler (US), Tenable (US), Veronis (US), BeyondTrust (US), CyberArk (US), Proofpoint (US), Quest (US), Oort(US), Vectra (US), Proficio (US), Qomplx (US), Adaptive Shield ( Israel), Acalvio (US), Authomize (Israel), Illusive (US), Mindfire (UAE), Rezonate (US), Semperis (US), Sentinelone (US), Silverfort (Israel), Netwrix (US), Vericlouds (US), Microminder (UK), Quorum Cyber (UK) and Mixmode (US).

Get online access to the report on the World's First Market Intelligence Cloud

  • Easy to Download Historical Data & Forecast Numbers
  • Company Analysis Dashboard for high growth potential opportunities
  • Research Analyst Access for customization & queries
  • Competitor Analysis with Interactive dashboard
  • Latest News, Updates & Trend analysis
Request Sample

Scope of the Report

Report Metrics

Details

Market size available for years

2022-2029

Base year considered

2023

Forecast period

2024-2029

Forecast units

Value (USD) Million/Billion

Segments Covered

By offering deployment mode, organization size, vertical and region

Region covered

North America, Europe, Asia Pacific, Middle East and Africa, and Latin America

Companies covered

Microsoft (US), IBM (US), CrowdStrike (US), Zscaler (US), Tenable (US), Veronis (US), BeyondTrust (US), CyberArk (US), Proofpoint (US), Quest (US), Oort(US), Vectra (US), Proficio (US), Qomplx (US), Adaptive Shield (Israel), Acalvio (US), Authorize (Israel), Illusive (US), Mindfire (UAE), Rezonate (US), Semperis (US), Sentinelone (US), Silverfort (Israel), Netwrix (US), Vericlouds (US), Microminder (UK), Quorum Cyber (UK) and Mix mode (US).   

This research report categorizes the identity threat detection and response market to forecast revenues and analyze trends in each of the following submarkets:

Based on the offering:
  • Solutions
    • Credential Threat Protection
    • Active Directory Threat Management
    • Exposure Management
    • Response & Remediation Management
  • Services
    • Professional Services
    • Managed Security Services
Based on Deployment mode:
  • On-premises
  • Cloud
Based on Organization size:
  • Large Enterprises
  • SMES
Based on the vertical:
  • BFSI
  • Retail and eCommerce
  • Government & Defense
  • Gaming & Gambling
  • IT & IteS
  • Telecommunication
  • Energy & Utilities
  • Education
  • Healthcare & Lifesciences
  • Other verticals
Based on the region:
  • North America
    • US
    • Canada
  • Europe
    • UK
    • Germany
    • France
    • Italy
    • Rest of Europe
  • Asia Pacific
    • China
    • Japan
    • India
    • Rest of Asia Pacific
  • Middle East and Africa
    • Gulf Cooperation Council (GCC)
      • KSA
      • UAE
      • Rest of GCC Countries
    • South Africa
    • Rest of Middle East and Africa
  • Latin America
    • Brazil
    • Mexico
    • Rest of Latin America

Recent Developments

  • January 2024 - IBM collaborated with ASUS to enhance cybersecurity by utilizing AI-powered security technologies to detect and remediate attacks swiftly. IBM's QRadar EDR will be integrated directly into ASUS's business hardware, supported by MDR services from IBM.
  • January 2024 - Aembit integrates its Workload IAM Platform with CrowdStrike Falcon for real-time security posture assessment, enabling dynamic access policy enforcement. This collaboration enhances ITDR capabilities, ensuring secure workload-to-workload access.
  • October 2023 - BeyondTrust partnered with the AWS SaaS Factory team to build their Identity Security Insights solution as a SaaS offering on AWS. This collaboration helped BeyondTrust navigate business and technical decisions for a successful SaaS model launch.
  • September 2023 - CyberArk collaborates with Accenture to deploy CyberArk Privilege Cloud to enhance PAM solutions. This initiative aims to bolster cybersecurity defenses by managing and monitoring privileged access, which is crucial for ITDR. The collaboration leverages CyberArk's Identity Security Platform, enabling comprehensive security for identities across various IT environments, aligning with ITDR principles by securing access and mitigating risks associated with privileged accounts.
  • July 2023 - Microsoft partnered with CISA by offering expanded cloud logging capabilities at no additional cost. This initiative directly supports ITDR by improving detection and response to identity-related threats, making it easier for organizations to maintain identity integrity and security through better visibility and monitoring of security incidents.

Frequently Asked Questions (FAQ):

To speak to our analyst for a discussion on the above findings, click Speak to Analyst

TABLE OF CONTENTS
 
1 INTRODUCTION (Page No. - 28)
    1.1 STUDY OBJECTIVES 
    1.2 MARKET DEFINITION 
           1.2.1 INCLUSIONS AND EXCLUSIONS
    1.3 MARKET SCOPE 
           1.3.1 MARKET SEGMENTATION
           1.3.2 REGIONS COVERED
           1.3.3 YEARS CONSIDERED
    1.4 CURRENCY CONSIDERED 
           TABLE 1 USD EXCHANGE RATES, 2021–2023
    1.5 STAKEHOLDERS 
 
2 RESEARCH METHODOLOGY (Page No. - 33)
    2.1 RESEARCH DATA 
           FIGURE 1 IDENTITY THREAT DETECTION AND RESPONSE MARKET: RESEARCH DESIGN
           2.1.1 SECONDARY DATA
           2.1.2 PRIMARY DATA
                    2.1.2.1 Breakup of primaries
                    2.1.2.2 Key industry insights
    2.2 MARKET BREAKUP AND DATA TRIANGULATION 
           FIGURE 2 MARKET: DATA TRIANGULATION
    2.3 MARKET SIZE ESTIMATION 
           2.3.1 TOP-DOWN APPROACH
                    FIGURE 3 MARKET SIZE ESTIMATION METHODOLOGY: TOP-DOWN APPROACH
           2.3.2 BOTTOM-UP APPROACH
                    FIGURE 4 MARKET SIZE ESTIMATION METHODOLOGY— (SUPPLY-SIDE): REVENUE FROM SOFTWARE/SERVICES OF IDENTITY THREAT DETECTION AND RESPONSE VENDORS
                    FIGURE 5 MARKET SIZE ESTIMATION METHODOLOGY: SUPPLY-SIDE ANALYSIS
    2.4 MARKET FORECAST 
           TABLE 2 FACTOR ANALYSIS
    2.5 RESEARCH ASSUMPTIONS 
    2.6 LIMITATIONS 
           FIGURE 6 LIMITATIONS OF MARKET REPORT
    2.7 RECESSION IMPACT 
 
3 EXECUTIVE SUMMARY (Page No. - 44)
    FIGURE 7 GLOBAL IDENTITY THREAT DETECTION AND RESPONSE MARKET TO WITNESS SIGNIFICANT GROWTH DURING FORECAST PERIOD 
    FIGURE 8 MARKET: REGIONAL SNAPSHOT 
 
4 PREMIUM INSIGHTS (Page No. - 47)
    4.1 ATTRACTIVE OPPORTUNITIES FOR PLAYERS IN IDENTITY THREAT DETECTION AND RESPONSE MARKET 
           FIGURE 9 RISING NEED FOR SECURE WEB AND MOBILE APPLICATIONS TO DRIVE MARKET GROWTH
    4.2 MARKET, BY OFFERING 
           FIGURE 10 SOLUTIONS SEGMENT TO ACCOUNT FOR LARGER MARKET DURING FORECAST PERIOD
    4.3 MARKET, BY VERTICAL 
           FIGURE 11 BFSI VERTICAL TO LEAD MARKET DURING FORECAST PERIOD
    4.4 MARKET, BY DEPLOYMENT MODE 
           FIGURE 12 CLOUD MODE TO DOMINATE MARKET DURING FORECAST PERIOD
    4.5 MARKET, BY ORGANIZATION SIZE 
           FIGURE 13 LARGE ENTERPRISES SEGMENT TO EXHIBIT LARGER MARKET SIZE DURING FORECAST PERIOD
    4.6 MARKET INVESTMENT SCENARIO 
           FIGURE 14 ASIA PACIFIC TO EMERGE AS BEST MARKET FOR INVESTMENTS IN NEXT FIVE YEARS
 
5 IDENTITY THREAT DETECTION AND RESPONSE MARKET OVERVIEW AND INDUSTRY TRENDS (Page No. - 50)
    5.1 INTRODUCTION 
    5.2 MARKET DYNAMICS 
           FIGURE 15 IDENTITY THREAT DETECTION AND RESPONSE MARKET: DRIVERS, RESTRAINTS, OPPORTUNITIES, AND CHALLENGES
           5.2.1 DRIVERS
                    5.2.1.1 Rise in user identity targeted cyber crimes
                    5.2.1.2 Evolving remote work landscape
                    5.2.1.3 Growing regulatory environment
           5.2.2 RESTRAINTS
                    5.2.2.1 Navigating complexities of solutions for small businesses
                    5.2.2.2 Privacy concerns due to collection of extensive user activity data
                    5.2.2.3 Difficulty in distinguishing between genuine threats and false alarms
           5.2.3 OPPORTUNITIES
                    5.2.3.1 Inclusion of AI/ML
                    5.2.3.2 Growing trend toward cloud-based services
                    5.2.3.3 Improving communication and data exchange through integration of systems
           5.2.4 CHALLENGES
                    5.2.4.1 Lack of universal standards for data exchange in security industry
                    5.2.4.2 Privacy and data breach challenges
    5.3 CASE STUDY ANALYSIS 
           5.3.1 REZONATE PROVIDED INSURANCE COMPANY UNPRECEDENTED VIEW OF ENVIRONMENT AND MITIGATED CLOUD RISKS
           5.3.2 ACALVIO SHADOWPLEX SAFEGUARDED HEALTHCARE PROVIDER'S CRITICAL INFRASTRUCTURE WITH DECEPTION TECHNOLOGY
           5.3.3 QOMPLX SECURED MDR DENTAL HEALTHCARE'S ACTIVE DIRECTORY WITH CENTRALIZED MANAGEMENT AND THREAT DETECTION
           5.3.4 VARONIS’ COMPREHENSIVE DATA SECURITY PLATFORM HELPED LAW FIRM ENHANCE VISIBILITY AND IMPROVE DATA SECURITY COMPLIANCE
    5.4 VALUE CHAIN ANALYSIS 
           FIGURE 16 IDENTITY THREAT DETECTION AND RESPONSE MARKET: VALUE CHAIN ANALYSIS
           5.4.1 COMPONENT PROVIDERS
           5.4.2 PLANNING AND DESIGNING
           5.4.3 INFRASTRUCTURE DEPLOYMENT
           5.4.4 SYSTEM INTEGRATION
           5.4.5 END-USER VERTICALS
    5.5 ECOSYSTEM/MARKET MAP 
           FIGURE 17 KEY PLAYERS IN MARKET ECOSYSTEM
           TABLE 3 MARKET: ECOSYSTEM
    5.6 PORTER’S FIVE FORCES ANALYSIS 
           FIGURE 18 PORTER’S FIVE FORCES ANALYSIS
           TABLE 4 PORTER’S FIVE FORCES’ IMPACT ON MARKET
           5.6.1 THREAT OF NEW ENTRANTS
           5.6.2 BARGAINING POWER OF SUPPLIERS
           5.6.3 BARGAINING POWER OF BUYERS
           5.6.4 THREAT OF SUBSTITUTES
           5.6.5 INTENSITY OF COMPETITIVE RIVALRY
    5.7 PRICING ANALYSIS 
           5.7.1 AVERAGE SELLING PRICE TREND OF KEY PLAYERS, BY COMPONENT
                    FIGURE 19 AVERAGE SELLING PRICE TREND OF KEY PLAYERS: TOP THREE COMPONENTS
                    TABLE 5 AVERAGE SELLING PRICE TREND OF KEY PLAYERS, BY COMPONENT
           5.7.2 INDICATIVE PRICING ANALYSIS
                    TABLE 6 INDICATIVE PRICING LEVELS OF IDENTITY THREAT DETECTION AND RESPONSE SOLUTIONS
    5.8 TECHNOLOGY ANALYSIS 
           5.8.1 KEY TECHNOLOGIES
                    5.8.1.1 Machine Learning & AI
           5.8.2 COMPLEMENTARY TECHNOLOGIES
                    5.8.2.1 Big data analytics
                    5.8.2.2 Biometric authentication
           5.8.3 ADJACENT TECHNOLOGIES
                    5.8.3.1 Endpoint security
                    5.8.3.2 Cloud security
    5.9 PATENT ANALYSIS 
           FIGURE 20 NUMBER OF PATENTS GRANTED IN IDENTITY THREAT DETECTION AND RESPONSE MARKET, 2013–2023
           FIGURE 21 REGIONAL ANALYSIS OF PATENTS GRANTED IN MARKET
           5.9.1 LIST OF MAJOR PATENTS
    5.10 TRADE ANALYSIS 
           5.10.1 IMPORT SCENARIO OF DATA PROCESSING & ENCRYPTION HARDWARE
                    FIGURE 22 IMPORT TRENDS IN MARKET: DATA PROCESSING & ENCRYPTION HARDWARE, 2018–2022 (USD BILLION)
           5.10.2 EXPORT SCENARIO OF DATA PROCESSING & ENCRYPTION HARDWARE
                    FIGURE 23 EXPORT TRENDS IN MARKET: DATA PROCESSING & ENCRYPTION HARDWARE, 2018–2022 (USD BILLION)
    5.11 TRENDS/DISRUPTIONS IMPACTING BUYERS 
                    FIGURE 24 MARKET: TRENDS/DISRUPTIONS IMPACTING CUSTOMERS’ BUSINESSES
    5.12 TARIFFS AND REGULATORY LANDSCAPE 
           5.12.1 TARIFFS RELATED TO IDENTITY THREAT DETECTION AND RESPONSE
                    TABLE 7 TARIFFS RELATED TO IDENTITY THREAT DETECTION AND RESPONSE PRODUCTS, 2022
           5.12.2 REGULATORY BODIES, GOVERNMENT AGENCIES, AND OTHER ORGANIZATIONS
                    TABLE 8 NORTH AMERICA: LIST OF REGULATORY BODIES, GOVERNMENT AGENCIES, AND OTHER ORGANIZATIONS
                    TABLE 9 EUROPE: LIST OF REGULATORY BODIES, GOVERNMENT AGENCIES, AND OTHER ORGANIZATIONS
                    TABLE 10 ASIA PACIFIC: LIST OF REGULATORY BODIES, GOVERNMENT AGENCIES, AND OTHER ORGANIZATIONS
                    TABLE 11 MIDDLE EAST & AFRICA: LIST OF REGULATORY BODIES, GOVERNMENT AGENCIES, AND OTHER ORGANIZATIONS
                    TABLE 12 LATIN AMERICA: LIST OF REGULATORY BODIES, GOVERNMENT AGENCIES, AND OTHER ORGANIZATIONS
    5.13 KEY STAKEHOLDERS AND BUYING CRITERIA 
           5.13.1 KEY STAKEHOLDERS IN BUYING PROCESS
                    FIGURE 25 INFLUENCE OF STAKEHOLDERS ON BUYING PROCESS FOR KEY VERTICALS
                    TABLE 13 INFLUENCE OF STAKEHOLDERS ON BUYING PROCESS FOR KEY VERTICALS
           5.13.2 BUYING CRITERIA
                    FIGURE 26 KEY BUYING CRITERIA FOR TOP THREE VERTICALS
                    TABLE 14 KEY BUYING CRITERIA FOR TOP THREE APPLICATIONS
    5.14 KEY CONFERENCES & EVENTS 
                    TABLE 15 MARKET: DETAILED LIST OF CONFERENCES AND EVENTS, 2024
    5.15 BUSINESS MODEL ANALYSIS 
           5.15.1 PERPETUAL LICENSING MODEL
           5.15.2 SUBSCRIPTION-BASED MODEL
           5.15.3 CLOUD-DELIVERED (SAAS) MODEL
           5.15.4 MANAGED SECURITY SERVICE PROVIDER (MSSP) MODEL
           5.15.5 FREEMIUM MODEL
           5.15.6 OPEN-SOURCE IDENTITY THREAT DETECTION AND RESPONSE MODEL
           5.15.7 USAGE-BASED BILLING MODEL
           5.15.8 PROFESSIONAL SERVICES
    5.16 INVESTMENTS AND FUNDING SCENARIO 
                    FIGURE 27 LEADING GLOBAL IDENTITY THREAT DETECTION AND RESPONSE STARTUPS/SMES, BY NUMBER OF INVESTOR AND FUNDING ROUND
 
6 IDENTITY THREAT DETECTION AND RESPONSE MARKET, BY OFFERING (Page No. - 85)
    6.1 INTRODUCTION 
           6.1.1 OFFERING: MARKET DRIVERS
                    FIGURE 28 SERVICES SEGMENT TO ACCOUNT FOR LARGER MARKET DURING FORECAST PERIOD
                    TABLE 16 MARKET, BY OFFERING, 2022–2029 (USD MILLION)
                    TABLE 17 OFFERING: MARKET, BY REGION, 2022–2029 (USD MILLION)
    6.2 SOLUTIONS 
           6.2.1 IDENTITY THREAT DETECTION AND RESPONSE SOLUTIONS PIVOTAL IN FORTIFYING ORGANIZATIONAL DEFENSES AGAINST IDENTITY-BASED THREATS
                    TABLE 18 MARKET, BY SOLUTION, 2022–2029 (USD MILLION)
                    TABLE 19 SOLUTIONS: MARKET, BY REGION, 2022–2029 (USD MILLION)
           6.2.2 CREDENTIAL THREAT PROTECTION
                    6.2.2.1 Rampant increase in sophisticated cyberattacks to boost demand for credential theft protection solutions
                               TABLE 20 CREDENTIAL THREAT PROTECTION: MARKET, BY REGION, 2022–2029 (USD MILLION)
           6.2.3 ACTIVE DIRECTORY THREAT MANAGEMENT
                    6.2.3.1 Surging need for implementing controls to protect Active Directory infrastructure to drive market
                               TABLE 21 ACTIVE DIRECTORY THREAT MANAGEMENT: MARKET, BY REGION, 2022–2029 (USD MILLION)
           6.2.4 EXPOSURE MANAGEMENT
                    6.2.4.1 Rising cloud adoption and increase in remote working arrangements to fuel market growth
                               TABLE 22 EXPOSURE MANAGEMENT: IDENTITY THREAT DETECTION AND RESPONSE MARKET, BY REGION, 2022–2029 (USD MILLION)
           6.2.5 RESPONSE & REMEDIATION MANAGEMENT
                    6.2.5.1 Increasing complexity and volume of identity-based attacks to boost market
                               TABLE 23 RESPONSE & REMEDIATION MANAGEMENT: MARKET, BY REGION, 2022–2029 (USD MILLION)
    6.3 SERVICES 
           6.3.1 SERVICES TO LEVERAGE ADVANCED DETECTION AND RESPONSE CAPABILITIES WITHOUT REQUIRING DEEP INTERNAL EXPERTISE OR SIGNIFICANT RESOURCE ALLOCATION
                    TABLE 24 MARKET, BY SERVICE, 2022–2029 (USD MILLION)
                    TABLE 25 SERVICES: MARKET, BY REGION, 2022–2029 (USD MILLION)
           6.3.2 PROFESSIONAL SERVICES
                    6.3.2.1 Complexity of configuring and maintaining identity threat detection and response systems in dynamic IT environments to fuel demand for professional services
                               TABLE 26 PROFESSIONAL SERVICES: MARKET, BY REGION, 2022–2029 (USD MILLION)
           6.3.3 MANAGED SERVICES
                    6.3.3.1 Increasing frequency and sophistication of identity threats to accelerate demand for managed services
                               TABLE 27 MANAGED SERVICES: MARKET, BY REGION, 2022–2029 (USD MILLION)
 
7 IDENTITY THREAT DETECTION AND RESPONSE MARKET, BY DEPLOYMENT MODE (Page No. - 95)
    7.1 INTRODUCTION 
           7.1.1 DEPLOYMENT MODE: MARKET DRIVERS
                    FIGURE 29 CLOUD-BASED DEPLOYMENT MODE TO RECORD HIGHER CAGR DURING FORECAST PERIOD
                    TABLE 28 MARKET, BY DEPLOYMENT MODE, 2022–2029 (USD MILLION)
    7.2 ON-PREMISES 
           7.2.1 ON-PREMISES DEPLOYMENT TO MITIGATE CONCERNS ABOUT DATA SOVEREIGNTY AND PRIVACY
                    TABLE 29 ON-PREMISES: MARKET, BY REGION, 2022–2029 (USD MILLION)
    7.3 CLOUD 
           7.3.1 CLOUD DEPLOYMENT TO OFFER FLEXIBILITY, EFFECTIVENESS, AND EFFICIENCY
                    TABLE 30 CLOUD: MARKET, BY REGION, 2022–2029 (USD MILLION)
 
8 IDENTITY THREAT DETECTION AND RESPONSE MARKET, BY ORGANIZATION SIZE (Page No. - 99)
    8.1 INTRODUCTION 
           8.1.1 ORGANIZATION SIZE: MARKET DRIVERS
                    FIGURE 30 SMALL AND MEDIUM-SIZED ENTERPRISES SEGMENT TO RECORD HIGHER CAGR DURING FORECAST PERIOD
                    TABLE 31 MARKET, BY ORGANIZATION SIZE, 2022–2029 (USD MILLION)
    8.2 LARGE ENTERPRISES 
           8.2.1 NEED TO PROTECT ENTERPRISES AGAINST SOPHISTICATED CYBER THREATS TO DRIVE MARKET
                    TABLE 32 LARGE ENTERPRISES: MARKET, BY REGION, 2022–2029 (USD MILLION)
    8.3 SMES 
           8.3.1 RISING NEED FOR COST-EFFECTIVE, EASY-TO-DEPLOY, AND MANAGEABLE IDENTITY THREAT DETECTION AND RESPONSE SOLUTIONS TO BOLSTER MARKET
                    TABLE 33 SMALL AND MEDIUM-SIZED ENTERPRISES: MARKET, BY REGION, 2022–2029 (USD MILLION)
 
9 IDENTITY THREAT DETECTION AND RESPONSE MARKET, BY VERTICAL (Page No. - 103)
    9.1 INTRODUCTION 
           9.1.1 VERTICAL: MARKET DRIVERS
                    FIGURE 31 HEALTHCARE VERTICAL TO RECORD HIGHEST GROWTH RATE DURING FORECAST PERIOD
                    TABLE 34 MARKET, BY VERTICAL, 2022–2029 (USD MILLION)
    9.2 BANKING, FINANCIAL SERVICES, AND INSURANCE (BFSI) 
           9.2.1 SURGING DEMAND FOR ADVANCED THREAT DETECTION METHODOLOGIES TO DRIVE DEVELOPMENT OF IDENTITY THREAT DETECTION AND RESPONSE SOLUTIONS
                    TABLE 35 BFSI: MARKET, BY REGION, 2022–2029 (USD MILLION)
    9.3 RETAIL & ECOMMERCE 
           9.3.1 IDENTITY THREAT DETECTION AND RESPONSE SOLUTIONS’ ROLE IN COMBATING FRAUD BY DETECTING AND PREVENTING VARIOUS FRAUDULENT ACTIVITIES TO BOOST MARKET
                    TABLE 36 RETAIL & ECOMMERCE: MARKET, BY REGION, 2022–2029 (USD MILLION)
    9.4 GOVERNMENT & DEFENSE 
           9.4.1 IMPROVED OPERATIONAL EFFICIENCY AND RESILIENCE IN FACE OF MODERN CYBERSECURITY CHALLENGES TO PROPEL MARKET GROWTH
                    TABLE 37 GOVERNMENT & DEFENSE: MARKET, BY REGION, 2022–2029 (USD MILLION)
    9.5 GAMING & GAMBLING 
           9.5.1 FREQUENT HIGH-VALUE TRANSACTIONS INHERENT IN ONLINE BETTING TO SERVE AS FERTILE GROUND FOR IDENTITY THREAT DETECTION AND RESPONSE SOLUTIONS
                    TABLE 38 GAMING & GAMBLING: MARKET, BY REGION, 2022–2029 (USD MILLION)
    9.6 IT & ITES 
           9.6.1 SURGING NEED TO SAFEGUARD SENSITIVE DATA TO ACCELERATE MARKET GROWTH
                    TABLE 39 IT & ITES: IDENTITY THREAT DETECTION AND RESPONSE MARKET, BY REGION, 2022–2029 (USD MILLION)
    9.7 TELECOMMUNICATIONS 
           9.7.1 RISING DEMAND FOR MAINTAINING BUSINESS CONTINUITY AND MITIGATING RISK OF WIDESPREAD OUTAGES TO DRIVE MARKET
                    TABLE 40 TELECOMMUNICATIONS: MARKET, BY REGION, 2022–2029 (USD MILLION)
    9.8 ENERGY & UTILITIES 
           9.8.1 IDENTITY THREAT DETECTION AND RESPONSE SOLUTIONS TO SAFEGUARD CRITICAL INFRASTRUCTURE BY THWARTING UNAUTHORIZED ACCESS ATTEMPTS
                    TABLE 41 ENERGY & UTILITIES: MARKET, BY REGION, 2022–2029 (USD MILLION)
    9.9 EDUCATION 
           9.9.1 NEED FOR SECURE LEARNING ENVIRONMENT CONDUCIVE TO ACADEMIC EXCELLENCE TO DRIVE MARKET
                    TABLE 42 EDUCATION: MARKET, BY REGION, 2022–2029 (USD MILLION)
    9.10 HEALTHCARE & LIFE SCIENCES 
           9.10.1 NEED FOR UPHOLDING PATIENT SAFETY AND FOSTERING TRUST IN HEALTHCARE SERVICES TO BOOST MARKET
                    TABLE 43 HEALTHCARE& LIFE SCIENCES: MARKET, BY REGION, 2022–2029 (USD MILLION)
    9.11 OTHER VERTICALS 
                    TABLE 44 OTHER VERTICALS: MARKET, BY REGION, 2022–2029 (USD MILLION)
 
10 IDENTITY THREAT DETECTION AND RESPONSE MARKET, BY REGION (Page No. - 115)
     10.1 INTRODUCTION 
               TABLE 45 MARKET, BY REGION, 2022–2029 (USD MILLION)
               FIGURE 32 ASIA PACIFIC TO RECORD HIGHEST CAGR DURING FORECAST PERIOD
     10.2 NORTH AMERICA 
             10.2.1 NORTH AMERICA: IDENTITY THREAT DETECTION AND RESPONSE MARKET DRIVERS
             10.2.2 MARKET IN NORTH AMERICA: RECESSION IMPACT
                       FIGURE 33 NORTH AMERICA: MARKET SNAPSHOT
                       TABLE 46 NORTH AMERICA: MARKET, BY OFFERING, 2022–2029 (USD MILLION)
                       TABLE 47 NORTH AMERICA: MARKET, BY SERVICE, 2022–2029 (USD MILLION)
                       TABLE 48 NORTH AMERICA: MARKET, BY DEPLOYMENT MODE, 2022–2029 (USD MILLION)
                       TABLE 49 NORTH AMERICA: MARKET, BY ORGANIZATION SIZE, 2022–2029 (USD MILLION)
                       TABLE 50 NORTH AMERICA: MARKET, BY SOLUTION, 2022–2029 (USD MILLION)
                       TABLE 51 NORTH AMERICA: MARKET, BY VERTICAL, 2022–2029 (USD MILLION)
                       TABLE 52 NORTH AMERICA: MARKET, BY COUNTRY, 2022–2029 (USD MILLION)
             10.2.3 US
                       10.2.3.1 Increasing frequency of cyberattacks targeting identities to drive market
                                   TABLE 53 US: IDENTITY THREAT DETECTION AND RESPONSE MARKET, BY OFFERING, 2022–2029 (USD MILLION)
                                   TABLE 54 US: MARKET, BY SERVICE, 2022–2029 (USD MILLION)
                                   TABLE 55 US: MARKET, BY DEPLOYMENT MODE, 2022–2029 (USD MILLION)
                                   TABLE 56 US: MARKET, BY ORGANIZATION SIZE, 2022–2029 (USD MILLION)
                                   TABLE 57 US: MARKET, BY SOLUTION, 2022–2029 (USD MILLION)
                                   TABLE 58 US: MARKET, BY VERTICAL, 2022–2029 (USD MILLION)
             10.2.4 CANADA
                       10.2.4.1 Stringent government regulations to fuel demand for identity threat detection and response solutions
                                   TABLE 59 CANADA: MARKET, BY OFFERING, 2022–2029 (USD MILLION)
                                   TABLE 60 CANADA: MARKET, BY SERVICE, 2022–2029 (USD MILLION)
                                   TABLE 61 CANADA: MARKET, BY DEPLOYMENT MODE, 2022–2029 (USD MILLION)
                                   TABLE 62 CANADA: MARKET, BY ORGANIZATION SIZE, 2022–2029 (USD MILLION)
                                   TABLE 63 CANADA: MARKET, BY SOLUTION, 2022–2029 (USD MILLION)
                                   TABLE 64 CANADA: MARKET, BY VERTICAL, 2022–2029 (USD MILLION)
     10.3 EUROPE 
             10.3.1 EUROPE: IDENTITY THREAT DETECTION AND RESPONSE MARKET DRIVERS
             10.3.2 MARKET IN EUROPE: RECESSION IMPACT
                       TABLE 65 EUROPE: MARKET, BY OFFERING, 2022–2029 (USD MILLION)
                       TABLE 66 EUROPE: MARKET, BY SERVICE, 2022–2029 (USD MILLION)
                       TABLE 67 EUROPE: MARKET, BY DEPLOYMENT MODE, 2022–2029 (USD MILLION)
                       TABLE 68 EUROPE: MARKET, BY ORGANIZATION SIZE, 2022–2029 (USD MILLION)
                       TABLE 69 EUROPE: MARKET, BY SOLUTION, 2022–2029 (USD MILLION)
                       TABLE 70 EUROPE: MARKET, BY VERTICAL, 2022–2029 (USD MILLION)
                       TABLE 71 EUROPE: MARKET, BY COUNTRY, 2022–2029 (USD MILLION)
             10.3.3 UK
                       10.3.3.1 Rising volume of phishing attacks to accelerate market growth
                                   TABLE 72 UK: MARKET, BY OFFERING, 2022–2029 (USD MILLION)
                                   TABLE 73 UK: MARKET, BY SERVICE, 2022–2029 (USD MILLION)
                                   TABLE 74 UK: MARKET, BY DEPLOYMENT MODE, 2022–2029 (USD MILLION)
                                   TABLE 75 UK: MARKET, BY ORGANIZATION SIZE, 2022–2029 (USD MILLION)
                                   TABLE 76 UK: MARKET, BY SOLUTION, 2022–2029 (USD MILLION)
                                   TABLE 77 UK: MARKET, BY VERTICAL, 2022–2029 (USD MILLION)
             10.3.4 GERMANY
                       10.3.4.1 Rising need for comprehensive identity threat detection and response solutions with robust user access controls to boost market
                                   TABLE 78 GERMANY: IDENTITY THREAT DETECTION AND RESPONSE MARKET, BY OFFERING, 2022–2029 (USD MILLION)
                                   TABLE 79 GERMANY: MARKET, BY SERVICE, 2022–2029 (USD MILLION)
                                   TABLE 80 GERMANY: MARKET, BY DEPLOYMENT MODE, 2022–2029 (USD MILLION)
                                   TABLE 81 GERMANY: MARKET, BY ORGANIZATION SIZE, 2022–2029 (USD MILLION)
                                   TABLE 82 GERMANY: MARKET, BY SOLUTION, 2022–2029 (USD MILLION)
                                   TABLE 83 GERMANY: MARKET, BY VERTICAL, 2022–2029 (USD MILLION)
             10.3.5 FRANCE
                       10.3.5.1 Surge in demand for robust identity management and cyber threat detection to bolster market growth
                                   TABLE 84 FRANCE: MARKET, BY OFFERING, 2022–2029 (USD MILLION)
                                   TABLE 85 FRANCE: MARKET, BY SERVICE, 2022–2029 (USD MILLION)
                                   TABLE 86 FRANCE: MARKET, BY DEPLOYMENT MODE, 2022–2029 (USD MILLION)
                                   TABLE 87 FRANCE: MARKET, BY ORGANIZATION SIZE, 2022–2029 (USD MILLION)
                                   TABLE 88 FRANCE: MARKET, BY SOLUTION, 2022–2029 (USD MILLION)
                                   TABLE 89 FRANCE: MARKET, BY VERTICAL, 2022–2029 (USD MILLION)
             10.3.6 ITALY
                       10.3.6.1 Active embrace of digital transformation initiatives to amplify demand for identity threat detection and response solutions
                                   TABLE 90 ITALY: IDENTITY THREAT DETECTION AND RESPONSE MARKET, BY OFFERING, 2022–2029 (USD MILLION)
                                   TABLE 91 ITALY: MARKET, BY SERVICE, 2022–2029 (USD MILLION)
                                   TABLE 92 ITALY: MARKET, BY DEPLOYMENT MODE, 2022–2029 (USD MILLION)
                                   TABLE 93 ITALY: MARKET, BY ORGANIZATION SIZE, 2022–2029 (USD MILLION)
                                   TABLE 94 ITALY: MARKET, BY SOLUTION, 2022–2029 (USD MILLION)
                                   TABLE 95 ITALY: MARKET, BY VERTICAL, 2022–2029 (USD MILLION)
             10.3.7 REST OF EUROPE
                       TABLE 96 REST OF EUROPE: MARKET, BY OFFERING, 2022–2029 (USD MILLION)
                       TABLE 97 REST OF EUROPE: MARKET, BY SERVICE, 2022–2029 (USD MILLION)
                       TABLE 98 REST OF EUROPE: MARKET, BY DEPLOYMENT MODE, 2022–2029 (USD MILLION)
                       TABLE 99 REST OF EUROPE: MARKET, BY ORGANIZATION SIZE, 2022–2029 (USD MILLION)
                       TABLE 100 REST OF EUROPE: MARKET, BY SOLUTION, 2022–2029 (USD MILLION)
                       TABLE 101 REST OF EUROPE: MARKET, BY VERTICAL, 2022–2029 (USD MILLION)
     10.4 ASIA PACIFIC 
             10.4.1 ASIA PACIFIC: IDENTITY THREAT DETECTION AND RESPONSE MARKET DRIVERS
             10.4.2 MARKET IN ASIA PACIFIC: RECESSION IMPACT
                       FIGURE 34 ASIA PACIFIC: MARKET SNAPSHOT
                       TABLE 102 ASIA PACIFIC: MARKET, BY OFFERING, 2022–2029 (USD MILLION)
                       TABLE 103 ASIA PACIFIC: MARKET, BY SERVICE, 2022–2029 (USD MILLION)
                       TABLE 104 ASIA PACIFIC: MARKET, BY DEPLOYMENT MODE, 2022–2029 (USD MILLION)
                       TABLE 105 ASIA PACIFIC: MARKET, BY ORGANIZATION SIZE, 2022–2029 (USD MILLION)
                       TABLE 106 ASIA PACIFIC: MARKET, BY SOLUTION, 2022–2029 (USD MILLION)
                       TABLE 107 ASIA PACIFIC: MARKET, BY VERTICAL, 2022–2029 (USD MILLION)
                       TABLE 108 ASIA PACIFIC: MARKET, BY COUNTRY, 2022–2029 (USD MILLION)
             10.4.3 CHINA
                       10.4.3.1 Government involvement in promoting strategic security solutions to fuel market growth
                                   TABLE 109 CHINA: IDENTITY THREAT DETECTION AND RESPONSE MARKET, BY OFFERING, 2022–2029 (USD MILLION)
                                   TABLE 110 CHINA: MARKET, BY SERVICE, 2022–2029 (USD MILLION)
                                   TABLE 111 CHINA: MARKET, BY DEPLOYMENT MODE, 2022–2029 (USD MILLION)
                                   TABLE 112 CHINA: MARKET, BY ORGANIZATION SIZE, 2022–2029 (USD MILLION)
                                   TABLE 113 CHINA: MARKET, BY SOLUTION, 2022–2029 (USD MILLION)
                                   TABLE 114 CHINA: MARKET, BY VERTICAL, 2022–2029 (USD MILLION)
             10.4.4 JAPAN
                       10.4.4.1 Technological advancements and rising cyber threats to drive demand for identity threat detection and response solutions
                                   TABLE 115 JAPAN: IDENTITY THREAT DETECTION AND RESPONSE MARKET, BY OFFERING, 2022–2029 (USD MILLION)
                                   TABLE 116 JAPAN: MARKET, BY SERVICE, 2022–2029 (USD MILLION)
                                   TABLE 117 JAPAN: MARKET, BY DEPLOYMENT MODE, 2022–2029 (USD MILLION)
                                   TABLE 118 JAPAN: MARKET, BY ORGANIZATION SIZE, 2022–2029 (USD MILLION)
                                   TABLE 119 JAPAN: MARKET, BY SOLUTION, 2022–2029 (USD MILLION)
                                   TABLE 120 JAPAN: MARKET, BY VERTICAL, 2022–2029 (USD MILLION)
             10.4.5 INDIA
                       10.4.5.1 Unique digital landscape and evolving regulations to boost market growth
                                   TABLE 121 INDIA: IDENTITY THREAT DETECTION AND RESPONSE MARKET, BY OFFERING, 2022–2029 (USD MILLION)
                                   TABLE 122 INDIA: MARKET, BY SERVICE, 2022–2029 (USD MILLION)
                                   TABLE 123 INDIA: MARKET, BY DEPLOYMENT MODE, 2022–2029 (USD MILLION)
                                   TABLE 124 INDIA: MARKET, BY ORGANIZATION SIZE, 2022–2029 (USD MILLION)
                                   TABLE 125 INDIA: MARKET, BY SOLUTION, 2022–2029 (USD MILLION)
                                   TABLE 126 INDIA: MARKET, BY VERTICAL, 2022–2029 (USD MILLION)
             10.4.6 REST OF ASIA PACIFIC
                       TABLE 127 REST OF ASIA PACIFIC: IDENTITY THREAT DETECTION AND RESPONSE MARKET, BY OFFERING, 2022–2029 (USD MILLION)
                       TABLE 128 REST OF ASIA PACIFIC: MARKET, BY SERVICE, 2022–2029 (USD MILLION)
                       TABLE 129 REST OF ASIA PACIFIC: MARKET, BY DEPLOYMENT MODE, 2022–2029 (USD MILLION)
                       TABLE 130 REST OF ASIA PACIFIC: MARKET, BY ORGANIZATION SIZE, 2022–2029 (USD MILLION)
                       TABLE 131 REST OF ASIA PACIFIC: MARKET, BY SOLUTION, 2022–2029 (USD MILLION)
                       TABLE 132 REST OF ASIA PACIFIC: MARKET, BY VERTICAL, 2022–2029 (USD MILLION)
     10.5 MIDDLE EAST & AFRICA 
             10.5.1 MIDDLE EAST & AFRICA: IDENTITY THREAT DETECTION AND RESPONSE MARKET DRIVERS
             10.5.2 MARKET IN MIDDLE EAST & AFRICA: RECESSION IMPACT
                       TABLE 133 MIDDLE EAST & AFRICA: MARKET, BY OFFERING, 2022–2029 (USD MILLION)
                       TABLE 134 MIDDLE EAST & AFRICA: MARKET, BY SERVICE, 2022–2029 (USD MILLION)
                       TABLE 135 MIDDLE EAST & AFRICA: MARKET, BY DEPLOYMENT MODE, 2022–2029 (USD MILLION)
                       TABLE 136 MIDDLE EAST & AFRICA: MARKET, BY ORGANIZATION SIZE, 2022–2029 (USD MILLION)
                       TABLE 137 MIDDLE EAST & AFRICA: MARKET, BY SOLUTION, 2022–2029 (USD MILLION)
                       TABLE 138 MIDDLE EAST & AFRICA: MARKET, BY VERTICAL, 2022–2029 (USD MILLION)
                       TABLE 139 MIDDLE EAST & AFRICA: MARKET, BY SUB REGION, 2022–2029 (USD MILLION)
             10.5.3 GULF COOPERATION COUNCIL (GCC)
                       TABLE 140 GULF COOPERATION COUNCIL (GCC): IDENTITY THREAT DETECTION AND RESPONSE MARKET, BY OFFERING, 2022–2029 (USD MILLION)
                       TABLE 141 GULF COOPERATION COUNCIL (GCC): MARKET, BY SERVICE, 2022–2029 (USD MILLION)
                       TABLE 142 GULF COOPERATION COUNCIL (GCC): MARKET, BY DEPLOYMENT MODE, 2022–2029 (USD MILLION)
                       TABLE 143 GULF COOPERATION COUNCIL (GCC): MARKET, BY ORGANIZATION SIZE, 2022–2029 (USD MILLION)
                       TABLE 144 GULF COOPERATION COUNCIL (GCC): MARKET, BY SOLUTION, 2022–2029 (USD MILLION)
                       TABLE 145 GULF COOPERATION COUNCIL (GCC): MARKET, BY VERTICAL, 2022–2029 (USD MILLION)
                       TABLE 146 GULF COOPERATION COUNCIL (GCC): MARKET, BY SUB REGION, 2022–2029 (USD MILLION)
             10.5.4 KSA
                       TABLE 147 KSA: IDENTITY THREAT DETECTION AND RESPONSE MARKET, BY OFFERING, 2022–2029 (USD MILLION)
                       TABLE 148 KSA: MARKET, BY SERVICE, 2022–2029 (USD MILLION)
                       TABLE 149 KSA: MARKET, BY DEPLOYMENT MODE, 2022–2029 (USD MILLION)
                       TABLE 150 KSA: MARKET, BY ORGANIZATION SIZE, 2022–2029 (USD MILLION)
                       TABLE 151 KSA: MARKET, BY SOLUTION, 2022–2029 (USD MILLION)
                       TABLE 152 KSA: MARKET, BY VERTICAL, 2022–2029 (USD MILLION)
             10.5.5 UAE
                       10.5.5.1 Smart city initiatives and evolving regulatory frameworks to fuel market growth
                                   TABLE 153 UAE: MARKET, BY OFFERING, 2022–2029 (USD MILLION)
                                   TABLE 154 UAE: MARKET, BY SERVICE, 2022–2029 (USD MILLION)
                                   TABLE 155 UAE: MARKET, BY DEPLOYMENT MODE, 2022–2029 (USD MILLION)
                                   TABLE 156 UAE: MARKET, BY ORGANIZATION SIZE, 2022–2029 (USD MILLION)
                                   TABLE 157 UAE: MARKET, BY SOLUTION, 2022–2029 (USD MILLION)
                                   TABLE 158 UAE: MARKET, BY VERTICAL, 2022–2029 (USD MILLION)
             10.5.6 REST OF GCC COUNTRIES
                       TABLE 159 REST OF GCC COUNTRIES: IDENTITY THREAT DETECTION AND RESPONSE MARKET, BY OFFERING, 2022–2029 (USD MILLION)
                       TABLE 160 REST OF GCC COUNTRIES: MARKET, BY SERVICE, 2022–2029 (USD MILLION)
                       TABLE 161 REST OF GCC COUNTRIES: MARKET, BY DEPLOYMENT MODE, 2022–2029 (USD MILLION)
                       TABLE 162 REST OF GCC COUNTRIES: MARKET, BY ORGANIZATION SIZE, 2022–2029 (USD MILLION)
                       TABLE 163 REST OF GCC COUNTRIES: MARKET, BY SOLUTION, 2022–2029 (USD MILLION)
                       TABLE 164 REST OF GCC COUNTRIES: MARKET, BY VERTICAL, 2022–2029 (USD MILLION)
             10.5.7 SOUTH AFRICA
                       TABLE 165 SOUTH AFRICA: IDENTITY THREAT DETECTION AND RESPONSE MARKET, BY OFFERING, 2022–2029 (USD MILLION)
                       TABLE 166 SOUTH AFRICA: MARKET, BY SERVICE, 2022–2029 (USD MILLION)
                       TABLE 167 SOUTH AFRICA: MARKET, BY DEPLOYMENT MODE, 2022–2029 (USD MILLION)
                       TABLE 168 SOUTH AFRICA: MARKET, BY ORGANIZATION SIZE, 2022–2029 (USD MILLION)
                       TABLE 169 SOUTH AFRICA: MARKET, BY SOLUTION, 2022–2029 (USD MILLION)
                       TABLE 170 SOUTH AFRICA: MARKET, BY VERTICAL, 2022–2029 (USD MILLION)
             10.5.8 REST OF MIDDLE EAST & AFRICA
                       TABLE 171 REST OF MIDDLE EAST & AFRICA: MARKET, BY OFFERING, 2022–2029 (USD MILLION)
                       TABLE 172 REST OF MIDDLE EAST & AFRICA: MARKET, BY SERVICE, 2022–2029 (USD MILLION)
                       TABLE 173 REST OF MIDDLE EAST & AFRICA: MARKET, BY DEPLOYMENT MODE, 2022–2029 (USD MILLION)
                       TABLE 174 REST OF MIDDLE EAST & AFRICA: MARKET, BY ORGANIZATION SIZE, 2022–2029 (USD MILLION)
                       TABLE 175 REST OF MIDDLE EAST & AFRICA: MARKET, BY SOLUTION, 2022–2029 (USD MILLION)
                       TABLE 176 REST OF MIDDLE EAST & AFRICA: MARKET, BY VERTICAL, 2022–2029 (USD MILLION)
     10.6 LATIN AMERICA 
             10.6.1 LATIN AMERICA: IDENTITY THREAT DETECTION AND RESPONSE MARKET DRIVERS
             10.6.2 MARKET IN LATIN AMERICA: RECESSION IMPACT
                       TABLE 177 LATIN AMERICA: MARKET, BY OFFERING, 2022–2029 (USD MILLION)
                       TABLE 178 LATIN AMERICA: MARKET, BY SERVICE, 2022–2029 (USD MILLION)
                       TABLE 179 LATIN AMERICA: MARKET, BY DEPLOYMENT MODE, 2022–2029 (USD MILLION)
                       TABLE 180 LATIN AMERICA: MARKET, BY ORGANIZATION SIZE, 2022–2029 (USD MILLION)
                       TABLE 181 LATIN AMERICA: MARKET, BY SOLUTION, 2022–2029 (USD MILLION)
                       TABLE 182 LATIN AMERICA: MARKET, BY VERTICAL, 2022–2029 (USD MILLION)
                       TABLE 183 LATIN AMERICA: MARKET, BY COUNTRY, 2022–2029 (USD MILLION)
             10.6.3 BRAZIL
                       10.6.3.1 Digital transformations to scale market growth
                                   TABLE 184 BRAZIL: IDENTITY THREAT DETECTION AND RESPONSE MARKET, BY OFFERING, 2022–2029 (USD MILLION)
                                   TABLE 185 BRAZIL: MARKET, BY SERVICE, 2022–2029 (USD MILLION)
                                   TABLE 186 BRAZIL: MARKET, BY DEPLOYMENT MODE, 2022–2029 (USD MILLION)
                                   TABLE 187 BRAZIL: MARKET, BY ORGANIZATION SIZE, 2022–2029 (USD MILLION)
                                   TABLE 188 BRAZIL: MARKET, BY SOLUTION, 2022–2029 (USD MILLION)
                                   TABLE 189 BRAZIL: MARKET, BY VERTICAL, 2022–2029 (USD MILLION)
             10.6.4 MEXICO
                       10.6.4.1 Increasing focus on digital transformation and compliance with data privacy regulations to amplify demand for ITDR solutions
                                   TABLE 190 MEXICO: MARKET, BY OFFERING, 2022–2029 (USD MILLION)
                                   TABLE 191 MEXICO: MARKET, BY SERVICE, 2022–2029 (USD MILLION)
                                   TABLE 192 MEXICO: MARKET, BY DEPLOYMENT MODE, 2022–2029 (USD MILLION)
                                   TABLE 193 MEXICO: MARKET, BY ORGANIZATION SIZE, 2022–2029 (USD MILLION)
                                   TABLE 194 MEXICO: MARKET, BY SOLUTION, 2022–2029 (USD MILLION)
                                   TABLE 195 MEXICO: MARKET, BY VERTICAL, 2022–2029 (USD MILLION)
             10.6.5 REST OF LATIN AMERICA
                       TABLE 196 REST OF LATIN AMERICA: IDENTITY THREAT DETECTION AND RESPONSE MARKET, BY OFFERING, 2022–2029 (USD MILLION)
                       TABLE 197 REST OF LATIN AMERICA: MARKET, BY SERVICE, 2022–2029 (USD MILLION)
                       TABLE 198 REST OF LATIN AMERICA: MARKET, BY DEPLOYMENT MODE, 2022–2029 (USD MILLION)
                       TABLE 199 REST OF LATIN AMERICA: MARKET, BY ORGANIZATION SIZE, 2022–2029 (USD MILLION)
                       TABLE 200 REST OF LATIN AMERICA: MARKET, BY SOLUTION, 2022–2029 (USD MILLION)
                       TABLE 201 REST OF LATIN AMERICA: MARKET, BY VERTICAL, 2022–2029 (USD MILLION)
 
11 COMPETITIVE LANDSCAPE (Page No. - 178)
     11.1 OVERVIEW 
     11.2 STRATEGIES ADOPTED BY KEY PLAYERS/RIGHT TO WIN 
               TABLE 202 OVERVIEW OF STRATEGIES ADOPTED BY KEY IDENTITY THREAT DETECTION AND RESPONSE VENDORS
     11.3 REVENUE ANALYSIS 
               FIGURE 35 SEGMENTAL REVENUE ANALYSIS OF TOP FIVE IDENTITY THREAT DETECTION AND RESPONSE MARKET PLAYERS, 2019–2023 (USD MILLION)
     11.4 COMPANY VALUATION AND FINANCIAL METRICS 
               FIGURE 36 MARKET: COMPANY EVALUATION AND FINANCIAL METRIC
     11.5 IDENTITY THREAT DETECTION AND RESPONSE MARKET SHARE ANALYSIS 
               FIGURE 37 SHARE OF LEADING COMPANIES IN MARKET SHARE, 2023
               TABLE 203 MARKET: DEGREE OF COMPETITION
     11.6 BRAND COMPARISON 
               FIGURE 38 MARKET: COMPARISON OF VENDORS’ BRANDS
     11.7 COMPANY EVALUATION MATRIX: KEY PLAYERS 
             11.7.1 STARS
             11.7.2 EMERGING LEADERS
             11.7.3 PERVASIVE PLAYERS
             11.7.4 PARTICIPANTS
                       FIGURE 39 COMPANY EVALUATION MATRIX: KEY PLAYERS, 2024
             11.7.5 COMPANY FOOTPRINT:KEY PLAYERS
                       11.7.5.1 Offering footprint
                                   TABLE 204 MARKET: OFFERING FOOTPRINT
                       11.7.5.2 Deployment Mode footprint
                                   TABLE 205 MARKET: DEPLOYMENT MODE FOOTPRINT
                       11.7.5.3 Vertical footprint
                                   TABLE 206 MARKET: VERTICAL FOOTPRINT
                       11.7.5.4 Regional footprint
                                   TABLE 207 IDENTITY THREAT DETECTION AND RESPONSE MARKET: REGIONAL FOOTPRINT
                       11.7.5.5 Company footprint
                                   FIGURE 40 MARKET: OVERALL COMPANY FOOTPRINT
     11.8 COMPANY EVALUATION MATRIX: STARTUPS/SMES 
             11.8.1 PROGRESSIVE COMPANIES
             11.8.2 RESPONSIVE COMPANIES
             11.8.3 DYNAMIC COMPANIES
             11.8.4 STARTING BLOCKS
                       FIGURE 41 COMPANY EVALUATION MATRIX: STARTUPS/SMES, 2024
             11.8.5 COMPETITIVE BENCHMARKING FOR STARTUPS/SMES, 2024
                       11.8.5.1 Detailed list of key startups/SMES
                                   TABLE 208 IDENTITY THREAT DETECTION AND RESPONSE MARKET: KEY STARTUPS/SMES
                       11.8.5.2 COMPETITIVE BENCHMARKING OF KEY STARTUPS/SMES
                                   TABLE 209 MARKET: COMPETITIVE BENCHMARKING OF KEY STARTUPS/SMES
     11.9 COMPETITIVE SCENARIO 
             11.9.1 PRODUCT LAUNCHES
                       TABLE 210 MARKET: PRODUCT LAUNCHES, MARCH 2022–APRIL 2024
             11.9.2 DEALS
                       TABLE 211 IDENTITY THREAT DETECTION AND RESPONSE MARKET: DEALS, MAY 2021–MARCH 2024
 
12 COMPANY PROFILES (Page No. - 203)
     12.1 KEY PLAYERS 
(Business Overview, Products/Solutions/Services offered, Recent Developments, MnM View)*
             12.1.1 MICROSOFT
                       TABLE 212 MICROSOFT: BUSINESS OVERVIEW
                       FIGURE 42 MICROSOFT: COMPANY SNAPSHOT
                       TABLE 213 MICROSOFT: PRODUCTS/SOLUTIONS/SERVICES OFFERED
                       TABLE 214 MICROSOFT: PRODUCT LAUNCHES, JANUARY 2021–FEBRUARY 2024
                       TABLE 215 MICROSOFT: DEALS, JANUARY 2021–FEBRUARY 2024
             12.1.2 IBM
                       TABLE 216 IBM: BUSINESS OVERVIEW
                       FIGURE 43 IBM: COMPANY SNAPSHOT
                       TABLE 217 IBM: PRODUCTS/SOLUTIONS/SERVICES OFFERED
                       TABLE 218 IBM: PRODUCT LAUNCHES, JANUARY 2021–FEBRUARY 2024
                       TABLE 219 IBM: DEALS, JANUARY 2021–FEBRUARY 2024
             12.1.3 CROWDSTRIKE
                       TABLE 220 CROWDSTRIKE: BUSINESS OVERVIEW
                       FIGURE 44 CROWDSTRIKE: COMPANY SNAPSHOT
                       TABLE 221 CROWDSTRIKE: PRODUCTS/SOLUTIONS/SERVICES OFFERED
                       TABLE 222 CROWDSTRIKE: PRODUCT LAUNCHES, JANUARY 2021–FEBRUARY 2024
                       TABLE 223 CROWDSTRIKE: DEALS, JANUARY 2021–FEBRUARY 2024
             12.1.4 ZSCALER
                       TABLE 224 ZSCALER: BUSINESS OVERVIEW
                       FIGURE 45 ZSCALER: COMPANY SNAPSHOT
                       TABLE 225 ZSCALER: PRODUCTS/SOLUTIONS/SERVICES OFFERED
                       TABLE 226 ZSCALER: PRODUCT LAUNCHES, JANUARY 2021–FEBRUARY 2024
                       TABLE 227 ZSCALER: DEALS, JANUARY 2021–FEBRUARY 2024
             12.1.5 TENABLE
                       TABLE 228 TENABLE: BUSINESS OVERVIEW
                       FIGURE 46 TENABLE: COMPANY SNAPSHOT
                       TABLE 229 TENABLE: PRODUCTS/SOLUTIONS/SERVICES OFFERED
                       TABLE 230 TENABLE: PRODUCT LAUNCHES, JANUARY 2021–FEBRUARY 2024
                       TABLE 231 TENABLE: DEALS, JANUARY 2021–FEBRUARY 2024
             12.1.6 VARONIS
                       TABLE 232 VARONIS: BUSINESS OVERVIEW
                       FIGURE 47 VARONIS: COMPANY SNAPSHOT
                       TABLE 233 VARONIS: PRODUCTS/SOLUTIONS/SERVICES OFFERED
                       TABLE 234 VARONIS: PRODUCT LAUNCHES, JANUARY 2021–FEBRUARY 2024
             12.1.7 BEYONDTRUST
                       TABLE 235 BEYONDTRUST: BUSINESS OVERVIEW
                       TABLE 236 BEYONDTRUST: PRODUCTS/SOLUTIONS/SERVICES OFFERED
                       TABLE 237 BEYONDTRUST: PRODUCT LAUNCHES, JANUARY 2021–FEBRUARY 2024
                       TABLE 238 BEYONDTRUST: DEALS, JANUARY 2021–FEBRUARY 2024
             12.1.8 CYBERARK
                       TABLE 239 CYBERARK: BUSINESS OVERVIEW
                       FIGURE 48 CYBERARK: COMPANY SNAPSHOT
                       TABLE 240 CYBERARK: PRODUCTS/SOLUTIONS/SERVICES OFFERED
                       TABLE 241 CYBERARK: PRODUCT LAUNCHES, JANUARY 2021–FEBRUARY 2024
                       TABLE 242 CYBERARK: DEALS, JANUARY 2021–FEBRUARY 2024
             12.1.9 PROOFPOINT
                       TABLE 243 PROOFPOINT: BUSINESS OVERVIEW
                       TABLE 244 PROOFPOINT: PRODUCTS/SOLUTIONS/SERVICES OFFERED
                       TABLE 245 PROOFPOINT: DEALS, JANUARY 2021–FEBRUARY 2024
             12.1.10 QUEST
                                   TABLE 246 QUEST: BUSINESS OVERVIEW
                                   TABLE 247 QUEST: PRODUCTS/SOLUTIONS/SERVICES OFFERED
             12.1.11 OORT (CISCO)
                                   TABLE 248 OORT: BUSINESS OVERVIEW
                                   TABLE 249 OORT: PRODUCTS/SOLUTIONS/SERVICES OFFERED
                                   TABLE 250 OORT: PRODUCT LAUNCHES, JANUARY 2021–FEBRUARY 2024
                                   TABLE 251 OORT: DEALS, JANUARY 2021–FEBRUARY 2024
             12.1.12 SENTINELONE
*Details on Business Overview, Products/Solutions/Services offered, Recent Developments, MnM View might not be captured in case of unlisted companies.
     12.2 OTHER PLAYERS 
             12.2.1 VECTRA
             12.2.2 PROFICIO
             12.2.3 QOMPLX
             12.2.4 ADAPTIVE SHIELD
             12.2.5 ACALVIO
             12.2.6 AUTHOMIZE
             12.2.7 ILLUSIVE
             12.2.8 MINDFIRE
             12.2.9 REZONATE
             12.2.10 SEMPERIS
             12.2.11 SILVERFORT
             12.2.12 STEALTHBITS
             12.2.13 VERICLOUDS
             12.2.14 MICROMINDER
             12.2.15 QUORUM CYBER
             12.2.16 MIXMODE
 
13 ADJACENT MARKETS (Page No. - 261)
     13.1 INTRODUCTION TO ADJACENT MARKETS 
               TABLE 252 ADJACENT MARKETS AND FORECASTS
     13.2 LIMITATIONS 
             13.2.1 IDENTITY AND ACCESS MANAGEMENT MARKET
                       TABLE 253 IDENTITY AND ACCESS MANAGEMENT MARKET, BY TYPE, 2017–2022 (USD MILLION)
                       TABLE 254 IDENTITY AND ACCESS MANAGEMENT MARKET, BY TYPE, 2023–2028 (USD MILLION)
                       TABLE 255 IDENTITY AND ACCESS MANAGEMENT MARKET, BY OFFERING, 2017–2022 (USD MILLION)
                       TABLE 256 IDENTITY AND ACCESS MANAGEMENT MARKET, BY OFFERING, 2023–2028 (USD MILLION)
             13.2.2 DIGITAL IDENTITY SOLUTIONS MARKET
                       TABLE 257 DIGITAL IDENTITY SOLUTIONS MARKET, BY OFFERING, 2017–2022 (USD MILLION)
                       TABLE 258 DIGITAL IDENTITY SOLUTIONS MARKET, BY OFFERING, 2023–2028 (USD MILLION)
                       TABLE 259 DIGITAL IDENTITY SOLUTIONS MARKET, BY SOLUTION TYPE, 2017–2022 (USD MILLION)
                       TABLE 260 DIGITAL IDENTITY SOLUTIONS MARKET, BY SOLUTION TYPE, 2023–2028 (USD MILLION)
                       TABLE 261 SECURITY TESTING MARKET, BY ORGANIZATION SIZE, 2014–2019 (USD MILLION)
                       TABLE 262 SECURITY TESTING MARKET, BY ORGANIZATION SIZE, 2020–2025 (USD MILLION)
                       TABLE 263 SECURITY TESTING MARKET, BY VERTICAL, 2014–2019 (USD MILLION)
                       TABLE 264 SECURITY TESTING MARKET, BY VERTICAL, 2020–2025 (USD MILLION)
                       TABLE 265 SECURITY TESTING MARKET, BY REGION, 2014–2019 (USD MILLION)
                       TABLE 266 SECURITY TESTING MARKET, BY REGION, 2020–2025 (USD MILLION)
 
14 APPENDIX (Page No. - 267)
     14.1 DISCUSSION GUIDE 
     14.2 KNOWLEDGESTORE: MARKETSANDMARKETS’ SUBSCRIPTION PORTAL 
     14.3 CUSTOMIZATION OPTIONS 
     14.4 RELATED REPORTS 
     14.5 AUTHOR DETAILS 

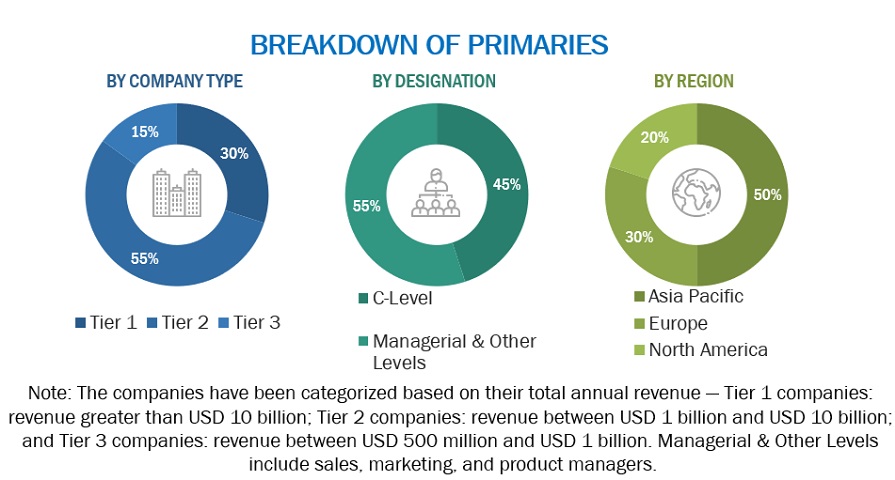
The research study involved significant activities in estimating the identity threat detection and response market size. Exhaustive secondary research utilized various secondary sources about the market and peer markets. To gather information for analyzing the identity threat detection and response market. The next step has been to validate these findings and assumptions and size them with the help of primary research with industry experts across the value chain. Primary sources included interviews with industry experts, suppliers, manufacturers, and other stakeholders across the market's value chain. These interviews with key industry figures and subject matter experts aimed to gather qualitative and quantitative data, ensuring accuracy and reliability in assessing market trends and prospects. Both top-down and bottom-up approaches have been used to estimate the market size. Post which the market breakdown and data triangulation have been adopted to estimate the market sizes of segments and sub-segments.

Secondary Research

In the secondary research process, various secondary sources were referred to identify and collect information for the study. These included journals, annual reports, press releases, investor presentations of companies and white papers, certified publications, and articles from recognized associations and government publishing sources. Secondary research was mainly used to obtain critical information about industry insights, the market's monetary chain, the overall pool of key players, market classification, and segmentation according to industry trends to the bottom-most level, regional markets, and key developments from both market and technology-oriented perspectives.

Primary Research

In the primary research process, various primary sources from both the supply and demand sides were interviewed to obtain qualitative and quantitative information for the report. The primary sources from the supply side included industry experts, such as Chief Executive Officers (CEOs), Chief Technology Officers (CTOs), Chief Operating Officers (COOs), Vice Presidents (VPs), marketing directors, technology and innovation directors, and related key executives from various companies and organizations operating in the identity threat detection and response market. The primary sources from the demand side included consultants/specialists, Chief Information Officers (CIOs), and subject-matter experts.
Identity Threat Detection and Response (ITDR)Market  Market Size, and Share

To know about the assumptions considered for the study, download the pdf brochure

Market Size Estimation

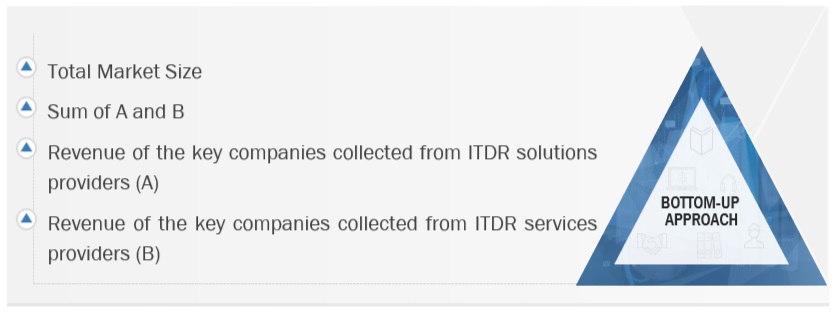
Multiple approaches were adopted to estimate and forecast the identity threat detection and response market. The first approach involved estimating the market size by summating companies' revenue generated through identity threat detection and response solutions.

Both top-down and bottom-up approaches were used to estimate and validate the total size of the identity threat detection and response market. The research methodology used to estimate the market size includes the following:

  • Key players in identity threat detection and response were identified through secondary research, and their revenue contributions in the respective regions were determined through primary and secondary research
  • Regarding value, primary and secondary research have determined the industry's supply chain and market size.
  • All percentage shares, splits, and breakups have been determined using secondary sources and verified through primary sources.

All the possible parameters that impact the market covered in this research study have been accounted for, viewed in extensive detail, verified through primary research, and analyzed to get the final quantitative and qualitative data. This data is consolidated and added with detailed inputs and analysis from MarketsandMarkets.

Market Size Estimation Methodology-Bottom-up approach
Identity Threat Detection and Response (ITDR)Market  Market Bottom Up Approach

To know about the assumptions considered for the study, Request for Free Sample Report

Market Size Estimation Methodology-top-down approach

Identity Threat Detection and Response (ITDR)Market  Market Top Down Approach

Data Triangulation

The data triangulation procedures were used to complete the overall market engineering process and arrive at the exact statistics for all segments and subsegments. The data was triangulated by studying various factors and trends from the demand and supply sides. Along with data triangulation and market breakdown, the market size was validated by the top-down and bottom-up approaches.

Market Definition

Identity threat detection and response (ITDR) is propelled by the continuously evolving global threat landscape and combating threat-targeting identities and identity systems. ITDR provides response strategies ensuring the protection of sensitive and confidential data. It monitors suspicious activities using User Behavior Analytics, Risk-Based Authentication, Managed Detection and Response (MDR), and Threat Intelligence services. Government initiatives promoting digital identity frameworks drive widespread ITDR adoption, fostering innovation and ensuring citizens have secure, portable digital identities.

Key Stakeholders

  • Government bodies and public safety agencies
  • Project managers
  • Developers
  • Business analysts
  • Quality Assurance (QA)/test engineers
  • Consulting firms
  • Third-party vendors
  • Investors and venture capitalists
  • Technology providers

The main objectives of this study are as follows:

  • To describe and forecast the global identity threat detection and response market by offering, deployment mode, organization size, vertical, and region
  • To forecast the market size of five central regions: North America, Europe, Asia Pacific (APAC), Middle East and Africa (MEA), and Latin America
  • To analyze the subsegments of the market concerning individual growth trends, prospects, and contributions to the overall market
  • To provide detailed information related to significant factors (drivers, restraints, opportunities, and challenges) influencing the growth of the market
  • To analyze the opportunities in the market for stakeholders and provide the competitive landscape details of major players
  • To profile the key players of the identity threat detection and response market and comprehensively analyze their market shares and core competencies
  • To track and analyze competitive developments, such as Mergers and Acquisitions (M&A), new product developments, and partnerships and collaborations in the market
  • To track and analyze the impact of COVID-19 on the identity threat detection and response market

Available Customizations

With the given market data, MarketsandMarkets offers customizations per the company's specific needs. The following customization options are available for the report:

Company Information

  • Detailed analysis and profiling of additional market players (up to 5)
Custom Market Research Services

We will customize the research for you, in case the report listed above does not meet with your exact requirements. Our custom research will comprehensively cover the business information you require to help you arrive at strategic and profitable business decisions.

Request Customization
Report Code
TC 9016
Published ON
May, 2024
Choose License Type
BUY NOW
  • SHARE
X
Request Customization
Speak to Analyst
Speak to Analyst
OR FACE-TO-FACE MEETING
PERSONALIZE THIS RESEARCH
  • Triangulate with your Own Data
  • Get Data as per your Format and Definition
  • Gain a Deeper Dive on a Specific Application, Geography, Customer or Competitor
  • Any level of Personalization
REQUEST A FREE CUSTOMIZATION
LET US HELP YOU!
  • What are the Known and Unknown Adjacencies Impacting the Identity Threat Detection and Response (ITDR) Market
  • What will your New Revenue Sources be?
  • Who will be your Top Customer; what will make them switch?
  • Defend your Market Share or Win Competitors
  • Get a Scorecard for Target Partners
CUSTOMIZED WORKSHOP REQUEST
+1-888-600-6441
  • Call Us
  • +1-888-600-6441 (Corporate office hours)
  • +1-888-600-6441 (US/Can toll free)
  • +44-800-368-9399 (UK office hours)
CONNECT WITH US
ABOUT TRUST ONLINE
©2024 MarketsandMarkets Research Private Ltd. All rights reserved
DMCA.com Protection Status Website Feedback