Industrial Display Market by Type (Rugged Displays, Open Frame, Panel-Mount, Marine, Video Walls), Technology, Panel Size, Application (HMI, Remote Monitoring, Interactive Display, Digital Signage), Vertical and Geography - Global Forecast to 2022


The industrial display market is experiencing significant growth, driven by increasing demand for reliable and durable displays in sectors like manufacturing, energy, transportation, and healthcare. Industrial displays, known for their robust design, high durability, and ability to function in harsh environments, are essential for monitoring and controlling complex systems. Key trends shaping this market include the adoption of advanced technologies such as touchscreen interfaces, 4K resolution, and wide temperature range displays that ensure clarity and responsiveness in critical applications. Furthermore, the rise of smart factories and industrial IoT is propelling demand for displays that can seamlessly integrate with networked systems, offering real-time data visualization and remote monitoring capabilities. As industries continue to digitize and automate, the industrial display market is set for strong growth, supported by the need for reliable display solutions that enhance operational efficiency and safety in various industrial applications.
The industrial display market was valued at USD 4.09 billion in 2016 and is estimated to reach USD 5.87 billion by 2022, at a CAGR of 6.18% during the forecast period. The base year used for this study is 2016, and the forecast period considered is between 2017 and 2022.
Industrial display devices use various technologies such as LED, LCD, OLED, and others that drive the electronics sectors. In the industrial sector, industrial displays are used in various fields such as automotive, oil & gas, and pharmaceuticals. They are used in many industrial applications such as industrial touchscreen monitors, digital signage, and interactive display systems.
Market Dynamics
Drivers
- Technological shift and development of high specification display devices
- High growth of LED-backlit LCD-based display solutions
- Rising demand for HMI devices
- Growing adoption of IoT
Restraints
- High costs pertaining to the acquisition and implementation of industrial displays
Opportunities
- Growing demand from digital signage applications
Challenges
- Manufacturing equipment suitable for all weathers in outdoor applications
Technological shift and development of high specification display devices
The industrial display market witnessed significant technological advancements in the past decade. The traditional display devices that are based on cathode ray tube (CRT) technology were bulky and space-consuming, hence, it could not meet the requirements of the industrial applications. Eventually, display devices evolved from being bulky and space-consuming to slim and have a thin bezel. These display devices now come with various advance features such as high resolution, durability, environmental stability, readability, wide temperature range, rugged, improved contrast ratio, higher display brightness, and low-power consumption. This has led the development of industrial displays which are suitable for industries such as oil & gas, mining, power generation, food & beverages, pharmaceuticals, and chemicals where the environment is hazardous and catastrophic. High competition in the industrial display market has led to the development and launch of products with high-end specifications.
The objectives of the study are as follows:
- To define, describe, and forecast the industrial display market segmented on the basis of type, technology, panel size, application, vertical, and region
- To forecast the market size, in terms of value, for various segments with regard to 4 main regions—North America, Europe, Asia Pacific (APAC), and Rest of the World (RoW)
- To provide detailed information regarding the market dynamics influencing the growth of the market (drivers, restraints, opportunities, and challenges)
- To strategically profile the key players and comprehensively analyze their market ranking and core competencies along with detailing the competitive landscape for the market leaders
- To study the complete value chain and allied industry segments and perform a value chain analysis of the global industrial display landscape
- To analyze strategic developments such as joint ventures, mergers & acquisitions, product developments, and research and development (R&D) in the industrial display market
The industrial display market was valued at USD 4.09 billion in 2016 and is expected to reach USD 5.87 billion by 2022, at a CAGR of 6.18% during the forecast period. The factors such as , rising demand for HMI devices, high growth of LED-backlit LCD-based display solutions, and growing adoption of IoT are expected to drive the growth of this market.
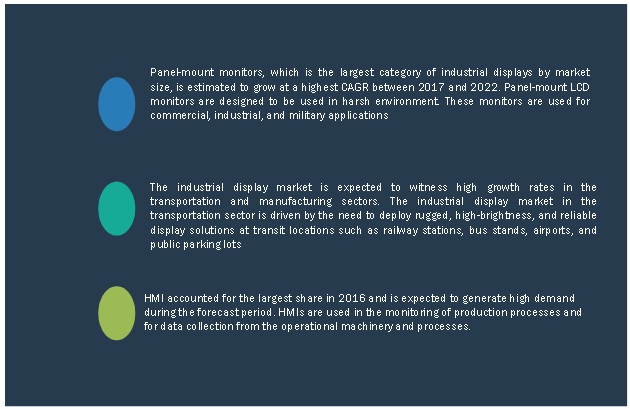
The scope of this report covers the industrial display market on the basis of type, technology, panel size, application, vertical, and geography. Panel-mount monitors held the largest market size in 2016. Panel-mount monitors are widely used for in industrial applications for displaying various parameters including the current production status, equipment uptime, and inventory levels.
The LCD technology accounted for the largest share of the overall industrial display market in 2016. Products such flat-panel displays, desktop monitors, industrial PCs, and some video walls are using LCD technology. This is responsible for driving this market.
The products with panel size range of 14–21" held the largest market for industrial displays in 2016. These include terminal monitors, public signage, and digital displays.
The HMI application accounted for the largest market size for industrial displays. HMIs are especially significant in the oil & gas industry where understanding rough ambient conditions, extreme temperatures, a high degree of pollution and operation is not only a key primarily to safety but also to improving profitability.
The manufacturing vertical accounted for the largest share of the overall industrial display market in 2016. HMIs and industrial PCs that used in the manufacturing industry drives the industrial display market.
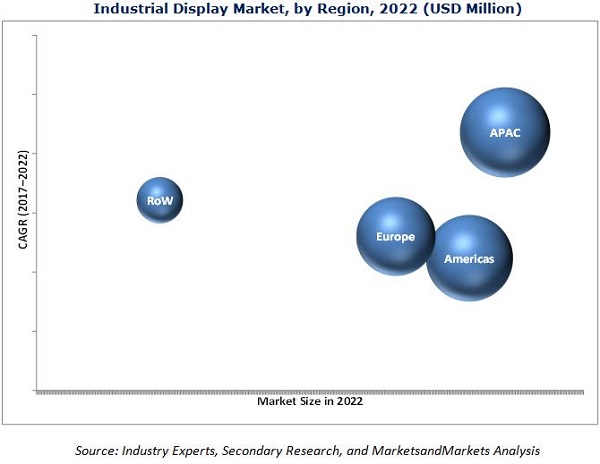
Source: Industry Experts, Secondary Research, and MarketsandMarkets Analysis
Industrial display applications in energy & power and transportation drive the growth of industrial display market
Energy & Power
Rapid industrialization, infrastructural development, and integration of advanced technologies by various industries, the demand for energy & power are increasing worldwide. High demand for energy can be achieved by more stabilized electricity production that requires higher plant performance and flexibility. This enables the plant operator to monitor and control the plant more efficiently. Various industrial displays such as HMIs, industrial PCs, and video walls are widely used for power generation in power plants such as thermal, hydro, nuclear, and solar. Industrial displays such as HMIs and industrial PCs connect many energy systems and are used for data acquisition, energy measurement, and instigating procedures to enhance the production of energy.
Transportation
Industrial displays assist customers to make reservations, find out the prices of tickets, get schedules of arrival and departure, and receive updates on current service status of reservation in the transportation sector. Also, they enable wayfinding for travelers and advertise brands, permitting the provider to quickly and efficiently communicate to the customer the requirements for traveling. In the transportation sector, signage systems are usually integrated with many different technologies that can retain information about schedules and reservations on a real-time basis. Industrial products for the transportation sector are industrial digital signage, public information industrial displays, and industrial kiosks, among others. These industrial displays are used in transportation vertical such as in train, buses, roads, and airports. It also used for system control, entertainment, cockpit for navigation, advertising, and others.
Critical questions the report answers:
- Who are the major current and potential competitors in industrial display market and what are their strategies, and developments?
- What opportunities open frame monitors offers in the industrial display market?
“To discuss the above findings with the analyst, please click the Speak to Analyst tab provided above.”
North America held the largest market size for industrial displays in 2016. The region has strong demand for display technologies and automation solutions from manufacturing, and oil & gas verticals.
The key restraining factor for the growth of the industrial display market is high costs pertaining to the acquisition and implementation of industrial displays. This report describes the drivers, restraints, opportunities, and challenges pertaining to the industrial display market. In addition, it analyzes the current scenario and forecasts the market till 2022, including the market segmentation based on type, technology, panel size, application, vertical, and geography.
Some of the key players present in this market are Samsung Display Co., Ltd. (South Korea), LG Display Co., Ltd. (South Korea), and Planar Systems, Inc. (US), NEC Display Solutions (Japan), and Advantech, Inc. (US).
To speak to our analyst for a discussion on the above findings, click Speak to Analyst
 Exclusive indicates content/data unique to MarketsandMarkets and not available with any competitors.
Table of Contents
1 Introduction (Page No. - 16)
1.1 Objectives of the Study
1.2 Market Definition
1.3 Market Scope
1.3.1 Markets Covered
1.3.2 Years Considered for the Study
1.4 Currency
1.5 Limitations
1.6 Package Size
1.7 Stakeholders
2 Research Methodology (Page No. - 20)
2.1 Research Data
2.1.1 Secondary Data
2.1.1.1 Secondary Sources
2.1.2 Primary Data
2.1.2.1 Primary Sources
2.1.2.2 Key Industry Insights
2.1.2.3 Breakdown of Primaries
2.2 Market Size Estimation
2.2.1 Bottom-Up and Top-Down Approach
2.2.2 Bottom-Up Approach
2.2.2.1 Approach for Capturing the Market Share By Bottom-Up Analysis (Demand Side)
2.2.3 Top-Down Approach
2.2.3.1 Approach for Capturing the Market Share By Top-Down Analysis (Supply Side)
2.3 Market Breakdown and Data Triangulation
2.4 Research Assumptions
3 Executive Summary (Page No. - 30)
4 Premium Insights (Page No. - 35)
4.1 Lucrative Opportunities in the Industrial Display Market
4.2 Market: Comparison of Growth Pattern of Industrial Display Types
4.3 Market in APAC
4.4 Market Share of Major Countries and Regions
4.5 Market, By Application
5 Market Overview (Page No. - 38)
5.1 Introduction
5.2 Market Dynamics
5.2.1 Market Drivers
5.2.1.1 Technological Shift and Development of High Specification Display Devices
5.2.1.2 High Growth of LED-Backlit LCD-Based Display Solutions
5.2.1.3 Rising Demand for HMI Devices
5.2.1.4 Growing Adoption of Iot
5.2.2 Market Restraints
5.2.2.1 High Costs Pertaining to the Acquisition and Implementation of Industrial Displays
5.2.3 Market Opportunities
5.2.3.1 Growing Demand From Digital Signage Applications
5.2.4 Market Challenges
5.2.4.1 Designing Equipment for All Weather Conditions in Outdoor Applications
6 Industry Trends (Page No. - 45)
6.1 Introduction
6.2 Value Chain Analysis
6.3 Standard Ratings for Industrial Displays
6.3.1 Ingress Protection (IP) Rating
6.3.2 National Electrical Manufacturers Association (NEMA) Ratings
7 Industrial Display Market, By Type (Page No. - 50)
7.1 Introduction
7.2 Rugged Displays
7.3 Open Frame Monitors
7.4 Panel-Mount Monitors
7.5 Marine Displays
7.6 Video Wall
8 Industrial Display Market, By Technology (Page No. - 70)
8.1 Introduction
8.2 LCD
8.3 LED
8.3.1 Full Array
8.3.2 Edge Lit
8.3.3 Direct Lit
8.4 OLED
8.4.1 PMOLED Display
8.4.2 AMOLED Display
8.5 E-Paper Display
9 Industrial Display Market, By Panel Size (Page No. - 76)
9.1 Introduction
9.2 Up to 14"
9.3 14–21"
9.4 21–40"
9.5 40" and Above
10 Industrial Display Market, By Application (Page No. - 81)
10.1 Introduction
10.2 HMI
10.3 Remote Monitoring
10.4 Interactive Display (Kiosk)
10.5 Digital Signage
10.6 Imaging
11 Industrial Display Market, By Verticals (Page No. - 90)
11.1 Introduction
11.2 Manufacturing
11.3 Energy & Power
11.4 Oil & Gas
11.5 Metals & Mining
11.6 Transportation
12 Industrial Display Market, By Geography (Page No. - 99)
12.1 Introduction
12.2 North America
12.2.1 US
12.2.2 Canada
12.2.3 Mexico
12.3 Europe
12.3.1 Uk
12.3.2 Germany
12.3.3 France
12.3.4 Rest of Europe
12.4 APAC
12.4.1 China
12.4.2 Japan
12.4.3 South Korea
12.4.4 Rest of APAC
12.5 Rest of World (RoW)
12.5.1 South America
12.5.2 Middle East
12.5.3 Africa
13 Competitive Landscape (Page No. - 121)
13.1 Introduction
13.2 Vendor Dive Overview
13.2.1 Vanguard
13.2.2 Dynamic
13.2.3 Innovator
13.2.4 Emerging
13.3 Business Strategy Scorecard (For All 25 Companies)
13.4 Product Offering Scorecard (For All 25 Companies)
*Top 25 Companies Analyzed for This Study are - Samsung Electronics, LG Electronics, Panasonic Corporation, NEC Display Solutions, Planar Systems Inc, Innolux Corp., AU Optronics Corp., Sharp Corporation, Pepperl+Fuchs, Advantech Co. Ltd., General Electric, Schneider Electric SE, Siemens AG, Rockwell Automation, Comark, Ais, Rs Components, Amongo, Q-Vio, Agile Display Solutions, Adlink, Winmate, Qisda, Aplus Displays Technology Co. Ltd, Inducomp
13.5 Market Ranking Analysis, 2016
13.6 Competitive Situations and Trends
14 Company Profiles (Page No. - 128)
(Business Overview, Products Offered & Services Strategies, Key Insights, Recent Developments, MnM View)*
14.1 Introduction
14.2 Samsung Electronics Co., Ltd.
14.3 LG Display Co., Ltd.
14.4 Panasonic Corporation
14.5 NEC Display Solutions Ltd.
14.6 Planar Systems, Inc.
14.7 Innolux Corp.
14.8 AU Optronics Corp.
14.9 Sharp Corp.
14.10 Pepperl+Fuchs
14.11 Advantech Co., Ltd.
14.12 General Electric
14.13 Schneider Electric SE
14.14 Siemens AG
14.15 Rockwell Automation Inc.
*Details on Business Overview, Products Offered & Services Strategies, Key Insights, Recent Developments, MnM View Might Not Be Captured in Case of Unlisted Companies.
15 Appendix (Page No. - 177)
15.1 Insights of Industry Experts
15.2 Discussion Guide
15.3 Knowledge Store: Marketsandmarkets’ Subscription Portal
15.4 Introducing RT: Real-Time Market Intelligence
15.5 Available Customizations
15.6 Related Reports
15.7 Author Details
List of Tables (65 Tables)
Table 1 First Digit: Solids
Table 2 Second Digit: Liquids
Table 3 NEMA Standards: Electrical Enclosure Types
Table 4 Industrial Display Market, By Type, 2014–2022 (USD Million)
Table 5 Industrial Display for Rugged Displays, By Value and Volume, 2014–2022
Table 6 Industrial Display for Rugged Displays, By Technology, 2014–2022 (USD Million)
Table 7 Industrial Display for Rugged Displays, By Panel Size, 2014–2022 (USD Million)
Table 8 Industrial Display for Rugged Displays, By Application, 2014–2022 (USD Million)
Table 9 Industrial Display for Rugged Displays, By Vertical, 2014–2022 (USD Million)
Table 10 Industrial Display for Rugged Displays, By Region, 2014–2022 (USD Million)
Table 11 Industrial Display for Open Frame Monitors, By Value and Volume, 2014–2022
Table 12 Industrial Display for Open Frame Monitors, By Technology, 2014–2022 (USD Million)
Table 13 Industrial Display for Open Frame Monitors, By Panel Size, 2014–2022 (USD Million)
Table 14 Industrial Display for Open Frame Monitors, By Application, 2014–2022 (USD Million)
Table 15 Industrial Display for Open Frame Monitors, By Vertical, 2014–2022 (USD Million)
Table 16 Industrial Display for Open Frame Monitors, By Region, 2014–2022 (USD Million)
Table 17 Industrial Display for Panel-Mount Monitors, By Value and Volume, 2014–2022
Table 18 Industrial Display for Panel-Mount Monitors, By Technology, 2014–2022 (USD Million)
Table 19 Industrial Display for Panel-Mount Monitors, By Panel Size, 2014–2022 (USD Million)
Table 20 Industrial Display for Panel-Mount Monitors, By Application, 2014–2022 (USD Million)
Table 21 Industrial Display for Panel-Mount Monitors, By Vertical, 2014–2022 (USD Million)
Table 22 Industrial Display for Panel-Mount Monitors, By Region, 2014–2022 (USD Million)
Table 23 Industrial Display for Marine Displays, By Value and Volume, 2014–2022
Table 24 Industrial Display for Marine Displays, By Technology, 2014–2022 (USD Million)
Table 25 Industrial Display for Marine Displays, By Panel Size, 2014–2022 (USD Million)
Table 26 Industrial Display for Marine Displays, By Application, 2014–2022 (USD Million)
Table 27 Industrial Display for Marine Displays, By Vertical, 2014–2022 (USD Million)
Table 28 Industrial Display for Marine Displays, By Region, 2014–2022 (USD Million)
Table 29 Industrial Display for Video Walls, By Value and Volume, 2014–2022
Table 30 Industrial Display for Video Walls, By Technology, 2014–2022 (USD Million)
Table 31 Industrial Display for Video Walls, By Application, 2014–2022 (USD Million)
Table 32 Industrial Display for Video Walls, By Vertical, 2014–2022 (USD Million)
Table 33 Industrial Display for Video Walls, By Region, 2014–2022 (USD Million)
Table 34 Industrial Display Market, By Technology, 2014–2022 (USD Million)
Table 35 Industrial Display Market, By Panel Size, 2014–2022 (USD Million)
Table 36 Industrial Display Market, By Application, 2014–2022 (USD Million)
Table 37 Industrial Display for HMI, By Region, 2014–2022 (USD Million)
Table 38 Industrial Display for Remote Monitoring, By Region, 2014–2022 (USD Million)
Table 39 Industrial Display for Interactive Display, By Region, 2014–2022 (USD Million)
Table 40 Industrial Display for Digital Signage, By Region, 2014–2022 (USD Million)
Table 41 Industrial Display for Imaging, By Region, 2014–2022 (USD Million)
Table 42 Industrial Display Market, By Vertical, 2014–2022 (USD Million)
Table 43 Industrial Display for Manufacturing, By Region, 2014–2022 (USD Million)
Table 44 Industrial Display for Energy & Power, By Region, 2014–2022 (USD Million)
Table 45 Industrial Display for Oil & Gas, By Region, 2014–2022 (USD Million)
Table 46 Industrial Display for Metals & Mining, By Region, 2014–2022 (USD Million)
Table 47 Industrial Display for Transportation, By Region, 2014–2022 (USD Million)
Table 48 Industrial Display Market, By Region, 2014–2022 (USD Million)
Table 49 Market in North America, By Type, 2014–2022 (USD Million)
Table 50 Market in North America, By Application, 2014–2022 (USD Million)
Table 51 Market in North America, By Vertical, 2014–2022 (USD Million)
Table 52 Market in North America, By Country, 2014–2022 (USD Million)
Table 53 Market in Europe, By Type, 2014–2022 (USD Million)
Table 54 Market in Europe, By Application, 2014–2022 (USD Million)
Table 55 Market in Europe, By Vertical, 2014–2022 (USD Million)
Table 56 Industrial Display Market in Europe, By Country, 2014–2022 (USD Million)
Table 57 Market in APAC, By Type, 2014–2022 (USD Million)
Table 58 Market in APAC, By Application, 2014–2022 (USD Million)
Table 59 Market in APAC, By Vertical, 2014–2022 (USD Million)
Table 60 Market in APAC, By Country, 2014–2022 (USD Million)
Table 61 Market in RoW, By Type, 2014–2022 (USD Million)
Table 62 Market in RoW, By Application, 2014–2022 (USD Million)
Table 63 Industrial Display Market in RoW, By Vertical, 2014–2022 (USD Million)
Table 64 Market in RoW, By Country, 2014–2022 (USD Million)
Table 65 Market Ranking of the Top 5 Players in the Industrial Display Market, 2016
List of Figures (79 Figures)
Figure 1 Market: Process Flow of Market Size Estimation
Figure 2 Industrial Display Market: Research Design
Figure 3 Market Size Estimation Meth0dology: Bottom-Up Approach
Figure 4 Market Size Estimation Meth0dology: Top-Down Approach
Figure 5 Data Triangulation
Figure 6 Assumptions of the Research Study
Figure 7 Market (2017 vs 2022): Panel-Mount Monitors to Hold the Largest Market Size During the Forecast Period
Figure 8 Transportation Vertical to Witness High Growth Rate in the Market During the Forecast Period
Figure 9 Interactive Display Application to Witness the Highest Growth Rate in the Market Between 2017 and 2022
Figure 10 North America to Account for the Largest Share of Market During the Forecast Period
Figure 11 Increasing Demand From HMI Application Would Create Opportunities for the Market Between 2017 and 2022
Figure 12 Open Frame Monitors to Grow at the Highest Rate During the Forecast Period
Figure 13 China Held the Largest Share of the Industrial Display Market in APAC in 2016
Figure 14 US Held the Largest Market Share of Industrial Displays Market in 2016
Figure 15 HMI Application to Hold the Largest Size of the Industrial Display Market During the Forecast Period
Figure 16 Technological Advancements in Display Devices and Demand From HMI Applications Driving the Growth of the Industrial Display Market
Figure 17 Value Chain Analysis: Industrial Display Market
Figure 18 Panel-Mount Monitors to Hold the Largest Market Size in the Industrial Display Market Between 2017 and 2022
Figure 19 Manufacturing Vertical is Expected to Witness the Largest Market Size in Rugged Displays During the Forecast Period
Figure 20 HMI Application to Hold the Largest Market Size for Open Frame Monitors in 2017
Figure 21 LCD Technology to Dominate the Panel-Mount Monitors Market During the Forecast Period
Figure 22 Marine Displays With Panel Size of Up to 14" are Expected to Witness Highest CAGR During the Forecast Period
Figure 23 Manufacturing Vertical to Hold the Largest Market Size for Video Walls Between 2017 and 2022
Figure 24 LCD Technology Expected to Dominate the Industrial Display Market During the Forecast Period
Figure 25 Industrial Displays With Panel Size 14–21" to Hold the Largest Market Size Between 2017 and 2022
Figure 26 Interactive Display Would Generate Highest CAGR for Industrial Displays During the Forecast Period
Figure 27 Industrial Display for HMI Application to Witness High Demand From APAC Region During the Forecast Period
Figure 28 Interactive Display Application of Industrial Display to Be in Highest Demand From APAC Region Between 2017 and 2022
Figure 29 Manufacturing Vertical to Hold the Largest Market Size of the Industrial Display Market Between 2017 and 2022
Figure 30 RoW to Witness the Highest Growth in the Market in Manufacturing
Figure 31 North America to Account for the Largest Share of the Market During the Forecast Period
Figure 32 US Accounted for the Largest Share of the Market in 2016
Figure 33 Attractive Growth Opportunities for Market in APAC During the Forecast Period
Figure 34 North America Market Snapshot, 2016
Figure 35 Europe Market Snapshot, 2016
Figure 36 APAC Market Snapshot, 2016
Figure 37 RoW Market Snapshot, 2016
Figure 38 Leading Companies in the Industrial Display Market Mostly Adopted Organic Growth Strategies
Figure 39 Dive Chart
Figure 40 Geographic Revenue Mix of the Top 5 Players
Figure 41 Samsung Electronics Co. Ltd.: Company Snapshot
Figure 42 Samsung Electronics Co., Ltd. Product Offering
Figure 43 Samsung Electronics Co., Ltd. Business Strategy
Figure 44 LG Display Co., Ltd.: Company Snapshot
Figure 45 LG Display Co., Ltd.: Product Offering
Figure 46 LG Display Co., Ltd.: Business Strategy
Figure 47 Panasonic Corporation: Company Snapshot
Figure 48 Panasonic Corporation: Product Offering
Figure 49 Panasonic Corporation: Business Strategy
Figure 50 NEC Display Solutions Ltd.: Product Offering
Figure 51 NEC Display Solutions Ltd.: Business Strategy
Figure 52 Planar Systems, Inc.: Product Offering
Figure 53 Planar Systems, Inc.: Business Strategy
Figure 54 Innolux Corp.: Company Snapshot
Figure 55 Innolux Corp.: Product Offering
Figure 56 Innolux Corp.: Business Strategy
Figure 57 AU Optronics Corp.: Company Snapshot
Figure 58 AU Optronics Corp.: Product Offering
Figure 59 AU Optronics Corp.: Business Strategy
Figure 60 Sharp Corp.: Company Snapshot
Figure 61 Sharp Corp.: Product Offering
Figure 62 Sharp Corp.: Business Strategy
Figure 63 Pepperl+Fuchs: Product Offering
Figure 64 Pepperl+Fuchs: Business Strategy
Figure 65 Advantech Co., Ltd.: Company Snapshot
Figure 66 Advantech Co., Ltd.: Product Offering
Figure 67 Advantech Co., Ltd.: Business Strategy
Figure 68 General Electric: Company Snapshot
Figure 69 General Electric: Product Offering
Figure 70 General Electric: Business Strategy
Figure 71 Schneider Electric SE: Company Snapshot
Figure 72 Schneider Electric SE: Product Offering
Figure 73 Schneider Electric SE: Business Strategy
Figure 74 Siemens AG: Company Snapshot
Figure 75 Siemens AG: Product Offering
Figure 76 Siemens AG: Business Strategy
Figure 77 Rockwell Automation: Company Snapshot
Figure 78 Rockwell Automation Inc.: Product Offering
Figure 79 Rockwell Automation Inc.: Business Strategy
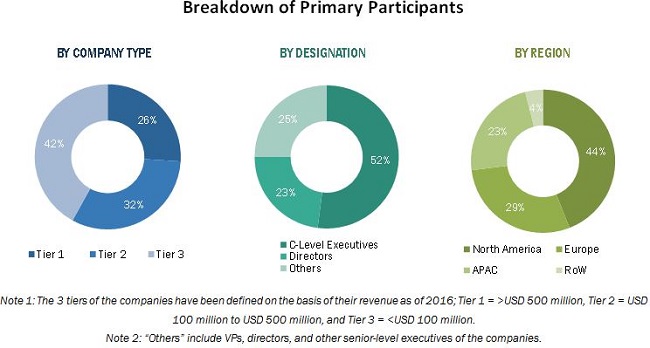
The research methodology used to estimate and forecast the industrial display market begins with obtaining data on key vendor revenues through secondary research. Some of the secondary sources used in this research include information from various journals and databases such as IEEE journals, Factiva, Hoover’s, and OneSource. The vendor offerings have also been taken into consideration to determine the market segmentation. The bottom-up procedure has been employed to arrive at the overall size of the global industrial display market from the revenues of the key players in the market. After arriving at the overall market size, the total market has been split into several segments and subsegments, which have then been verified through primary research by conducting extensive interviews with people holding key positions in the industry such as CEOs, VPs, directors, and executives. The market breakdown and data triangulation procedures have been employed to complete the overall market engineering process and arrive at the exact statistics for all segments and subsegments. The breakdown of the profiles of primaries has been depicted in the figure below:
To know about the assumptions considered for the study, download the pdf brochure
Note 1: The 3 tiers of the companies have been defined on the basis of their revenue as of 2016; Tier 1 = > USD 500 million, Tier 2 = USD 100 million to USD 500 million, and Tier 3 = < USD 100 million.>
Note 2: “Others” include VPs, directors, and other senior-level executives of the companies.
The industrial display market ecosystem includes industrial display manufacturers and solutions providers such as Samsung Display Co., Ltd. (South Korea), LG Display Co., Ltd. (South Korea), Panasonic Corporation (Japan), Advantech Co., Ltd. (Taiwan), and NEC Display Solutions (Japan) who offer display solutions to industrial applications.
Major Market Developments
- In February 2017, Samsung Display announced a SMART signage line-up that includes the quantum dot light-emitting diode (QLED) signage ultra-high-definition (UHD) displays and fine pixel pitch IF Series LED signage. The QLED signage UHD displays (55" and 65" models) have an extensive and detailed viewing feature.
- In January 2017, LG launched 55" FHD transparent OLED displays, 77" UHD double-sided OLED displays, and pillar-type commercial displays that combine six 77" UHD OLED panels.
Target Audience:
- Original equipment manufacturers (OEMs)
- OEM technology solution providers
- Research institutes
- Market research and consulting firms
- Forums, alliances, and associations
- Technology investors
- Governments and financial institutions
- Analysts and strategic business planners
- End users who want to know more about the technology and the latest technological developments in the industry
“The study answers several questions for the target audiences, primarily which market segments to focus on in the next two to five years for prioritizing the efforts and investments.”
Report Scope:
In this report, the industrial display market has been segmented into the following categories, which have been detailed below:
Industrial Display Market, by Type
-
- Rugged Displays
- Open Frame Monitors
- Panel-Mount Monitors
- Marine Displays
- Video Walls
Industrial Display Market, by Technology
-
- LCD
- LED
- OLED
- E-Paper Display
Industrial Display Market, by Panel Size
-
- Introduction
- Up to 14"
- 14–21"
- 21 –40"
- 40" and above
Industrial Display Market, by Application
-
- Introduction
- HMI
- Remote Monitoring
- Interactive Display (Kiosk)
- Digital Signage
- Imaging
Industrial Display Market, by Vertical
-
- Introduction
- Manufacturing
- Energy & Power
- Oil & Gas
- Metals & Mining
- Transportation
Geographic Analysis
-
- North America
- Europe
- Asia Pacific (APAC)
- Rest of the World (RoW)
Competitive Landscape: Market ranking analysis
Company Profiles: Detailed analysis of the major companies present in the industrial display market
Available Customizations:
With the given market data, MarketsandMarkets offers customizations according to the company’s specific needs. The following customization options are available for the report:
Company Information
Detailed analysis and profiling of additional market players (up to five)


Growth opportunities and latent adjacency in Industrial Display Market