IVD Market in BRIC by Product & Service (Instruments, Reagents, Software), Technology (Immunoassay, Hematology, Microbiology), Application (Diabetes, Cardiology, Infectious Diseases), Country (Brazil, Russia, India, China) - Global Forecast to 2022


[278 Pages Report] The BRIC IVD Market and other emerging countries is expected to reach USD 15.71 Billion by 2022 from USD 10.60 Billion in 2017, at a CAGR of 8.2%. The key factors driving the growth of the market are growing patient awareness of personalized medicine, increasing prevalence of lifestyle and chronic diseases, growth in the number of private diagnostic centers, and improving healthcare system in emerging countries. However, market growth is restrained by the lack of reimbursement and the slow growth of the economy in some emerging countries.
This research study involved the extensive use of both primary and secondary data sources as well as various factors affecting the industry, including the regulatory landscape; competitive scenario; historic data; current trends in the market; technological innovations and upcoming technologies; and market drivers, restraints, opportunities, and challenges.
In this report, the BRIC In Vitro Diagnostics (IVD) Market is segmented by product & service, technology, application, end user, and country. Based on application, the market is segmented into diabetes, infectious diseases, oncology/cancer, cardiology, HIV/AIDS, autoimmune diseases, nephrology, drug testing/pharmacogenomics, and others. The infectious diseases segment accounted for the largest share of the market in 2016, owing to the rising incidence of tuberculosis (TB), hepatitis, and hospital-acquired infections.
Based on technology, the BRIC IVD Market is broadly segmented into immunoassays/immunochemistry, clinical chemistry, molecular diagnostics, hematology, clinical microbiology, coagulation & hemostasis, and other technologies. The Molecular Diagnostics segment is estimated to register the highest CAGR during the forecast period of 2017 to 2022. The rising prevalence of infectious diseases, cancer, and various genetic disorders; growing demand for blood screening; and increasing application of molecular diagnostic technologies in pharmacogenetics and point-of-care testing is expected to drive the growth of the market during the forecast period.
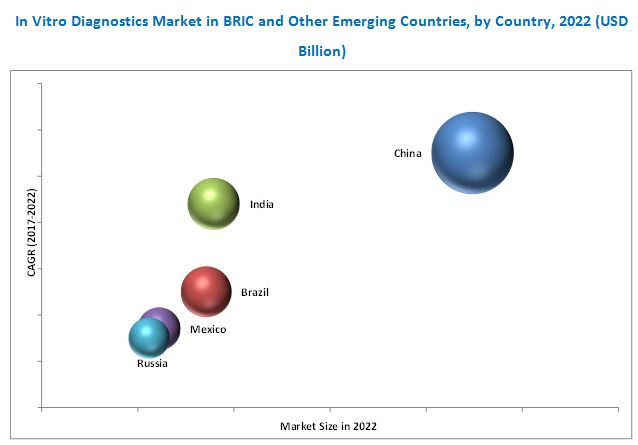
Geographically, China dominated the BRIC IVD Market and other emerging countries in 2016. The large share of this country can be attributed to rising healthcare expenditure, increasing acceptance of personalized medicine, and increasing awareness towards technologically advanced products in this country. China is also expected to register the highest CAGR, due to the growth in research activities and increasing investments by leading players and government agencies in the country.
The key players in this BRIC IVD Market are Roche Diagnostics (Switzerland), Abbott Laboratories Inc. (U.S.), Siemens Healthineers (Germany), Danaher Corporation (U.S.), Thermo Fisher Scientific Inc. (U.S.), Sysmex Corporation (Japan), Bio-Rad Laboratories, Inc. (U.S.), bioMérieux (France), and Becton, Dickinson and Company (U.S.), Johnson & Johnson (U.S.), QIAGEN N.V. (Germany), Ortho-Clinical Diagnostics, Inc. (U.S.), and Diasorin S.P.A. (Italy).
Target Audience
- IVD product manufacturers
- Group purchase organizations (GPOs)
- Original equipment manufacturers (OEM)
- Pathologists and pathology laboratories
- Distributors of IVD products
- Hospitals and clinics
- Healthcare institutions
- Research institutes
- Market research and consulting Firms
Scope of the Report
This research report categorizes the BRIC IVD Market and other emerging countries into the following segments:
BRIC IVD Market, by Product & Service
- Reagents & Kits
- Instruments
- Services
- Data Management Software
BRIC IVD Market, by Technology
-
Clinical Chemistry
- Basic Metabolic Panel
- Electrolyte Panel
- Liver Panel
- Lipid Profile
- Renal Profile
- Thyroid Function Panel
- Specialty Chemical Tests
-
Immunochemistry/Immunoassay
-
Enzyme-Linked Immunosorbent Assay (ELISA)
- Chemiluminescence Immunoassay (CLIA)
- Fluorescence Immunoassay (FIA)
- Colorimetric Immunoassay (CI)
- Radioimmunoassays (RIA)
- Rapid Tests
- Western Blot
- ELISPOT
-
Enzyme-Linked Immunosorbent Assay (ELISA)
- Hematology
- Coagulation & Hemostasis
- Clinical Microbiology
-
Molecular Diagnostics (MDx)
- Polymerase Chain Reaction (PCR)
- Isothermal Nucleic Acid Amplification Technology (INAAT)
- Microarrays
- Hybridization
- DNA Sequencing & Next-generation Sequencing
- Other MDx technologies
- Other Technologies
BRIC IVD Market, by Application
- Diabetes
- Infectious Diseases
- Oncology/Cancer
- Cardiology
- Nephrology
- Autoimmune Diseases
- Drug Testing
- HIV/Aids
- Other Applications
BRIC IVD Market, by End User
- Hospital-based Laboratories
- Clinical/Reference Laboratories
- Academic Institutes
- Point-of-care Testing
- Patient Self-Testing
- Other End Users
BRIC IVD Market and Other Emerging Countries, by Country
- Russia
- Turkey
- China
- India
- South Korea
- Indonesia
- Malaysia
- Thailand
- Brazil
- Mexico
- Argentina
- Colombia
- Chile
- Saudi Arabia
Available Customizations:
With the given market data, MarketsandMarkets offers customizations as per the company’s specific needs. The following customization options are available for the report:
Product Analysis
- Product matrix, which gives a detailed comparison of the product portfolios of each company
Market Size Analysis
- Detailed market size analysis of additional emerging countries (Up to 5)
Market Share Analysis
- Detailed market share analysis of market players (Up to 5)
Company Information
- Detailed analysis and profiling of additional market players (Up to 5)
Please click here to get the updated version of In-Vitro Diagnostic (IVD) Market (Applications, End-users & Types) Trends & Global Forecasts (Major & Emerging Markets – G7, Japan & BRIC) (2011 - 2016)
The BRIC IVD Market is estimated to reach USD 15.71 Billion by 2022, at a CAGR of 8.2% during the forecast period. The growing patient awareness of personalized medicine, increase in prevalence of chronic diseases due to lifestyle, and rise in demand for point-of-care testing are driving market growth. Improving healthcare system in emerging markets and growing significance of Companion Diagnostics presents significant growth opportunities for players in the market. However, the lack of reimbursement and the slow growth of the economy are the major restraining factors for the growth of the market in Latin America.
In this report, the BRIC In Vitro Diagnostics (IVD) Market is segmented on the basis of product & service, technology, application, end user, and country. The research report discusses key market drivers, restraints, opportunities, and challenges in the BRIC IVD Market countries and its submarkets. Based on product & service, the market is segmented into reagents & kits, instruments, services, and data management software. The reagents & kits segment accounted for the largest share of the market in 2016; it is also expected to grow at the highest CAGR during the forecast period. Accessibility to a wide range of reagents and the need for reliable, specific, and faster detection of chronic diseases and genetic disorders at early stages are expected to drive the growth of this segment.
Based on end user, BRIC IVD Market is segmented into hospital-based laboratories, clinical/reference laboratories, academic institutes, point-of-care testing, patient self-testing, and other end users. The hospital-based laboratories segment accounted for the largest share of the market in 2016. The large share of this segment can be attributed to the large number of diagnostic tests carried out in hospitals.
In this report, the BRIC IVD Market countries has been studied at the country level. In 2016, China represented the largest BRIC IVD Market countries, followed by Brazil. It is also expected to register the highest growth during the forecast period. The growth of this geographic segment is driven by improving healthcare infrastructure, significant economic development in China, and rising focus of key market players in this emerging country.
The major BRIC IVD Market in the BRIC IVD Market and other emerging countries are Roche Diagnostics (Switzerland), Abbott Laboratories Inc. (U.S.), Siemens Healthineers (Germany), Danaher Corporation (U.S.), Thermo Fisher Scientific Inc. (U.S.), Sysmex Corporation (Japan), Bio-Rad Laboratories, Inc. (U.S.), bioMérieux (France), Becton, Dickinson and Company (U.S.), Johnson & Johnson (U.S.), QIAGEN N.V. (Germany), Ortho-Clinical Diagnostics, Inc. (U.S.), and Diasorin S.P.A. (Italy).
 Exclusive indicates content/data unique to MarketsandMarkets and not available with any competitors.
Table of Contents
1 Introduction (Page No. - 20)
1.1 Objectives of the Study
1.2 Market Definition
1.3 Market Scope
1.3.1 Markets Covered
1.3.2 Years Considered for the Study
1.4 Currency
1.5 Limitations
1.6 Stakeholders
2 Research Methodology (Page No. - 24)
2.1 Research Data
2.1.1 Secondary Data
2.1.1.1 Key Data From Secondary Sources
2.1.2 Primary Data
2.1.2.1 Key Data From Primary Sources
2.1.2.2 Key Industry Insights
2.2 Market Size Estimation
2.3 Market Breakdown and Data Triangulation
2.4 Assumptions for the Study
3 Executive Summary (Page No. - 31)
4 Premium Insights (Page No. - 39)
4.1 IVD Market in Emerging Countries: Market Overview
4.2 IVD in Emerging Countries, By Product & Service
5 Industry Insights (Page No. - 41)
5.1 Introduction
5.2 Industry Trends
5.2.1 High Focus of IVD Players on China
5.2.2 Microfluidics-Based POC and LOC Diagnostic Devices for Laboratory Testing
5.2.3 Rise in Number of Reagent Rental Agreements
5.3 Regulatory Overview
5.3.1 China
5.3.2 India
5.3.3 Malaysia
5.3.4 Thailand
5.3.5 Indonesia
5.3.6 Russia
5.3.7 Saudi Arabia
5.3.8 Mexico
5.3.9 South Korea
6 BRIC IVD Market Overview (Page No. - 49)
6.1 Introduction
6.2 Market Dynamics
6.2.1 Market Drivers
6.2.1.1 Rising Incidence of Chronic Lifestyle Diseases
6.2.1.2 Rapid Growth in the Geriatric Population
6.2.1.3 Increasing Adoption of Point-Of-Care Testing
6.2.1.4 Growing Awareness of Personalized Medicine
6.2.1.5 Growth in the Number of Private Diagnostic Centers
6.2.2 Market Restraints
6.2.2.1 Inadequate Reimbursement
6.2.2.2 Economic Slowdown in Latin America
6.2.3 Market Opportunities
6.2.3.1 Improving Healthcare Systems in Emerging Markets
6.2.3.2 Growing Significance of Companion Diagnostics
6.2.4 Market Challenges
6.2.4.1 Stringent Regulatory Framework in Latin America
6.2.4.2 Operational Barriers to the Use of Diagnostic Tests
7 BRIC IVD Market, By Product & Service (Page No. - 60)
7.1 Introduction
7.2 Reagents & Kits
7.3 Instruments
7.4 Data Management Systems/Software
7.5 Services
8 BRIC IVD Market, By Technology (Page No. - 71)
8.1 Introduction
8.2 Immunoassay/Immunochemistry
8.2.1 Enzyme-Linked Immunosorbent Assay
8.2.1.1 Chemiluminescence Immunoassays
8.2.1.2 Fluorescence Immunoassays
8.2.1.3 Colorimetric Immunoassays
8.2.2 Radioimmunoassay
8.2.3 Rapid Tests
8.2.4 Western Blot
8.2.5 Enzyme-Linked Immunospot Assay
8.3 Clinical Chemistry
8.3.1 Basic Metabolic Panel
8.3.2 Electrolyte Panel
8.3.3 Liver Panel
8.3.4 Lipid Profile
8.3.5 Renal Profile
8.3.6 Thyroid Function Panel
8.3.7 Specialty Chemical Tests
8.4 Molecular Diagnostics
8.4.1 Polymerase Chain Reaction
8.4.2 Isothermal Nucleic Acid Amplification Technology
8.4.3 Microarrays
8.4.4 Hybridization
8.4.5 DNA Sequencing & Next-Generation Sequencing
8.4.6 Other Molecular Diagnostic Technologies
8.5 Clinical Microbiology
8.6 Hematology
8.7 Coagulation and Hemostasis
8.8 Other IVD Technologies
9 BRIC IVD Market, By Application (Page No. - 110)
9.1 Introduction
9.2 Diabetes
9.3 Infectious Diseases
9.4 Oncology/Cancer
9.5 Cardiology
9.6 Nephrology
9.7 Autoimmune Diseases
9.8 Drug Testing/Pharmacogenomics
9.9 HIV/AIDS
9.10 Other Applications
10 BRIC IVD Market, By End User (Page No. - 127)
10.1 Introduction
10.2 Hospital-Based Laboratories
10.3 Clinical/Reference Laboratories
10.4 Point-Of-Care Testing
10.5 Patient Self-Testing
10.6 Academic Institutes
10.7 Other End Users
11 Geographic Analysis: BRIC IVD Market (Page No. - 137)
11.1 Introduction
11.2 China
11.3 India
11.4 Russia
11.5 Brazil
11.6 Mexico
11.7 Argentina
11.8 Colombia
11.9 Chile
11.10 South Korea
11.11 Turkey
11.12 Saudi Arabia
11.13 Thailand
11.14 Malaysia
11.15 Indonesia
12 BRIC IVD Market Competitive Landscape (Page No. - 184)
12.1 Introduction
12.2 Vanguards
12.3 Innovators
12.4 Emerging
12.5 Dynamic
12.6 Competitive Benchmarking
*Top 13 Companies Analysed for This Study are - Roche Diagnostics (Switzerland), Siemens Healthineers (Germany), Thermo Fisher Scientific Inc. (U.S.), Danaher Corporation (U.S.), Abbott Laboratories Inc. (U.S.), Biomerieux SA (France), Bio-Rad Laboratories Inc. (U.S.), Johnson and Johnson Inc.(U.S.), Sysmex Corporation (Japan), Becton, Dickinson and Company (U.S.), Ortho Clinical Diagnostics Inc. (U.S.), Diasorin S.P.A. (Italy), Qiagen N.V. (Germany), Erba Diagnostics, Inc. (India), Mindray Medical International Limited (China), Hologic Inc. (U.S.), Illumina Inc. (U.S.), Werfen Life Group S.A. (Spain), A.Menarini Diagnostics Ltd. (U.K.), Quidel Corporation (U.S.), Span Divergent Ltd. (India), Trinity Biotech PLC. (Republic of Ireland)
13 Company Profiles (Page No. - 188)
(Overview, Products and Services, Financials, Strategy & Development)*
13.1 Roche Diagnostics
13.2 Abbott Laboratories, Inc.
13.3 Becton, Dickinson and Company
13.4 Biomérieux SA
13.5 Bio-Rad Laboratories, Inc.
13.6 Danaher Corporation
13.7 Johnson & Johnson Services, Inc.
13.8 Ortho-Clinical Diagnostics, Inc.
13.9 Qiagen N.V.
13.10 Sysmex Corporation
13.11 Thermo Fisher Scientific Inc.
13.12 Siemens AG
13.13 Diasorin S.P.A.
*Details on Overview, Products and Services, Financials, Strategy & Development Might Not Be Captured in Case of Unlisted Companies.
14 Appendix (Page No. - 267)
14.1 Insights of Industry Experts
14.2 Discussion Guide
14.3 Knowledge Store: Marketsandmarkets’ Subscription Portal
14.4 Introducing RT: Real-Time Market Intelligence
14.5 Available Customizations
14.6 Related Reports
14.7 Author Details
List of Tables (138 Tables)
Table 1 IVD Market in Emerging Countries: Market Snapshot (2017 vs 2022)
Table 2 China: Time, Cost, and Complexity of Registration Process
Table 3 India: Time, Cost, and Complexity of Registration Process
Table 4 Malaysia: Classification of IVD Products
Table 5 Thailand: Registration Process for IVD Devices
Table 6 Indonesia: Registration Process for IVD Devices
Table 7 Russia: Classification of IVD Devices
Table 8 Saudi Arabia: Time, Cost, and Complexity of Registration Process
Table 9 Mexico: Time, Cost, and Complexity of Registration Process
Table 10 South Korea: Time, Cost, and Complexity of Registration Process
Table 11 Number of People With Diabetes, By Region, 2015 vs 2040 (Million Individuals)
Table 12 Impact Analysis: Market Drivers
Table 13 Impact Analysis: Market Restraints
Table 14 Impact Analysis: Market Opportunities
Table 15 Impact Analysis: Market Challenges
Table 16 IVD Market Size in Emerging Countries, By Product & Service, 2015–2022 (USD Million)
Table 17 IVD Data Management Systems/Software Offerings By Key Market Players
Table 18 IVD Reagents & Kits Market Size, By Country, 2015–2022 (USD Million)
Table 19 IVD Instrument Offerings By Key Market Players
Table 20 IVD Instruments Market Size, By Country, 2015–2022 (USD Million)
Table 21 IVD Data Management Systems/Software Offerings By Key Market Players
Table 22 IVD Data Management Systems/Software Market Size, By Country, 2015–2022 (USD Million)
Table 23 IVD Service Offerings By Key Market Players
Table 24 IVD Services Market Size, By Country, 2015–2022 (USD Million)
Table 25 IVD Market Size in Emerging Countries, By Technology, 2015–2022 (USD Million)
Table 26 IVD Market Size for Immunoassay/Immunochemistry, By Country, 2015–2022 (USD Million)
Table 27 Enzyme-Linked Immunosorbent Assay Market Size, By Country, 2015–2022 (USD Million)
Table 28 Chemiluminescence Immunoassays Market Size, By Country, 2015–2022 (USD Million)
Table 29 Fluorescence Immunoassays Market Size, By Country, 2015–2022 (USD Million)
Table 30 Colorimetric Immunoassays Market Size, By Country, 2015–2022 (USD Million)
Table 31 Radioimmunoassay Market Size, By Country, 2015–2022 (USD Million)
Table 32 Rapid Tests Market Size, By Country, 2015–2022 (USD Million)
Table 33 Western Blot Market Size, By Country, 2015–2022 (USD Million)
Table 34 Enzyme-Linked Immunospot Assay Market Size, By Country, 2015–2022 (USD Million)
Table 35 IVD Market Size for Clinical Chemistry, By Country, 2015–2022 (USD Million)
Table 36 IVD Market Size for Clinical Chemistry, By Test Type, 2015–2022 (USD Million)
Table 37 Basic Metabolic Panel Market Size, By Country, 2015–2022 (USD Million)
Table 38 Electrolyte Panel Market Size, By Country, 2015–2022 (USD Million)
Table 39 Liver Panel Market Size, By Country, 2015–2022 (USD Million)
Table 40 Lipid Profile Market Size, By Country, 2015–2022 (USD Million)
Table 41 Renal Profile Market Size, By Country, 2015–2022 (USD Million)
Table 42 Thyroid Function Panel Market Size, By Country, 2015–2022 (USD Million)
Table 43 Specialty Chemical Tests Market Size, By Country, 2015–2022 (USD Million)
Table 44 IVD Market Size for Molecular Diagnostics, By Country, 2015–2022 (USD Million)
Table 45 IVD Market Size for Molecular Diagnostics, By Technology, 2015–2022 (USD Million)
Table 46 Polymerase Chain Reaction Market Size, By Country, 2015–2022 (USD Million)
Table 47 Isothermal Nucleic Acid Amplification Technology Market Size, By Country, 2015–2022 (USD Million)
Table 48 Microarrays Market Size, By Country, 2015–2022 (USD Million)
Table 49 Hybridization Market Size, By Country, 2015–2022 (USD Million)
Table 50 DNA Sequencing & NGS Market Size, By Country, 2015–2022 (USD Million)
Table 51 Other Molecular Diagnostic Technologies Market Size, By Country, 2015–2022 (USD Million)
Table 52 IVD Market Size for Clinical Microbiology, By Country, 2015–2022 (USD Million)
Table 53 IVD Market Size for Hematology, By Country, 2015–2022 (USD Million)
Table 54 IVD Market Size for Coagulation & Hemostasis, By Country, 2015–2022 (USD Million)
Table 55 Other IVD Technologies Market Size, By Country, 2015–2022 (USD Million)
Table 56 IVD Market Size in Emerging Countries, By Application, 2015–2022 (USD Million)
Table 57 Diabetic Patient Population, By Region, 2015 vs 2040 (Million)
Table 58 IVD Market Size for Diabetes, By Country, 2015–2022 (USD Million)
Table 59 IVD Market Size for Infectious Diseases, By Country, 2015–2022 (USD Million)
Table 60 IVD Market Size for Oncology/Cancer, By Country, 2015–2022 (USD Million)
Table 61 IVD Market Size for Cardiology, By Country, 2015–2022 (USD Million)
Table 62 Prevalence of Patients on Dialysis in Brazil (2011 to 2014)
Table 63 IVD Market Size for Nephrology, By Country, 2015–2022 (USD Million)
Table 64 IVD Market Size for Autoimmune Diseases, By Country, 2015–2022 (USD Million)
Table 65 IVD Market Size for Drug Testing/Pharmacogenomics, By Country, 2015–2022 (USD Million)
Table 66 HIV Prevalence, By Region, 2010–2015
Table 67 IVD Market Size for HIV/AIDS, By Country, 2015–2022 (USD Million)
Table 68 IVD Market Size for Other Applications, By Country, 2015–2022 (USD Million)
Table 69 IVD Market Size in Emerging Countries, By End User, 2015–2022 (USD Million)
Table 70 IVD Market Size for Hospital-Based Laboratories, By Country, 2015–2022 (USD Million)
Table 71 IVD Market Size for Clinical/Reference Laboratories, By Country, 2015–2022 (USD Million)
Table 72 IVD Market Size for POC Testing, By Country, 2015–2022 (USD Million)
Table 73 IVD Market Size for Patient Self-Testing, By Country, 2015–2022 (USD Million)
Table 74 IVD Market Size for Academic Institutes, By Country, 2015–2022 (USD Million)
Table 75 IVD Market Size for Other End Users, By Country, 2015–2022 (USD Million)
Table 76 IVD Market Size in Emerging Countries, By Country, 2015–2022 (USD Million)
Table 77 China: Macroeconomic Indicators
Table 78 China: IVD Market Size, By Product & Service, 2015–2022 (USD Million)
Table 79 China: IVD Market Size, By Application, 2015–2022 (USD Million)
Table 80 China: IVD Market Size, By Technology, 2015–2022 (USD Million)
Table 81 China: IVD Market Size, By End User, 2015–2022 (USD Million)
Table 82 India: Macroeconomic Indicators
Table 83 India: IVD Market Size, By Product & Service, 2015–2022 (USD Million)
Table 84 India: IVD Market Size, By Application, 2015–2022 (USD Million)
Table 85 India: IVD Market Size, By Technology, 2015–2022 (USD Million)
Table 86 India: IVD Market Size, By End User, 2015–2022 (USD Million)
Table 87 Russia: IVD Market Size, By Product & Service, 2015–2022 (USD Million)
Table 88 Russia: IVD Market Size, By Application, 2015–2022 (USD Million)
Table 89 Russia: IVD Market Size, By Technology, 2015–2022 (USD Million)
Table 90 Russia: IVD Market Size, By End User, 2015–2022 (USD Million)
Table 91 Brazil: Macroeconomic Indicators
Table 92 Brazil: IVD Market Size, By Product & Service, 2015–2022 (USD Million)
Table 93 Brazil: IVD Market Size, By Application, 2015–2022 (USD Million)
Table 94 Brazil: IVD Market Size, By Technology, 2015–2022 (USD Million)
Table 95 Brazil: IVD Market Size, By End User, 2015–2022 (USD Million)
Table 96 Mexico: Macroeconomic Indicators
Table 97 Mexico: IVD Market Size, By Product & Service, 2015–2022 (USD Million)
Table 98 Mexico: IVD Market Size, By Application, 2015–2022 (USD Million)
Table 99 Mexico: IVD Market Size, By Technology, 2015–2022 (USD Million)
Table 100 Mexico: IVD Market Size, By End User, 2015–2022 (USD Million)
Table 101 Argentina: Macroeconomic Indicators
Table 102 Argentina: IVD Market Size, By Product & Service, 2015–2022 (USD Million)
Table 103 Argentina: IVD Market Size, By Application, 2015–2022 (USD Million)
Table 104 Argentina: IVD Market Size, By Technology, 2015–2022 (USD Million)
Table 105 Argentina: IVD Market Size, By End User, 2015–2022 (USD Million)
Table 106 Colombia: Macroeconomic Indicators
Table 107 Colombia: IVD Market Size, By Product & Service, 2015–2022 (USD Million)
Table 108 Colombia: IVD Market Size, By Application, 2015–2022 (USD Million)
Table 109 Colombia: IVD Market Size, By Technology, 2015–2022 (USD Million)
Table 110 Colombia: IVD Market Size, By End User, 2015–2022 (USD Million)
Table 111 Chile: IVD Market Size, By Product & Service, 2015–2022 (USD Million)
Table 112 Chile: IVD Market Size, By Application, 2015–2022 (USD Million)
Table 113 Chile: IVD Market Size, By Technology, 2015–2022 (USD Million)
Table 114 Chile: IVD Market Size, By End User, 2015–2022 (USD Million)
Table 115 South Korea: IVD Market Size, By Product & Service, 2015–2022 (USD Million)
Table 116 South Korea: IVD Market Size, By Application, 2015–2022 (USD Million)
Table 117 South Korea: IVD Market Size, By Technology, 2015–2022 (USD Million)
Table 118 South Korea: IVD Market Size, By End User, 2015–2022 (USD Million)
Table 119 Turkey: IVD Market Size, By Product & Service, 2015–2022 (USD Million)
Table 120 Turkey: IVD Market Size, By Application, 2015–2022 (USD Million)
Table 121 Turkey: IVD Market Size, By Technology, 2015–2022 (USD Million)
Table 122 Turkey: IVD Market Size, By End User, 2015–2022 (USD Million)
Table 123 Saudi Arabia: IVD Market Size, By Product & Service, 2015–2022 (USD Million)
Table 124 Saudi Arabia: IVD Market Size, By Application, 2015–2022 (USD Million)
Table 125 Saudi Arabia: IVD Market Size, By Technology, 2015–2022 (USD Million)
Table 126 Saudi Arabia: IVD Market Size, By End User, 2015–2022 (USD Million)
Table 127 Thailand: IVD Market Size, By Product & Service, 2015–2022 (USD Million)
Table 128 Thailand: IVD Market Size, By Application, 2015–2022 (USD Million)
Table 129 Thailand: IVD Market Size, By Technology, 2015–2022 (USD Million)
Table 130 Thailand: IVD Market Size, By End User, 2015–2022 (USD Million)
Table 131 Malaysia: IVD Market Size, By Product & Service, 2015–2022 (USD Million)
Table 132 Malaysia: IVD Market Size, By Application, 2015–2022 (USD Million)
Table 133 Malaysia: IVD Market Size, By Technology, 2015–2022 (USD Million)
Table 134 Malaysia: IVD Market Size, By End User, 2015–2022 (USD Million)
Table 135 Indonesia: IVD Market Size, By Product & Service, 2015–2022 (USD Million)
Table 136 Indonesia: IVD Market Size, By Application, 2015–2022 (USD Million)
Table 137 Indonesia: IVD Market Size, By Technology, 2015–2022 (USD Million)
Table 138 Indonesia: IVD Market Size, By End User, 2015–2022 (USD Million)
List of Figures (69 Figures)
Figure 1 IVD Market in Emerging Countries: Market Segmentation
Figure 2 Research Design
Figure 3 Bottom-Up Approach
Figure 4 Top-Down Approach
Figure 5 Data Triangulation Methodology
Figure 6 IVD Market Size in Emerging Countries, By Product & Service, 2017 vs 2022 (USD Million)
Figure 7 IVD Market Size in Emerging Countries, By Application, 2017 vs 2022 (USD Million)
Figure 8 IVD Market Size in Emerging Countries, By Technology, 2017 vs 2022 (USD Million)
Figure 9 Clinical Chemistry Market Size in Emerging Countries, By Type, 2017 vs 2022 (USD Million)
Figure 10 Molecular Diagnostics Market Size in Emerging Countries, By Type, 2017 vs 2022 (USD Million)
Figure 11 IVD Market Size in Emerging Countries, By End User, 2017 vs 2022 (USD Million)
Figure 12 IVD Market in Emerging Countries: Geographic Snapshot
Figure 13 Rising Incidence of Chronic Lifestyle Diseases is A Major Driver for the Growth of the IVD Market in Emerging Countries
Figure 14 Reagents & Kits Commanded the Largest Market Share in 2016
Figure 15 Regulatory Process for IVD Devices in India
Figure 16 IVD Market in Emerging Countries: Drivers, Restraints, Opportunities, and Challenges
Figure 17 Share of Elderly Population in Latin America, By Country, (2010 vs 2015 vs 2030)
Figure 18 Geriatric Population Statistics, By Region (2015 vs 2030 vs 2050)
Figure 19 Reagents & Kits Segment to Witness the Highest CAGR During the Forecast Period
Figure 20 Molecular Diagnostics Segment to Register the Highest Growth During the Forecast Period
Figure 21 Oncology is the Fastest-Growing Application Segment in the IVD Market
Figure 22 Cancer Incidence and Cancer-Related Deaths in China
Figure 23 IVD Market Size in Emerging Countries, By End User, 2017 vs 2022 (USD Million)
Figure 24 Number of Accredited Clinical Laboratories in Mexico (2005–2015)
Figure 25 China: IVD Market Overview
Figure 26 India: IVD Market Overview
Figure 27 Russia: IVD Market Overview
Figure 28 Brazil: IVD Market Overview
Figure 29 Dive Chart
Figure 30 Product Offerings
Figure 31 Business Strategy
Figure 32 F. Hoffmann-La Roche Ltd.: Company Snapshot (2016)
Figure 33 Roche Diagnostics: Product Offerings Scorecard
Figure 34 Roche Diagnostics: Business Strategy Scorecard
Figure 35 Abbott Laboratories, Inc.: Company Snapshot (2016)
Figure 36 Abbott Laboratories: Product Offerings Scorecard
Figure 37 Abbott Laboratories: Business Strategy Scorecard
Figure 38 Becton, Dickinson and Company: Company Snapshot (2016)
Figure 39 Becton, Dickinson and Company: Product Offerings Scorecard
Figure 40 Becton, Dickinson and Company: Business Strategy Scorecard
Figure 41 Biomérieux SA: Company Snapshot (2016)
Figure 42 Biomérieux SA: Product Offerings Scorecard
Figure 43 Biomérieux SA: Business Strategy Scorecard
Figure 44 Bio-Rad Laboratories, Inc. Company Snapshot (2016)
Figure 45 Bio-Rad Laboratories, Inc.: Product Offerings Scorecard
Figure 46 Bio-Rad Laboratories, Inc.: Business Strategy Scorecard
Figure 47 Danaher Corporation: Company Snapshot (2016)
Figure 48 Danaher Corporation: Product Offerings Scorecard
Figure 49 Danaher Corporation: Business Strategy Scorecard
Figure 50 Johnson & Johnson Services, Inc.: Company Snapshot (2016)
Figure 51 Johnson & Johnson Services, Inc.: Product Offerings Scorecard
Figure 52 Johnson & Johnson Services, Inc.: Business Strategy Scorecard
Figure 53 Ortho-Clinical Diagnostics: Product Offerings Scorecard
Figure 54 Ortho-Clinical Diagnostics: Business Strategy Scorecard
Figure 55 Qiagen N.V.: Company Snapshot (2015)
Figure 56 Qiagen N.V.: Product Offerings Scorecard
Figure 57 Qiagen N.V.: Business Strategy Scorecard
Figure 58 Sysmex Corporation: Company Snapshot (2015)
Figure 59 Sysmex Corporation: Product Offerings Scorecard
Figure 60 Sysmex Corporation: Business Strategy Scorecard
Figure 61 Thermo Fisher Scientific Inc.: Company Snapshot (2016)
Figure 62 Thermo Fisher Scientific Inc.: Product Offerings Scorecard
Figure 63 Thermo Fisher Scientific Inc: Business Strategy Scorecard
Figure 64 Siemens AG: Company Snapshot (2016)
Figure 65 Siemens AG: Product Offerings Scorecard
Figure 66 Siemens AG: Business Strategy Scorecard
Figure 67 Diasorin S.P.A.: Company Snapshot (2015)
Figure 68 Diasorin S.P.A.: Product Offerings Scorecard
Figure 69 Diasorin S.P.A.: Business Strategy Scorecard

 Generating Response ...


Growth opportunities and latent adjacency in IVD Market