
Laminated Glass Market

Laminated Glass Market by Glass Type (Heat-strengthened, Tempered, Triple, Reflective, Others), End-use Industry (Automotive, Electronics, Building & Construction, Energy, Other End-use Industries), and Region - Global Forecast to 2030


OVERVIEW
Source: Secondary Research, Interviews with Experts, MarketsandMarkets Analysis
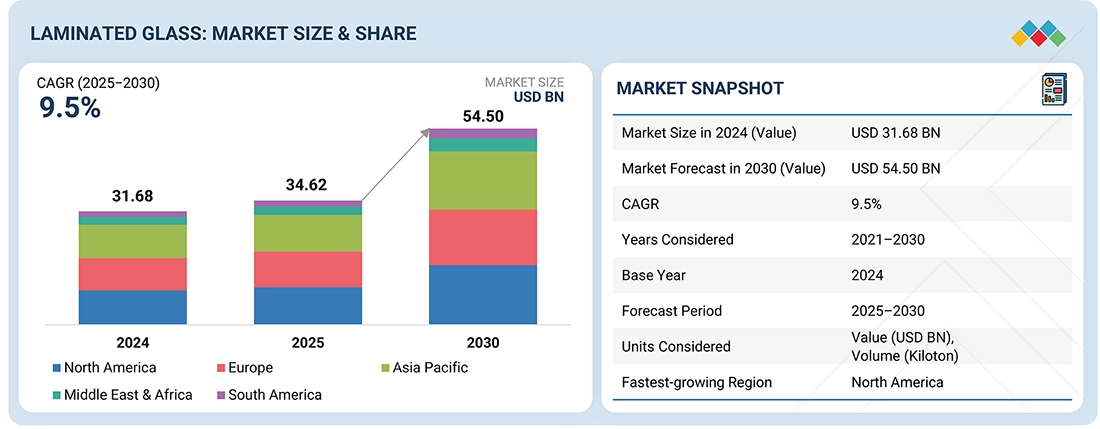
The laminated glass market is expected to grow from USD 31.68 billion in 2024 to USD 54.50 billion by 2030, with a CAGR of 9.5% over the forecast period. Market growth is driven by increasing demand for safety and security solutions in the automotive and construction industries. The adoption of energy-efficient and acoustic control glass in green buildings further accelerates market expansion.
KEY TAKEAWAYS
-
BY INTERLAYER TYPEThe laminated glass market encompasses various interlayer types, including polyvinyl butyral, ethyl-vinyl acetate, ionoplast polymer, thermoplastic polyurethane, among others. Polyvinyl butyral held the largest market share in 2024, owing to its extensive application in the automotive and architectural sectors because of its excellent adhesion and safety characteristics. In terms of market value, ionoplast polymer was identified as the fastest-growing interlayer type during the forecast period, driven by increasing demand for high-performance glazing with enhanced strength and durability. This growth is especially notable in hurricane-resistant constructions and premium automotive markets. Ethyl-vinyl acetate, the third fastest-growing segment, offers robust UV resistance and durability, rendering it suitable for solar panel encapsulation and outdoor applications.
-
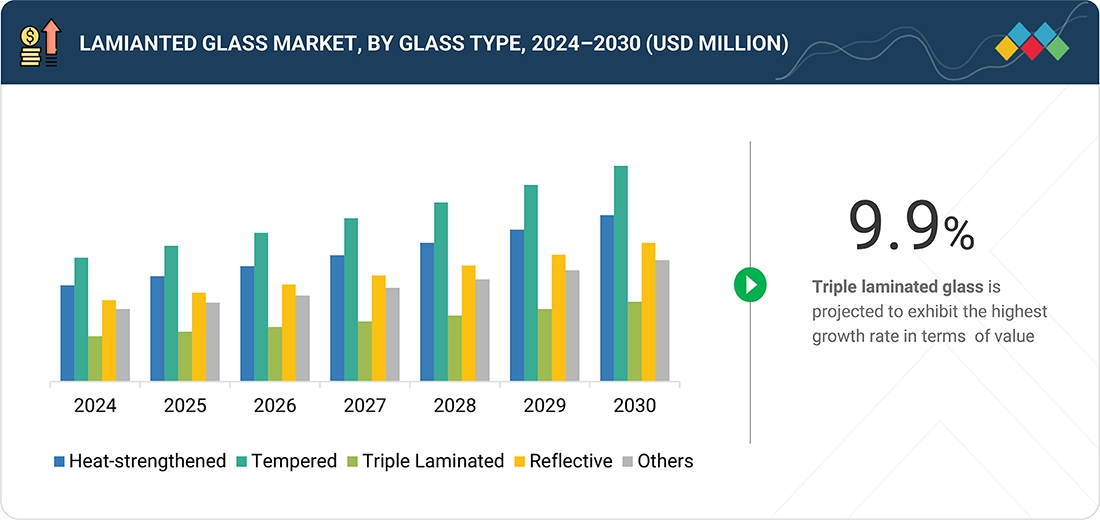
BY GLASS TYPEKey glass types include heat-strengthened laminated glass, tempered laminated glass, triple laminated glass, reflective laminated glass, and other types. In the laminated glass market, tempered laminated glass held the largest market share in 2024 due to its widespread adoption in high-strength safety applications across automotive and construction sectors. Triple-laminated glass is likely to be the fastest-growing segment, by value, driven by increasing demand for enhanced acoustic insulation and impact resistance in premium infrastructure projects.
-
BY APPLICATIONLaminated glass serves a critical role across various applications, offering enhanced safety, sound insulation, and UV protection, making it ideal for both, structural and specialty uses. Key applications of lamination glass include (windows, doors, and facades, automotive shields, railway & marine glazing, solar/BIPV modules, electronics & smart sevices, security & defense glazing). In 2024, the windows, doors, and facades segment held the largest market share, primarily due to increasing adoption in modern architecture, urban infrastructure, and green building projects that require energy-efficient and impact-resistant materials.
-
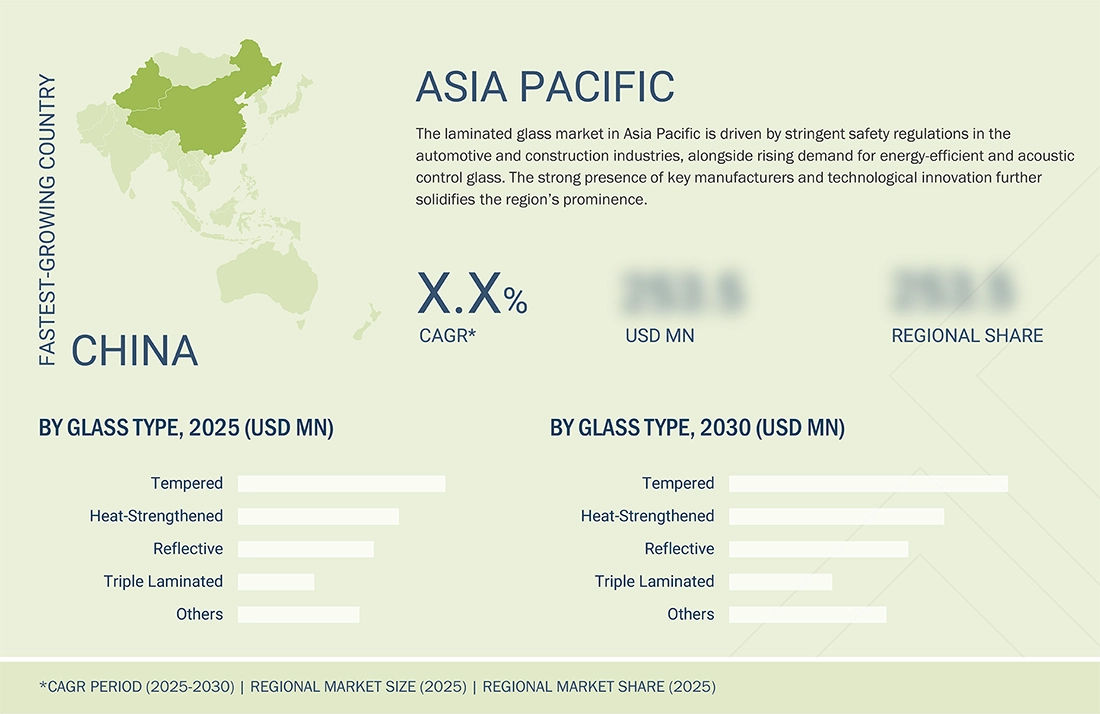
BY REGIONThe laminated glass market covers Europe, North America, Asia Pacific, South America, and the Middle East & Africa. North America is the largest market for laminated glass, home to several prominent glass companies, with increasing demand that contributes to the growing adoption of laminated glass products. Asia Pacific is the fastest-growing market for laminated glass due to rapid urbanization, large-scale infrastructure projects, and booming automotive and electronics industries. Strong government initiatives promoting energy efficiency and sustainable construction further drive demand. Increasing investments in smart city developments and industrial expansions support the region's strong market growth.
-
COMPETITIVE LANDSCAPE
The Laminated glass market is witnessing steady growth, due to stringent regulatory standards on building safety and vehicle glazing. Expanding urbanization and infrastructure projects are accelerating its use in windows, doors, and facades. Moreover, rising consumer preference for premium aesthetics and comfort features, such as noise reduction and thermal insulation, is boosting demand
TRENDS & DISRUPTIONS IMPACTING CUSTOMERS' CUSTOMERS
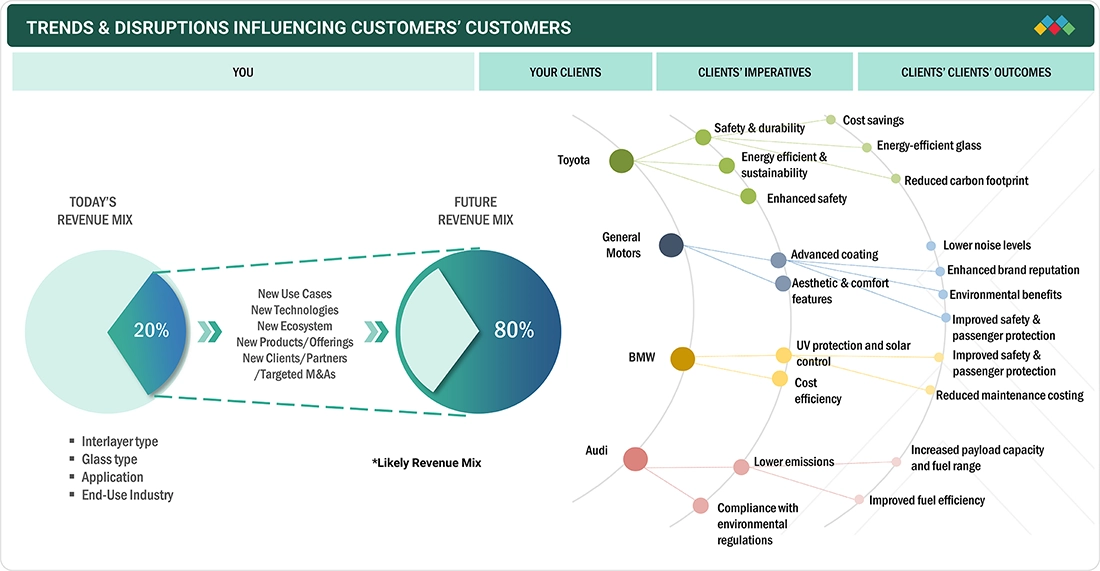
The changing dynamics of the laminated glass industry illustrate how trends and disruptions are altering revenue streams and consumer expectations, particularly in the automotive sector. Approximately 80% of revenue originates from conventional laminated glass applications, interlayer types, and end-use industries. In the next few years, this trend is anticipated to shift, with 80% of revenue likely stemming from innovative use cases, technologies, ecosystem markets, and strategic partnerships. Automobile manufacturers like Toyota, General Motors, BMW, and Audi are responding to these transformations by focusing on critical priorities such as safety and durability, energy efficiency, advanced coatings, and cost-effectiveness. These priorities are driven by their customers' demands for outcomes, including enhanced safety, reduced noise levels, increased brand value, and decreased emissions. Laminated glass solutions are enabling these outcomes through features like energy-efficient glass, UV and acoustic control, and compliance with environmental standards.
Source: Secondary Research, Interviews with Experts, MarketsandMarkets Analysis
MARKET DYNAMICS
Level
-
Rising adoption of laminated glass in construction for safety and energy efficiency

-
Growing use of Laminated Glass in automotive windshields and sunroofs

Level
-
Capital-intensive production process

-
Higher cost of glass bonding adhesive than conventional adhesive

Level
-
Push for sustainable and green certified buildings

-
Security and defense demand for bullet resistant glass

Level
-
High emission in glass production

-
Fluctuating prices of raw materials

Source: Secondary Research, Interviews with Experts, MarketsandMarkets Analysis
Driver: Rising adoption of laminated glass in construction for safety and energy efficiency
The escalating utilization of laminated glass in the construction industry for enhanced safety and energy efficiency constitutes a fundamental driver of the laminated glass market. As urban development accelerates and modern infrastructure assumes greater importance, building regulations are progressively mandating the use of safety glass in windows, facades, and doors to safeguard occupants against breakage, impacts, and natural calamities. Laminated glass provides a superior level of safety in comparison to standard glass, thereby becoming the preferred selection for residential, commercial, and public infrastructure projects. Beyond safety considerations, laminated glass aligns with the increasing demand for energy-efficient and environmentally certified edifices. Its capability to obstruct UV rays, diminish solar heat gain, and enhance sound insulation renders it especially attractive for sustainable construction initiatives. This advancement supports global endeavors aimed at reducing carbon footprints and minimizing energy consumption in buildings.
Restraint: Capital Intensive production process
Capital-intensive production processes constitute a significant barrier to the laminated glass market. Manufacturing laminated glass necessitates sophisticated equipment such as autoclaves, cutting and edging machinery, clean room facilities, and quality testing systems, all of which entail substantial initial investment. The complexity of the lamination process, which requires precise control of temperature and pressure to bond interlayers such as PVB or ionoplast, further escalates operational expenses and limits the flexibility of smaller manufacturers to enter the market. Moreover, ongoing maintenance, energy-intensive operations, and compliance with stringent safety and quality standards contribute additional cost burdens. Given that end users, particularly within the construction sector, are often highly sensitive to price, these elevated production costs render laminated glass less competitive compared to conventional glass or alternative materials. Consequently, market dominance is often confined to large-scale corporations endowed with considerable financial and technological resources, while smaller or regional firms encounter barriers to scaling production. This high-cost structure impedes market penetration in emerging economies and potentially restricts overall growth momentum.
Opportunity: Push for sustainable and green certified buildings
The push for sustainable and green-certified buildings creates a significant opportunity for the laminated glass industry. As governments, urban planners, and developers highlight the importance of reducing the environmental impact of buildings, demand grows for materials that provide safety, performance, and sustainability. Laminated glass is key to achieving certifications like LEED, BREEAM, and other green building standards because it improves energy efficiency by reducing solar heat gain, enhancing insulation, and lowering dependence on artificial heating and cooling. Additionally, laminated glass can be improved with advanced interlayers and coatings that offer UV protection, sound insulation, and solar energy integration, supporting the global shift towards smarter and more eco-friendly infrastructure. The rising need for facades that maximize daylight and energy efficiency, along with the trend of adopting low-carbon building materials, favors the use of laminated glass. As cities worldwide invest in eco-friendly skyscrapers, smart homes, and infrastructure resilient to climate challenges, laminated glass is recognized as both a practical and sustainable option, opening new growth opportunities in residential, commercial, and public infrastructure projects.
Challenge: High emission in glass production
The laminated glass industry faces the challenge of high emissions during manufacturing. Creating glass is very energy-intensive, using furnaces that reach extremely high temperatures, which produces significant carbon dioxide emissions. Adding lamination techniques, such as autoclaving and adhesive bonding, further increases energy consumption, raising environmental concerns at a time when industries are under increasing pressure to adopt low-carbon practices. As governments set stricter emission reduction targets and implement carbon taxes, manufacturers in the laminated glass sector struggle to stay competitive while investing in cleaner technologies. Although innovations like electric furnaces, cullet recycling, and low-carbon raw materials are being explored, their widespread adoption requires substantial capital and time. With sustainability becoming a key factor in procurement for both construction and automotive sectors, companies that fail to effectively reduce their carbon footprint risk facing regulatory issues, reputation damage, and a competitive edge loss in the evolving market environment.
Laminated Glass Market: COMMERCIAL USE CASES ACROSS INDUSTRIES
| COMPANY | USE CASE DESCRIPTION | BENEFITS |
|---|---|---|
 |
Use of laminated glass in panoramic sunroofs and side glazing | Enhanced passenger safety, UV protection, improved cabin acoustics, and premium comfort |
 |
Integration of laminated glass in windshields and driver-assistance system displays | High optical clarity, reduced glare, acoustic insulation, and better ADAS sensor performance |
 |
Application of laminated glass in EV windshields and side windows | Lower cabin noise, improved energy efficiency for HVAC systems, and increased passenger safety |
 |
Use of laminated glass in hybrid and electric vehicle windshields | Reduced weight with advanced interlayers, better solar control, and improved durability |
 |
Use of laminated glass in passenger windows with solar/UV control interlayers | Reduced cabin heat load, lower fuel consumption via reduced AC load, enhanced passenger comfort |
Logos and trademarks shown above are the property of their respective owners. Their use here is for informational and illustrative purposes only.
MARKET ECOSYSTEM
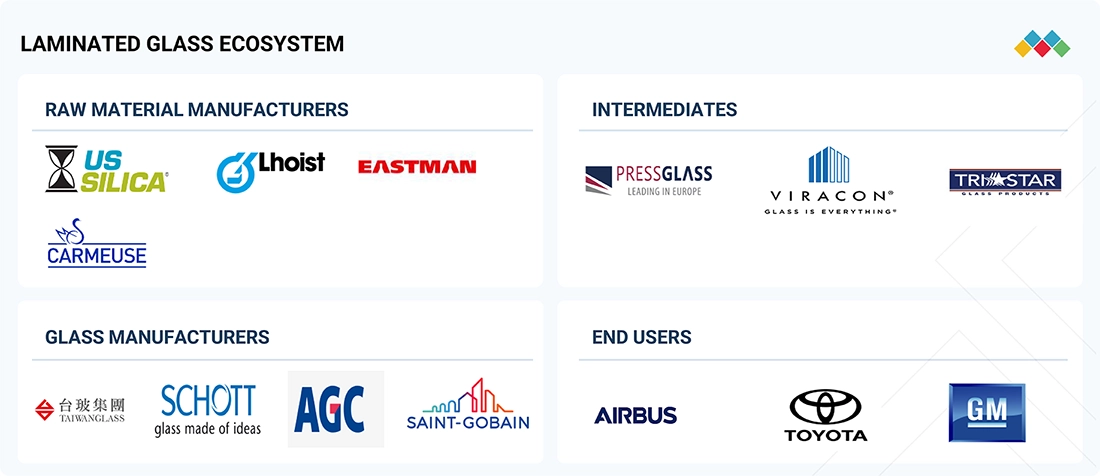
The laminated glass ecosystem consists of interconnected industry segments, each contributing to the production and application of laminated glass. It includes raw material manufacturers/suppliers (Carmeuse, US Silica, Eastman, and Lhoist) who provide silica sand, limestone, soda ash, and other materials to laminated glass manufactfurers (Saint Gobain, AGC Inc., and SCHOTT). These manufacturers offer laminated glass to intermediaries such as PressGlass, TriStar, and Viracon, who further provide it to end users such as Toyota, Airbus, and General Motors.
Logos and trademarks shown above are the property of their respective owners. Their use here is for informational and illustrative purposes only.
MARKET SEGMENTS
Source: Secondary Research, Interviews with Experts, MarketsandMarkets Analysis
Laminated Glass Market, By Glass Type
In 2024, in terms of value, tempered glass held the largest share of the laminated glass market, and will continue leading, primarily due to its superior strength, safety characteristics, thermal resistance, and cost-effectiveness, all of which align with current market trends and end user demand. Tempered glass is manufactured through a process of extreme heating followed by rapid cooling, resulting in glass that is four to five times stronger than standard annealed glass, enabling it to withstand higher impacts and thermal stresses commonly encountered in automotive, architectural, and public infrastructure applications. Tempered laminated glass is gaining traction in infrastructure projects, interior design, and specialty applications such as bullet-resistant and blast-resistant glazing in defense, security, and commercial spaces. Market trends like urban high-rise development, growing adoption of panoramic sunroofs in vehicles, and rising emphasis on sustainability through energy-efficient glass solutions all reinforce the dominance of tempered laminated glass
REGION
Asia-Pacific to be fastest-growing region in global Laminated glass market during forecast period
The Asia Pacific laminated glass market is projected to have the highest CAGR during the forecast period, driven by rapid urban development and significant infrastructure expansion in countries like China, India, and various Southeast Asian nations. This growth increases demand for laminated glass in applications such as windows, facades, and the automotive industry. The region's focus on sustainable building practices and energy-efficient construction further boosts demand for laminated glass that provides better thermal and solar control. Additionally, rising vehicle production, especially electric vehicles, results in greater use of laminated glass. Government programs and investments aimed at developing smart cities and large-scale infrastructure projects are fueling market growth.
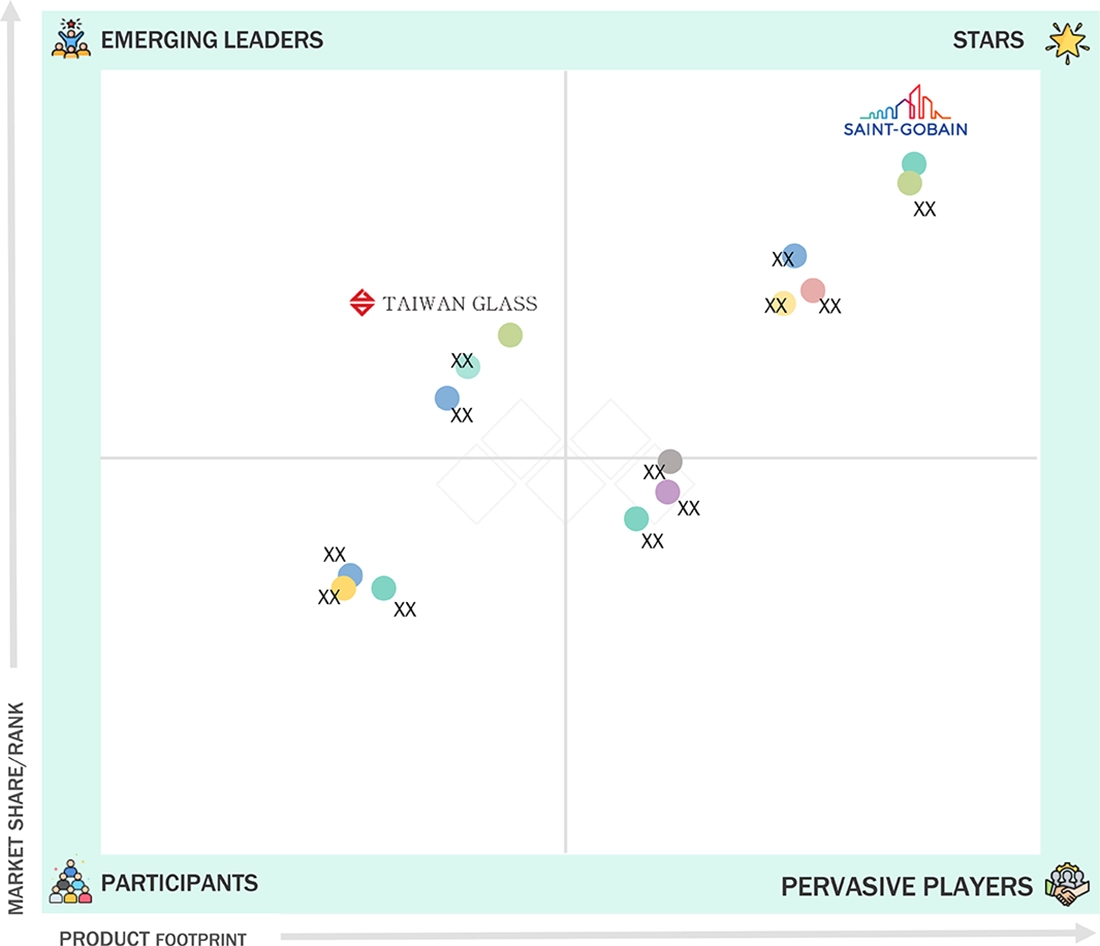
Laminated Glass Market: COMPANY EVALUATION MATRIX
In the laminated glass market matrix, Saint-Gobain (Star) holds a dominant position with a strong market share and an extensive product range, driven by its advanced products used across various end-use industries. TAIWAN GLASS IND. CORP. (Emerging Leader) stands out because of its technological innovation, diverse product portfolio, and strong presence in the Asia Pacific region. The company’s focus on high-quality manufacturing and strategic capacity expansion supports its competitive stance and market leadership. While Saint-Gobain continues to lead through scale and a diversified portfolio, TAIWAN GLASS IND. CORP. shows significant potential to move toward the leaders’ quadrant as demand for high-strength alloys continues to grow.
Source: Secondary Research, Interviews with Experts, MarketsandMarkets Analysis
KEY MARKET PLAYERS
MARKET SCOPE
| REPORT METRIC | DETAILS |
|---|---|
| Market Size in 2024 (Value) | USD 31.68 Billion |
| Revenue Forecast in 2030 (Value) | USD 54.50 Billion |
| Growth Rate | CAGR of 9.5% from 2025-2030 |
| Years Considered | 2021-2030 |
| Base Year | 2024 |
| Forecast Period | 2025-2030 |
| Units Considered | |
| Report Coverage | |
| Segments Covered | |
| Regional Scope |
WHAT IS IN IT FOR YOU: Laminated Glass Market REPORT CONTENT GUIDE
DELIVERED CUSTOMIZATIONS
We have successfully delivered the following deep-dive customizations:
| CLIENT REQUEST | CUSTOMIZATION DELIVERED | VALUE ADDS |
|---|---|---|
| Automotive Manufacturer | - Comprehensive profiling of laminated glass suppliers including financials, certifications, and technology. | - Identify best-fit suppliers for automotive glazing |
| Building & Construction Company | - Market adoption and growth benchmarking for laminated glass in windows, doors, facades, and skylights | - Support compliance with safety and energy efficiency building codes |
| Raw Material Supplier | - Identify supply-demand gaps and optimize raw material supply contracts | |
| Defense & Specialty Vehicle OEM | - Identify future applications in hypersonics, UAVs, and military vehicles |
RECENT DEVELOPMENTS
- May 2025 : AGC Automotive Czech, a branch of AGC Inc., begab constructing a laminated windshield production line at its Chuderice plant. The investment will boost the plant’s production capacity and technological capabilities, including automation.
- March 2025 : Nippon Sheet Glass Co., Ltd. converted an existing glass production line at its facility in Rossford, Ohio, to produce TCO (transparent conductive oxide) glass. The modification will improve production capacity for solar applications.
- October 2024 : Saint-Gobain and Eastman collaborated to develop a low-carbon glass solution aimed at enhancing sustainability within the architecture industry.
- May 2024 : Saint-Gobain India, a subsidiary of Saint-Gobain, opened a new manufacturing plant at its World Glass Complex in Sriperumbudur, Tamil Nadu. This marks Saint-Gobain's largest single-location investment globally, with a total of over ?3,750 crore invested. The new facilities feature a float glass plant, an integrated windows line, and a social forestry project.
Table of Contents
 Exclusive indicates content/data unique to MarketsandMarkets and not available with any competitors.
Methodology
The study involves two main activities to estimate the current market size for the laminated glass market. Extensive secondary research was conducted to gather information on the market, peer markets, and parent markets. The next step was to validate these findings, assumptions, and size estimates with industry experts across the value chain through primary research. Both, the top-down and bottom-up approaches were used to determine the total market size. Subsequently, market segmentation and data triangulation were applied to estimate the size of segments and subsegments.
Secondary Research
Secondary sources used for this research include financial statements of companies offering laminated glass and information from various trade, business, and professional associations. Secondary research helped gather crucial information about the industry’s value chain, key players, market classification, and segmentation based on industry trends down to the regional level. This secondary data was collected and analyzed to determine the overall size of the laminated glass market, which was then validated by primary respondents.
Primary Research
Extensive primary research was carried out after gathering information on the laminated glass market through secondary research. Several interviews were conducted with market experts from both the demand and supply sides across major countries in North America, Europe, Asia Pacific, the Middle East & Africa, and South America. Data was collected through questionnaires, emails, and phone calls. On the supply side, sources included industry experts such as Chief X Officers (CXOs), Vice Presidents (VPs), Directors from business development, marketing, and product development teams, along with other key executives from laminated glass industry vendors; system integrators; component providers; distributors; and key opinion leaders. These interviews provided insights into market statistics, revenue data from products and services, market segmentation, market size estimates, forecasts, and data triangulation. The primary research also clarified trends related to type, form, application, end-use industry, and region. Stakeholders from the demand side, including CIOs, CTOs, CSOs, and installation teams from customer/end-user organizations using laminated glass, were interviewed to understand their perspectives on suppliers, products, and component providers, as well as their current and future usage of laminated glass products, which influence the overall market.
Breakup of Primary Research

To know about the assumptions considered for the study, download the pdf brochure
Market Size Estimation
The research methodology employed to estimate the size of the laminated glass market encompasses the following details. Market sizing was conducted from the demand perspective. The market was expanded based on procurements and modernization efforts in laminated glass products across various applications at a regional level. Such procurements offer insights into the demand dynamics within the laminated glass industry for each application. For each end-use industry, all relevant segments of the laminated glass market were integrated and systematically mapped.
Laminated Glass Market Size: Top-down and Bottom-up Approach

Data Triangulation
After arriving at the overall size derived from the market size estimation process outlined above, the total market was divided into multiple segments and subsegments. The procedures of data triangulation and market breakdown, as described below, were employed wherever applicable to finalize the overall market analysis and ascertain precise statistics for various segments and subsegments. This data triangulation involved examining diverse factors and trends from both demand and supply perspectives. Additionally, the market size was corroborated through the application of both top-down and bottom-up methodologies.
Market Definition
Laminated glass is a specialized flat glass made of two or more layers bonded with interlayer materials such as polyvinyl butyral (PVB), ionoplast polymers, or thermoplastic polyurethane (TPU). This design not only keeps the glass intact when broken, reducing injury risk, but also provides features like sound insulation, UV protection, and improved energy efficiency. By combining different glass types, coatings, and finishes, laminated glass offers both functional benefits and aesthetic options, making it a popular choice in construction, automotive, electronics, and other industries where safety, durability, and design are crucial.
Stakeholders
- Laminated glass manufacturers
- Senior management
- End users
- Laminated glass and composite associations and industrial bodies
- Research and consulting firms
- R&D department
Report Objectives
- To define, describe, and forecast the laminated glass market size in terms of volume and value
- To provide detailed information regarding the key factors, such as drivers, restraints, opportunities, and challenges influencing market growth
- To analyze and project the global laminated glass market by fiber type, matrix type, end-use industry, and region
- To forecast the market size for five main regions (along with country-level data), namely, North America, Europe, Asia Pacific, South America, and the Middle East & Africa, and analyze significant region-specific trends
- To strategically analyze micromarkets with respect to individual growth trends, prospects, and contributions of submarkets to the overall market
- To analyze market opportunities and the competitive landscape for stakeholders and market leaders
- To assess recent market developments and competitive strategies, such as agreements, contracts, acquisitions, and new product developments/new product launches, to draw the competitive landscape
- To strategically profile key market players and comprehensively analyze their core competencies
Need a Tailored Report?
Customize this report to your needs
Get 10% FREE Customization
Customize This ReportPersonalize This Research
- Triangulate with your Own Data
- Get Data as per your Format and Definition
- Gain a Deeper Dive on a Specific Application, Geography, Customer or Competitor
- Any level of Personalization
Let Us Help You
- What are the Known and Unknown Adjacencies Impacting the Laminated Glass Market
- What will your New Revenue Sources be?
- Who will be your Top Customer; what will make them switch?
- Defend your Market Share or Win Competitors
- Get a Scorecard for Target Partners

Custom Market Research Services
We Will Customise The Research For You, In Case The Report Listed Above Does Not Meet With Your Requirements
Get 10% Free CustomisationGrowth opportunities and latent adjacency in Laminated Glass Market


Shaisha
May, 2022
Please share information about Laminated Glass Market Size, Share, Report (2022 - 27).