Facade Systems Market by Type (EIFS, Cladding, siding, curtain walls), End-use (Residential and Non-residential), and Region (North America, Europe, South America, Asia Pacific, Middle East & Africa) – Global Forecast to 2027
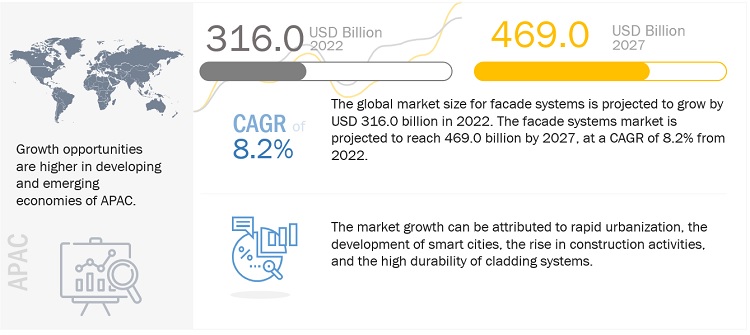
The global facade systems market size was valued at USD 316.0 billion in 2022 and is projected to reach USD 469.0 billion by 2027, growing at a cagr 8.2% from 2022 to 2027.
The word facade is actually derived from the Italian word “facciata” which means all of the external faces of the building. However, this term is generally used to refer to the front face of the building. The facade systems not only just to enhance the beauty of the building, but it also used to protect the building from extreme weather conditions such as snow, rain, wind, sun, etc. and helps in saving energy. Several types of facade systems are available in the market, such as EIFS, Cladding, Curtain walls, and siding. The facade systems can be made up of various types of raw materials such as clay, wood, metal, glass, and others which are used in residential and non-residential sectors such as shopping malls, offices, factories, warehouses, and so on.
Attractive Opportunities in the Facade Systems Market

To know about the assumptions considered for the study, Request for Free Sample Report
Facade Systems Market Dynamics
Driver: Increase in construction activities.
Due to rapid industrialization, the demand for commercial, non-commercial, residential, and non-residential buildings has been rising. The construction of manufacturing plants, shopping centers, warehouses, factories, stadiums, schools, colleges, hotels, restaurants, offices, public facilities (including government buildings), and others is increasing rapidly. This increment in construction activities has a direct impact on the need for sustainable decorative building construction solutions, which increased the demand for facade systems.
Restraint: Government regulations for carbon emissions
In recent years, environmental protection has been an important concern for many regions, along with possible serious legal implications. Environmental pollution from glass, aluminum, fiberglass, fiber cement, plasterboard, magnesium-oxide board, PVC board manufacturers, and the chemical industry, has been a cause for concern. These industries provide raw materials for facade systems. This has led to the adherence to stringent emission regulations by the stakeholders in the facade systems market.
Opportunities: Rise in demand for green buildings
Green building, also known as sustainable building or green construction, is the concept of designing and constructing structures and processes that are environmentally responsible and resource-efficient throughout the life cycle of a building, which starts from siting to design, construction, operation, maintenance, renovation, and ends at the deconstruction of the structure. These structures provide various benefits such as excellent energy-saving efficiency, efficient utilization of resources, sustainability, higher resale value, and eco-friendly in nature. The increase in demand for green buildings will propel the market of facade systems.
Challenges: Need for regular and expensive maintenance for optimum performance
In order to maintain water tightness and increase longevity, there is a requirement for proper routine maintenance of various facade systems such as cladding, curtain walls, sidings, and EIFS. It is also important to remove the dust particles which is accumulated on the surfaces of the systems and help to prevent any organic growth. It also helps in maintaining the appearance of the structures. It is becoming a challenge to repair the damaged part of the facade systems if it is broken or dented. In addition to this, the claddings, which are mainly made up of metals, are easily dented during the repair and maintenance process if experts do not handle it. Hence, the cost and time associated with repairing could be a major challenge faced by the facade systems.
Ecosystem

By End Use Industry, the Non-Residential sector accounted for the highest CAGR during the forecast period
The non-residential sectors are those areas that are not used for living purposes. The non-residential sector includes manufacturing plants, commercial offices, warehouses, factories, shopping malls, hotels, restaurants, mills, and so on. Due to the rising population, increasing concern towards sustainability, rapid urbanization, and other increase in the demand for residential and non-residential structures, which includes workspaces, shopping malls, etc., fuelled the market of facade systems in the forecast period.
By Type, the EIFS segment accounted for the highest CAGR during the forecast period
Exterior Insulation Finishing Systems (EIFS), sometimes known as synthetic stucco, is a type of cladding that gives an insulated finished surface to wall exteriors. They are put in numerous layers over the outer sheathing to create exterior cladding that is energy-efficient, fire-resistant, low-maintenance, attractive, and easily adaptable in nature. The EIFS provides several benefits, such as excellent insulation ability, lightweight, and easily converted into shapes and patterns to attain different aesthetic effects. In addition to this, this system also provides protection from extreme weather conditions, fire, and moisture and helps in increasing the life of the structure. Due to these several benefits of the EIFS, this segment will achieve the highest CAGR in the forecast period.
Asia Pacific is projected to account for the highest CAGR in the facade systems market during the forecast period
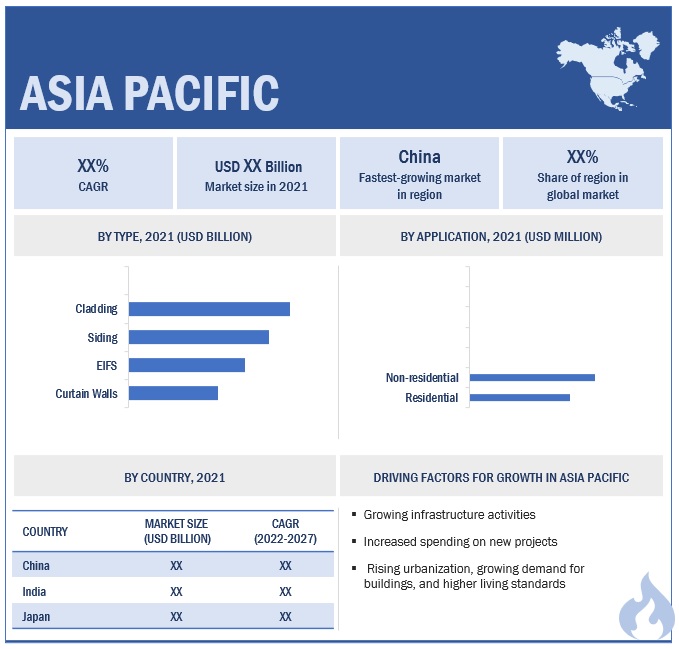
The Asia Pacific region is the hub of foreign investments and growing industrial sectors largely due to low-cost labor and cheap availability of lands. Due to this, construction activities are increasing, which helps to increase the demand for facade systems. In addition to this, the demand for facade systems in this region is also attributed to rapid urbanization, high growth in the infrastructure sector for aesthetic appeal, rising concerns towards sustainability, energy efficiency, and others.

To know about the assumptions considered for the study, download the pdf brochure
Key Market Players
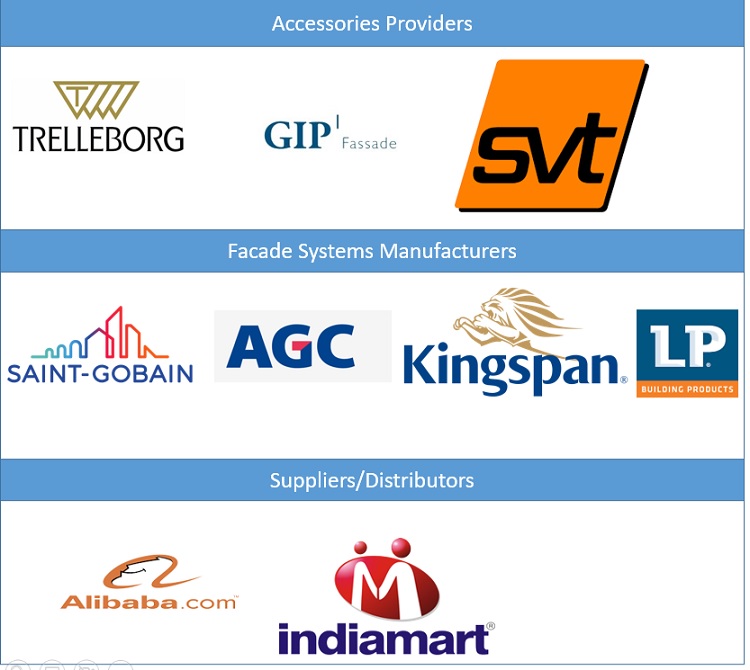
Facade Systems comprises major manufacturers such as AGC Inc. (Japan), Saint Gobain (France), Knauf (Germany), Kingspan Group plc (Ireland), and Louisiana-Pacific Corporation (US) were the leading players in the facade systems market. Expansions, acquisitions, joint ventures, and new product developments are some of the major strategies adopted by these key players to enhance their positions in the facade systems market.
Scope of the report:
|
Report Metric |
Details |
|
Years Considered |
2018–2027 |
|
Base year |
2021 |
|
Forecast period |
2022–2027 |
|
Unit considered |
Value (USD Billion) and Volume (Million SQF) |
|
Segments |
Type, End Use Industry, and Region |
|
Regions |
North America, Europe, South America, Asia Pacific, Middle East & Africa. |
|
Companies |
The major players are AGC Inc. (Japan), Sto SE & Co KGaA (Germany), Saint Gobain (France), Central Glass Co, Ltd. (Japan), Nippon Sheet Glass Company Limited (Japan), Kingspan Group plc (Ireland), Etex Group (Belgium), Louisiana-Pacific Corporation (US), Nichiha Corporation (Japan), Knauf (Germany) and others are covered in the facade systems market. |
This research report categorizes the global facade systems market on the basis of Type, End-Use, and Region.
Facade systems Market, By Type
- EIFS
- Curtain Walls
- Siding
- Cladding
Facade systems Market, By End Use
- Residential
- Non-residential
Facade systems Market, By Region
- North America
- Europe
- Asia Pacific (APAC)
- South America
- Middle East & Africa
The market has been further analyzed for the key countries in each of these regions.
Recent Developments
- In October 2022, Kingspan Group plc acquired the CALOSTAT® brand of high-performance insulation boards from the German specialty chemicals business Evonik Industries AG
- In September 2022, AGC Inc. announced that by the end of 2022, it would produce a float glass range featuring a significantly reduced carbon footprint of less than 7 kg of CO2 per m2 for clear glass (4 mm thickness).
- In September 2022, Saint Gobain announced a strategic partnership with a European-based solar manufacturer. The partnership enables Saint-Gobain to extend its sustainable solutions offer for facades and to become the leading provider of BIPV facade solutions in Europe.
- In September 2022, Kingspan Group plc announced the acquisition of Ondura Group to expand the roofing and waterproofing business.
- In September 2022, Kingspan Group plc strengthened its Roofing and Waterproofing business by acquiring Derbigum.
- In August 2022, Kingspan Group plc partnered with AquaTrace Limited to provide smart roof solutions.
- In July 2022, Saint-Gobain finalized the acquisition of V-system Elektro. This company has been active in the Czech and Slovak markets for 20 years in solutions for passive or low-energy buildings.
- In July 2022, Saint-Gobain completed the acquisition of Kaycan, a manufacturer and distributor of exterior building materials in Canada and in the United States.
- In June 2022, Kingspan Group plc invested in developing a manufacturing site, i.e., Building Technology Campus in Ukraine.
- In May 2022, Saint Gobain announced a partnership with ENGIE Romania to build the largest on-site photovoltaic park in Romania.
Frequently Asked Questions (FAQ):
What are the major drivers driving the growth of the Facade Systems Market?
The major drivers influencing the growth of the facade systems market are an increase in industrial, commercial, and residential construction activities, demand for protective wall systems to enhance the beauty of the buildings, and excellent durability.
What are the major challenges in the Facade Systems Market?
The major challenge in the Facade Systems market is the regular maintenance of the facade systems and the production & installation of the complex designed facade systems.
What are the restraining factors in the Facade Systems Market?
The major restraining factor faced by the facade systems market is the availability of green insulation material and stringent government regulations.
What is the key opportunity in the Facade Systems Market?
The growing demand for green buildings and growth in investment in infrastructural projects has created new opportunities for the Facade Systems Market.
What are the end-use industries where facade systems are used?
The facade systems are majorly used in residential and non-residential buildings such as offices, warehouses, shopping complexes, and others.
How are sustainable materials impacting the demand for facade systems in the United States?
In the United States, the demand for sustainable facade systems is on the rise as architects and developers increasingly prioritize eco-friendly materials to meet green building standards, like LEED certification.
How are facade systems contributing to energy efficiency in the United Kingdom’s building sector?
In the United Kingdom, facade systems are essential in improving energy efficiency, a priority aligned with the UK’s stringent building energy standards and decarbonization targets.
What are the main drivers of growth in the US facade systems market?
The growth of the US facade systems market is primarily driven by increased construction activities, particularly in the commercial and non-residential sectors.
How is sustainability influencing the UK facade systems market?
Sustainability is a major influence on the UK facade systems market, with growing demand for green building practices driving innovation and adoption of eco-friendly materials.
To speak to our analyst for a discussion on the above findings, click Speak to Analyst

This research involved using extensive secondary sources and databases, such as Factiva and Bloomberg, to identify and collect valuable information for a technical and market-oriented study of the facade systems market. Primary sources included industry experts from related industries and preferred suppliers, manufacturers, distributors, technologists, standards & certification organizations, and organizations related to all segments of this industry's value chain. In-depth interviews have been conducted with various primary respondents, such as key industry participants, subject matter experts (SMEs), executives of key companies, and industry consultants, to obtain and verify critical qualitative and quantitative information and assess growth prospects.
Secondary Research
In the secondary research process, various sources such as annual reports, press releases, and investor presentations of companies, white papers, and publications from recognized websites and databases have been referred to for identifying and collecting information. Secondary research has been used to obtain key information about the industry's supply chain, the total pool of key players, market classification and segmentation according to the industry trends to the bottom-most level, regional markets, and key developments from both market-and technology-oriented perspectives.
Primary Research
The facade systems market comprises several stakeholders in the supply chain, which include suppliers, processors, and end-product manufacturers. Various primary sources from the supply and demand sides of the markets have been interviewed to obtain qualitative and quantitative information. The primary participants from the demand side include key opinion leaders, executives, and CXOs of companies in the facade systems market. Primary sources from the supply side include associations and institutions involved in the facade systems industry, key opinion leaders, and processing players.
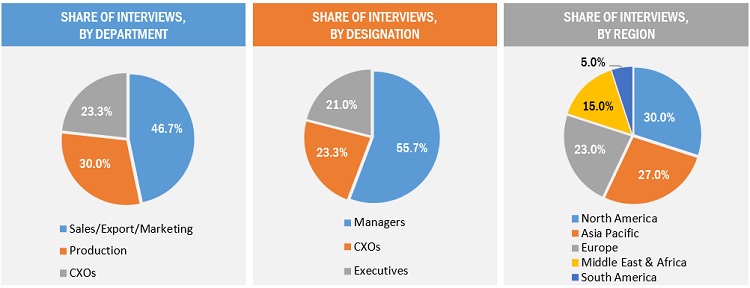
Following is the breakdown of primary respondents—

Notes: Other designations include product, sales, and marketing managers.
Tiers of the companies are classified based on their annual revenues as of 2021, Tier 1 = >USD 5 Billion, Tier 2 = USD 1 Billion to USD 5 Billion, and Tier 3= <USD 1 Billion.
To know about the assumptions considered for the study, download the pdf brochure
Market Size Estimation
Both top-down and bottom-up approaches were used to estimate and validate the size of the global facade systems market. The research methodology used to estimate the market size includes the following:
- The key players in the industry were identified through extensive secondary research.
- The supply chain of the industry and market size, in terms of value, were determined through primary and secondary research.
- All percentage share split, and breakdowns were determined using secondary sources and verified through primary sources.
- All possible parameters that affect the markets covered in this research study were accounted for, viewed in extensive detail, verified through primary research, and analyzed to obtain the final quantitative and qualitative data.
- The research includes the study of reports, reviews, and newsletters of key industry players, along with extensive interviews with key officials, such as directors and marketing executives.
Data Triangulation
After arriving at the total market size from the estimation process explained above, the overall market was split into several segments and subsegments. To complete the overall market size estimation process and arrive at the exact statistics for all segments and subsegments, data triangulation and market breakdown procedures have been employed, wherever applicable. The data have been triangulated by studying various factors and trends from both the demand and supply sides. In addition, the market size has been validated by using both the top-down and bottom-up approaches.
Report Objectives
- To define, describe, and forecast the global facade systems market in terms of value
- To provide insights regarding the significant factors influencing the growth of the market (drivers, restraints, opportunities, and challenges)
- To analyze and forecast the market based on Type, End-Use, and Region.
- To forecast the market size, in terms of value, with respect to five main regions: North America, Europe, South America, Asia Pacific, Middle East & Africa.
- To analyze the opportunities in the market for stakeholders and provide details of the competitive landscape
- To strategically profile key players in the market
- To analyze competitive developments in the market, such as new product launches, capacity expansions, and mergers & acquisitions
- To strategically profile the leading players and comprehensively analyze their key developments in the market
Available Customizations:
Along with the given market data, MarketsandMarkets offers customizations as per the specific needs of the companies. The following customization options are available for the report:
Product Analysis:
- Product Matrix, which gives a detailed comparison of the product portfolio of each company
Regional Analysis:
- Further breakdown of the Rest of the APAC Facade systems market
- Further breakdown of the Rest of Europe's Facade systems market
Company Information:
- Detailed analysis and profiling of additional market players (up to 5)


 Generating Response ...


Growth opportunities and latent adjacency in Facade Systems Market