The study involved four major activities in estimating the market size of the n-butanol market. Exhaustive secondary research was done to collect information on the market, the peer market, and the grandparent market. The next step was to validate these findings, assumptions, and sizing with industry experts across the value chain through primary research. Both top-down and bottom-up approaches were employed to estimate the complete market size. Thereafter, the market breakdown and data triangulation procedures were used to estimate the market size of the segments and subsegments.
Secondary Research
In the secondary research process, various secondary sources have been referred to for identifying and collecting information for this study. These secondary sources include annual reports, press releases, investor presentations of companies, white papers, certified publications, trade directories, articles from recognized authors, gold standard and silver standard websites, and databases. Secondary research has been used to obtain key information about the value chain of the industry, monetary chain of the market, the total pool of key players, market classification and segmentation according to industry trends to the bottom-most level, and regional markets. It was also used to obtain information about the key developments from a market-oriented perspective.
Primary Research
The n-Butanol market comprises several stakeholders in the value chain, which include manufacturers, and end users. Various primary sources from the supply and demand sides of the n-butanol market have been interviewed to obtain qualitative and quantitative information. The primary interviewees from the demand side include key opinion leaders in chemical sector. The primary sources from the supply side include manufacturers, associations, and institutions involved in n-butanol industry. Primary interviews were conducted to gather insights such as market statistics, data of revenue collected from the products and services, market breakdowns, market size estimations, market forecasting, and data triangulation. Primary research also helped in understanding the various trends related to type, end-use industry, and region. Stakeholders from the demand side, such as CIOs, CTOs, and CSOs were interviewed to understand the buyer’s perspective on the suppliers, products, component providers, and their current usage of n-butanol and outlook of their business, which will affect the overall market.
The breakdown of profiles of the primary interviewees is illustrated in the figure below:
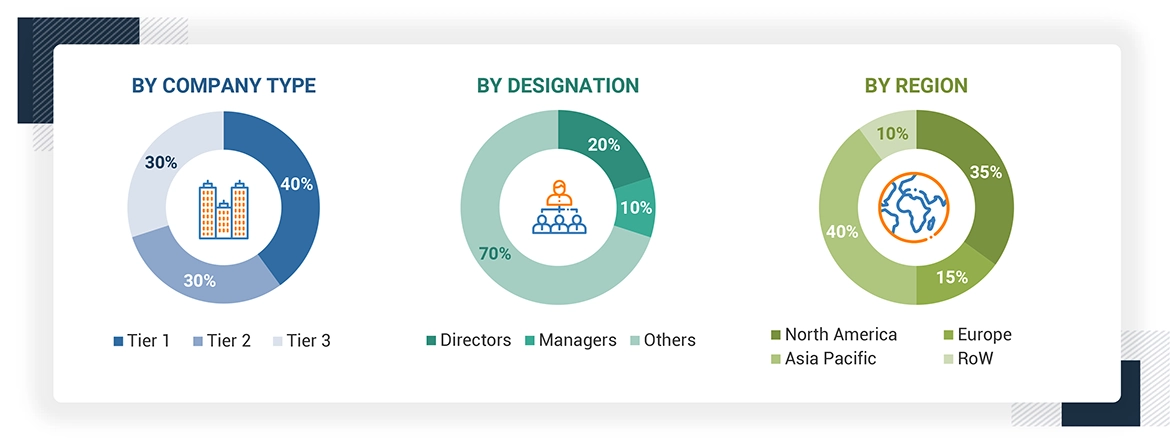
Note: Tier 1, Tier 2, and Tier 3 companies are classified based on their market revenue in 2023 available in the public domain, product portfolios, and geographical presence.
Other designations include consultants and sales, marketing, and procurement managers.
To know about the assumptions considered for the study, download the pdf brochure
Market Size Estimation
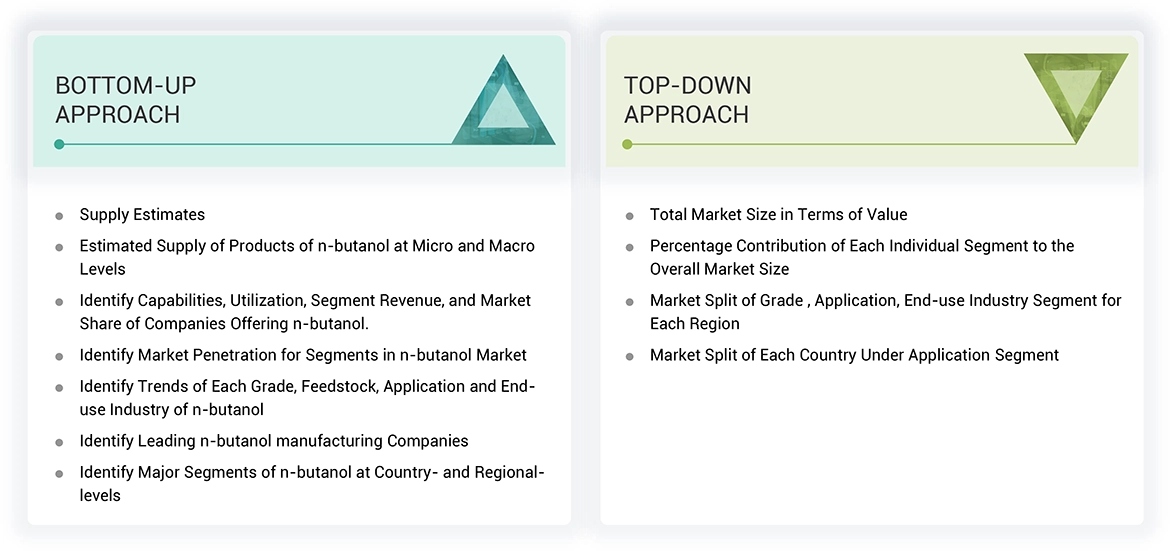
The top-down and bottom-up approaches have been used to estimate and validate the size of the n-butanol market.
-
The key players in the industry have been identified through extensive secondary research.
-
The supply chain of the industry has been determined through primary and secondary research.
-
All percentage shares, splits, and breakdowns have been determined using secondary sources and verified through primary sources.
-
All possible parameters that affect the markets covered in this research study have been accounted for, viewed in extensive detail, verified through primary research, and analyzed to obtain the final quantitative and qualitative data.
-
The research includes the study of reports, reviews, and newsletters of the key market players, along with extensive interviews for opinions with leaders such as directors and marketing executives.
Data Triangulation
After arriving at the total market size from the estimation process, the overall market has been split into several segments and sub-segments. To complete the overall market engineering process and arrive at the exact statistics for all the segments and sub-segments, the data triangulation and market breakdown procedures have been employed, wherever applicable. The data has been triangulated by studying various factors and trends from both the demand and supply sides. Along with this, the market size has been validated by using both the top-down and bottom-up approaches and primary interviews. Hence, for every data segment, there have been three sources—top-down approach, bottom-up approach, and expert interviews. The data was assumed correct when the values arrived from the three sources matched.
Market Definition
The chemical formula for n-butanol, also known as normal butanol or n-butyl, is represented by C3H9OH. It is a transparent liquid with a strong, easily recognizable smell. From a chemical standpoint, n-butanol is distinguished by its boiling point of 117.7°C and freezing point of -89.0°C. The substance has a density of approximately 0.8109 g/cm3 at a temperature of 20 degrees Celsius. It has limited solubility in water, around 7.7% by weight at the same temperature, but can dissolve in various organic solvents like ethanol and ether. Because of its tendency to easily catch fire, n-butanol is commonly utilized. It is used in a variety of industries for its function as a solvent and as a chemical intermediary in the creation of other substances.
Stakeholders
-
Senior Management
-
End User
-
Finance/Procurement Department
-
R&D Department
-
Manufacturers
-
Raw Material Suppliers
Report Objectives
-
To define, describe, and forecast the size of the n-butanol market, in terms of value and volume.
-
To provide detailed information regarding the major factors (drivers, opportunities, restraints, and challenges) influencing the growth of the market
-
To estimate and forecast the market size based on grade, distribution channel, feedstock, application, end-use industry, and region.
-
To forecast the size of the market with respect to major regions, namely, Europe, North America, Asia Pacific, Middle East & Africa, and South America, along with their key countries
-
To strategically analyze micromarkets with respect to individual growth trends, prospects, and their contribution to the overall market
-
To analyze opportunities in the market for stakeholders and provide a competitive landscape of market leaders.
-
To track and analyze recent developments such as expansions, new product launches, partnerships & agreements, and acquisitions in the market.
-
To strategically profile key market players and comprehensively analyze their core competencies.


 HIGHEST CAGR MARKET IN 2023
 INDIA FASTEST GROWING MARKET IN THE REGION


Dr
Jul, 2019
global butanol market.
Marzouk
Aug, 2019
Interested in understanding n-Butanol market report.
Matt
Jun, 2015
General information on the n-butanol and ETAC markets.
Marwa
Feb, 2016
Need information on manufacturing process for n-butyl acetate for a business project..
Nolan
Sep, 2018
Information on the n-Butanol market.
muhammad
Sep, 2019
Market analysis of n Butanol including production and producer of n Butanol.
Daniela
Sep, 2015
Looking for information on n-butanol market..
REN
Jan, 2019
Need infromation on sustainable production methods of biobutanol..
Reeba
Oct, 2015
Information on N Butanol buyers in Asia Pacific region.
Oriol
Jan, 2018
General information on market.
Luiz
Feb, 2019
Information on ABE solvents market.
Emine
Dec, 2017
N- butanol Market report.
divya
Nov, 2016
export and import data of butanol across the world, annual production, key players and their route of production-whether biobutanol or petrbutanol..
shuhsma
Apr, 2016
current market report on this product. The focus would be to identify is the best market, list the current buyers and sellers and the realist purchase / selling price. .
Javad
Jan, 2015
New routs to produce chemicals by biotechnological routs..
Klaas
Jan, 2015
Market data for the global N-Butanol market .