
Adhesives & Sealants Market

Adhesives & Sealants Market by Adhesive Technology (Water-based, Solvent-based), Adhesive Application (Building & Construction, Paper & Packaging), Sealant Resin Type (Silicone, Acrylic), Sealant Application (Building & Construction, Consumer), and Region - Global Forecast to 2030


ADHESIVES & SEALANTS INDUSTRY REPORT
Source: Secondary Research, Interviews with Experts, MarketsandMarkets Analysis | Updated on : April 29, 2026
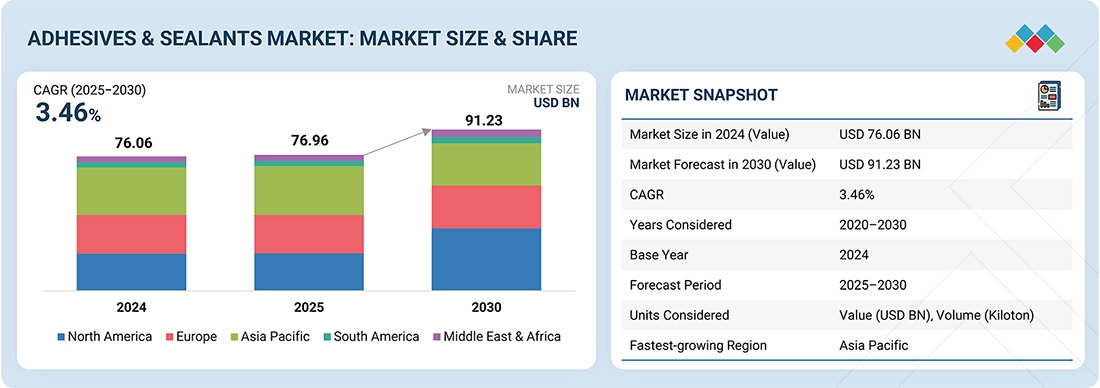
Adhesives & Sealants Industry Report: Adhesives & Sealants Market was valued at USD 76.96 billion in 2025 and is projected to reach USD 91.23 billion by 2030, growing at 3.46% cagr from 2025 to 2030. Adhesives & sealants are specialized chemical formulations designed to bond, seal, and protect materials. Adhesives are primarily used to hold two surfaces together for extended periods, ensuring durability and strength in applications ranging from packaging to construction. Sealants, on the other hand, are used to join two surfaces while filling the gaps between them, thereby providing a protective barrier against environmental factors such as moisture, dust, and chemicals. Adhesives & sealants play a crucial role in enhancing product performance, durability, and efficiency across industries, including automotive, electronics, healthcare, packaging, and construction. The global adhesives and sealants industry is expanding due to the growth of the e-commerce sector, the food and beverage packaging industry, and the promotion of sustainable packaging solutions worldwide.
KEY TAKEAWAYS
-
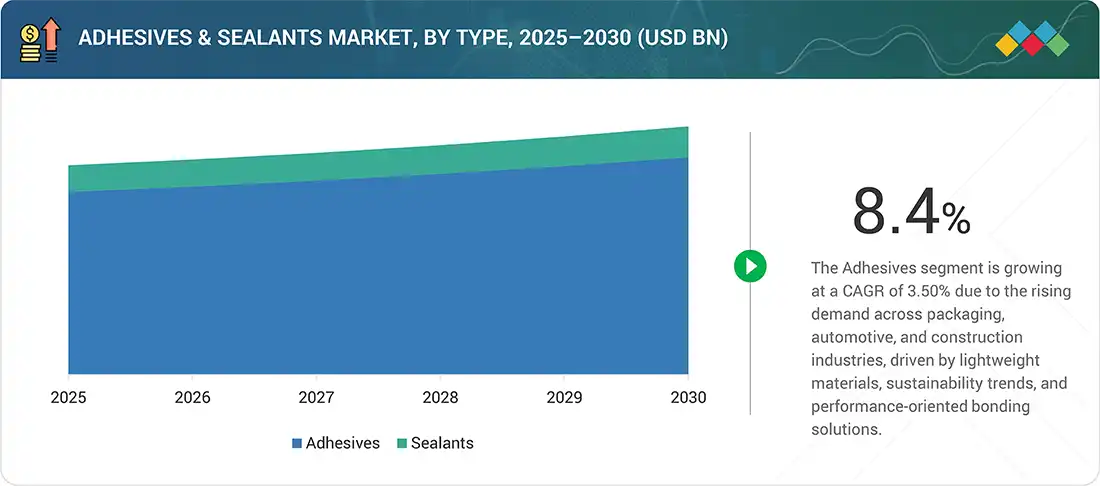
BY TYPEThe adhesives segment in the adhesives & sealants market is growing at a CAGR of 3.50%, driven by increasing applications such as packaging, automotive, and construction, where strong bonding, lightweight solutions, and sustainability demands are accelerating adoption over traditional mechanical fastening methods.
-
BY ADHESIVE APPLICATIONThe electronics segment in the adhesives market is projected to register the fastest CAGR of 5.41%, driven by the increasing demand for miniaturization, advanced electronic devices, and reliable bonding solutions that ensure durability, heat resistance, and efficient performance in compact components.
-
BY ADHESIVES TECHNOLOGYHot-melt technology is growing at a CAGR of 3.63% due to rapid, solvent-free curing compatible with high-speed packaging and converting lines, excellent substrate versatility, lower VOCs, energy-efficient processing, and alignment with sustainability and automation trends.
-
BY SEALANTS RESIN TYPEThe polyurethane resin segment is projected to register a CAGR of 3.83%, driven by its superior flexibility, strong adhesion, abrasion resistance, and weather resistance. Furthermore, advancements in low-VOC and waterborne formulations make it the preferred choice for construction joints, glazing, automotive sealing, and industrial applications.
-
BY APPLICATION SEALANTSThe automotive and transportation segment is growing at a CAGR of 3.54%, driven by the demand for lightweight vehicles, durability, noise reduction, and enhanced bonding solutions that meet safety and performance standards.
-
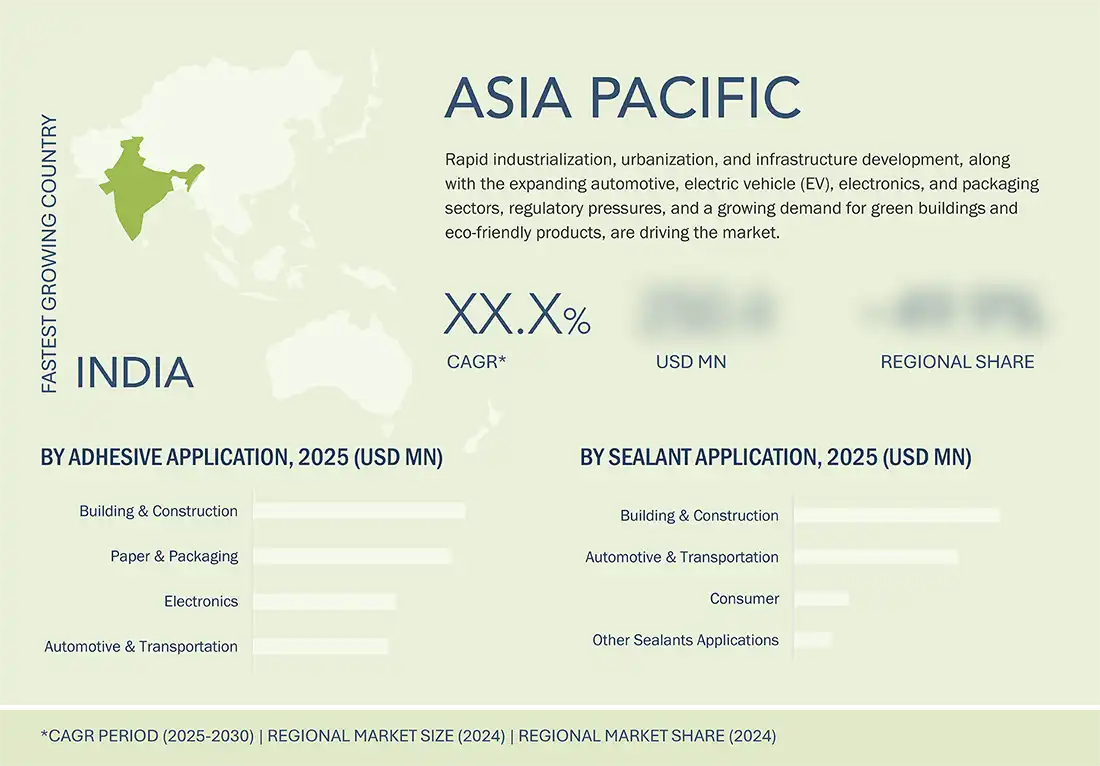
BY REGIONThe Asia Pacific market is growing at the fastest rate due to rapid industrialization, expanding automotive and construction sectors, rising electronics manufacturing, and increasing packaging demand, supported by urbanization, infrastructure investments, and a strong shift toward sustainable bonding solutions.
-
COMPETITIVE LANDSCAPEThe major market players have adopted both organic and inorganic strategies, including expansions, collaborations, acquisitions, and investments. For instance, Solvay and Aquatic Concept Group (ACG) signed an agreement to collaborate in pursuit of sustainable growth in their worldwide aquaculture operations. Aquatic is a Norway-based leading supplier of solutions in the food industry. It manufactures products in the fields of hygiene, processing equipment, professional cleaning, and consultancy. This partnership has helped the companies expand the distribution channel for peroxide products.
The adhesives & sealants market is expected to grow due to the rapid development of construction and infrastructure markets, which leads to extensive use of sealants and adhesives in flooring, roofing, insulation, and glazing applications, which is the leading market driver of adhesives and sealants. Demand is further growing with the automotive and transportation sectors expanding, particularly as the industry transitions to lighter automobiles and electric vehicles, and adhesives and sealants have become substitutes for conventional fasteners. Another significant motor is increasing consumption in electronics and packaging, which is backed by other trends like miniaturization of the device and the boom of e-commerce. Moreover, the medical industry presents expanded markets by using biocompatible adhesives and sealants in medical products, wound healing, and drug systems. Tighter environmental standards in Europe and North America are catalyzing the switch to low-VOC, water-based, and bio-based alternatives to current products, and the rapid industrialization of emerging economies, especially in the Asia Pacific and Latin America region, is also driving market growth in applications.
ADHESIVES & SEALANTS MARKET TRENDS & DISRUPTIONS IMPACTING CUSTOMERS' CUSTOMERS
An emerging application of adhesives & sealants in healthcare is their use in advanced medical devices and wound care solutions. Hospitals are increasingly choosing these materials over traditional fasteners because they offer stronger bonding, reduce the risk of infection, and enhance patient comfort. Their effectiveness in assembling disposable devices, securing surgical instruments, and facilitating minimally invasive procedures makes them a valuable solution for modern healthcare practices.
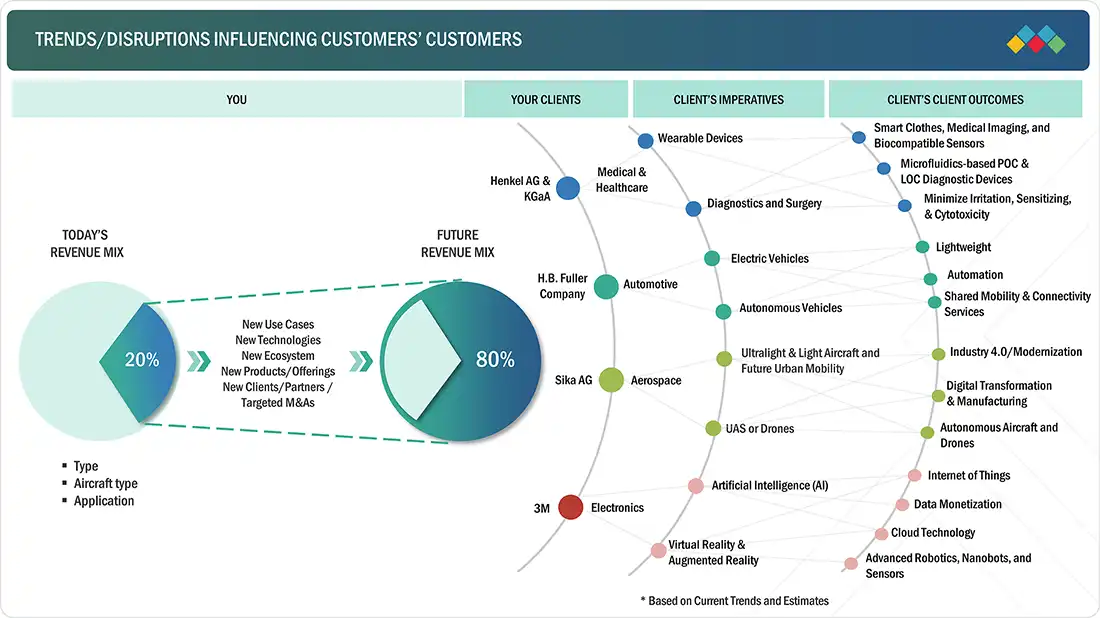
Source: Secondary Research, Interviews with Experts, MarketsandMarkets Analysis
ADHESIVES & SEALANTS INDUSTRY DYNAMICS
Level
-
Growth of building & construction industry

-
Increased demand for adhesives in medical industry

Level
-
Stringent environmental regulations in North America and Europe

-
Technological limitations in adhesive industry

Level
-
Investments in emerging markets of Asia Pacific

-
Increased industrial activity due to globalization

Level
-
Regulatory compliances

Source: Secondary Research, Interviews with Experts, MarketsandMarkets Analysis
Driver: Growth of building & construction industry
One of the primary drivers of the adhesives & sealants market is the growth of the building and construction industry. These materials have a wide range of applications, including flooring, roofing, paneling, insulation, tiling, joint sealing, and structural glazing. They are known for their high bonding strength, flexibility, and durability, which often surpass that of conventional mechanical fasteners. The increasing pace of urbanization, population growth, and rising disposable incomes are contributing to the demand for housing, commercial space, and large-scale infrastructure projects in both developed and developing regions. The Asia Pacific area is experiencing significant growth, partly due to government-sponsored programs aimed at developing smart cities and transportation systems. At the same time, there is a rising demand for low-VOC, water-based, and bio-based adhesives and sealants as part of the trend toward green building and sustainable construction materials. Additionally, advancements in construction technology, such as prefabrication and modular construction, are creating more opportunities for high-performance adhesives and sealant solutions.
Restraint: Stringent environmental regulations in North America and Europe
Tightening environmental regulations in Europe and North America are impacting the adhesives & sealants market by restricting the use of solvent-based systems that contain high levels of volatile organic compounds (VOCs). To reduce emissions, regulatory authorities such as the Environmental Protection Agency (EPA) in the US and the European Chemicals Agency (ECHA) have implemented strict measures to promote safer and more sustainable alternatives. These environmental concerns are pushing manufacturers in the industry to adopt water-based, hot-melt, and bio-based formulations. While these alternatives may offer better environmental performance, they often come with increased costs, technical challenges, and performance limitations compared to traditional solvent-based products. As a result, compliance with these regulations introduces additional costs for producers and constrains market growth in these regions.
Development of hybrid resins for manufacturing high-performance adhesives
The trend toward hybrid resins presents significant potential for use in adhesives & sealants. These hybrid resins can merge the most desirable properties from various chemistries into a single form, providing high-performance bonding solutions. By combining the flexibility and strength of polyurethane with the excellent adhesion and chemical resistance of epoxy or acrylic systems, hybrid resins deliver mechanical strength, durability, and resilience against heat, moisture, and chemicals. These advanced formulations are increasingly being applied in sectors such as automotive, construction, electronics, and medicine, where traditional adhesives often fall short of performance requirements. Moreover, hybrid resins align with the growing environmental awareness that drives the demand for eco-friendly or low-VOC materials. This not only enhances their functionality but also supports the development of more robust, environmentally friendly solutions.
Challenge: Regulatory compliances
Regulatory compliance poses a significant challenge for the adhesives & sealants industry, particularly in Europe and North America, where environmental and health regulations are very strict. The regulation of volatile organic compounds (VOCs), hazardous chemicals, and solvent-based formulations is especially stringent, leading to higher production costs and necessitating ongoing reformulation of products. Adhering to regulations such as REACH in Europe and EPA regulations in the US requires extensive testing, certification, and documentation, which delays product development cycles. Additionally, there is a growing demand for bio-based, low-VOC, and sustainable formulations, which entail increased research and development (R&D) investments and higher raw material costs. These regulatory pressures can hinder market growth, particularly for small- and medium-sized manufacturers, making compliance one of the major obstacles faced by the adhesives and sealants market.
Adhesives & Sealants Market: COMMERCIAL USE CASES ACROSS INDUSTRIES
| COMPANY | USE CASE DESCRIPTION | BENEFITS |
|---|---|---|
 |
Smartphone screen bonding using optical clear adhesives for display assembly | Enables ultra-thin device profiles while maintaining durability and touch sensitivity |
 |
Structural adhesive bonding of aluminum body panels in vehicle assembly | Reduces vehicle weight by 15–20% while improving crash safety and corrosion resistance |
 |
High-temperature sealants for hydraulic systems in construction equipment | Prevents fluid leakage under extreme operating conditions, reducing maintenance costs |
 |
Heat-seal adhesives for flexible packaging of consumer products | Ensures product freshness and extends shelf life while enabling lightweight packaging |
 |
Biocompatible adhesives for implantable medical device assembly | Provides reliable long-term bonding in body environment without adverse tissue reaction |
Logos and trademarks shown above are the property of their respective owners. Their use here is for informational and illustrative purposes only.
ADHESIVES & SEALANTS MARKET ECOSYSTEM
The adhesives & sealants market ecosystem involves identifying and analyzing interconnected relationships among various stakeholders, including raw material suppliers, manufacturers, distributors, and end users. Raw material suppliers are the source of raw materials for the adhesives & sealants manufacturers. The manufacturers use technologies to produce adhesives & sealants. The distributors and suppliers are the ones who establish contact between the manufacturing companies and end users to concentrate on the supply chain, increasing operational efficiency and profitability.
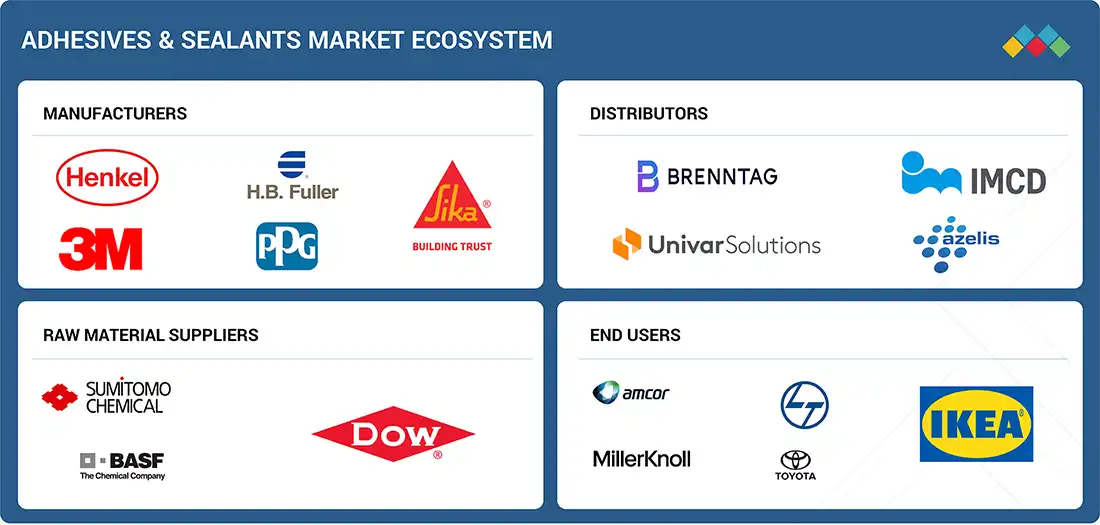
Logos and trademarks shown above are the property of their respective owners. Their use here is for informational and illustrative purposes only.
ADHESIVES & SEALANTS MARKET OUTLOOK & FORECAST (MARKET SEGMENTS)
Source: Secondary Research, Interviews with Experts, MarketsandMarkets Analysis
Adhesives & Sealants Market, by Adhesive Technology
The water-based technology segment dominated the adhesives & sealants market due to its cost-effectiveness and environmentally friendly characteristics. Water-based systems are preferred over solvent-based technologies because they have lower VOC emissions, reduced toxicity, and safer handling. They are used in various applications, including packaging, construction, woodworking, and automotive industries. The growing trend toward eco-friendly and sustainable solutions, along with increased adoption in developing markets like the Asia Pacific, has further reinforced the dominance of water-based adhesives & sealants in the global market.
Adhesives & Sealants Market, by Sealant Resin Type
Silicone is the largest sealant resin type in the adhesives & sealants market due to superior performance, which includes high flexibility, weatherability, UV stability, and good durability over a broad temperature window. Along with the major building & construction uses, which include glazing applications, roofing, and facade applications, silicone sealants find applications in the automotive, electronics, and industrial segments, where performance over an extended time is essential. The capacity to resist tough environmental challenges and the high bonding strength with most materials contribute to silicone being the leading sealant resin type in the global adhesives & sealants market.
Adhesives & Sealants Market, by Adhesive Application
The paper & packaging segment dominates the adhesives market, accounting for the largest share compared to all other applications. This strong position is driven by the rapid growth of e-commerce, rising consumer demand for packaged goods, and increasing emphasis on sustainable, lightweight, and recyclable packaging solutions. Adhesives are widely used in carton sealing, labeling, flexible packaging, and specialty packaging to ensure strong bonding, durability, and product safety during transportation and storage. Furthermore, innovations in water-based and hot-melt adhesives are supporting eco-friendly packaging trends, reducing reliance on plastics and enabling compliance with stringent environmental regulations. The continuous shift toward convenience foods, ready-to-eat meals, and fast-moving consumer goods (FMCG) further fuels demand, making paper & packaging the most critical application segment.
REGION
Asia Pacific to be the largest and fastest-growing region in global adhesives & sealants market during forecast period
At the global level, the Asia Pacific region has emerged as both the largest and fastest-growing market for adhesives & sealants. This robust growth is primarily driven by rapid industrialization, expanding automotive and construction sectors, and increasing packaging demands across countries such as China, India, and Japan. The region’s growing manufacturing base, coupled with rising urbanization and infrastructural development, has fueled significant consumption of both adhesives & sealants across diverse applications. Additionally, technological advancements and the adoption of high-performance and eco-friendly products are further accelerating market expansion. Favorable government policies, growing foreign investments, and rising consumer awareness about product quality are also contributing to the region’s leadership in market size and growth trajectory, making the Asia Pacific a critical focus for global market players.
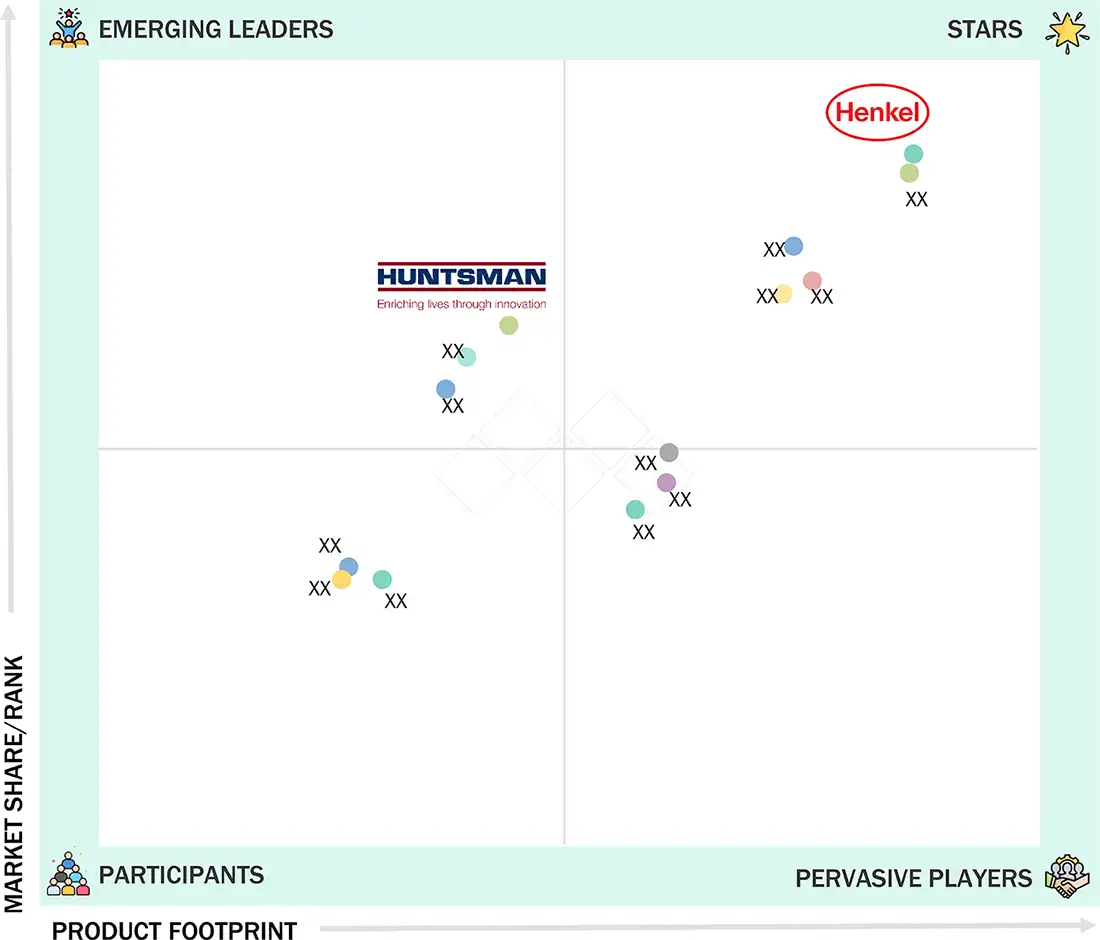
Adhesives & Sealants Market: COMPANY EVALUATION MATRIX
In the adhesives & sealants market matrix, Henkel AG & Co. KGaA (Star) leads with a strong market presence and a wide product portfolio, driving large-scale adoption across the industry. Huntsman Corporation (Emerging Leader) is gaining traction due to its diversified product portfolio, continuous investment in R&D, and focus on high-performance and specialty solutions. While Henkel AG & Co. KGaA dominates with scale, Huntsman Corporation shows strong growth potential to advance toward the leaders’ quadrant.
Source: Secondary Research, Interviews with Experts, MarketsandMarkets Analysis
KEY MARKET PLAYERS
MARKET SCOPE
| REPORT METRIC | DETAILS |
|---|---|
| Market Size in 2024 (Value) | USD 76.06 BN |
| Market Forecast in 2030 (Value) | USD 91.23 BN |
| Growth Rate | CAGR of 3.46% from 2025-2030 |
| Years Considered | 2020−2030 |
| Base Year | 2024 |
| Forecast Period | 2025−2030 |
| Units Considered | Value (USD Billion), Volume (Kiloton) |
| Report Coverage | Revenue forecast, company ranking, competitive landscape, growth factors, and trends |
| Segments Covered | • By Type: Adhesives and Sealants • By Adhesive Application: Water-based Adhesives, Solvent-based Adhesives, Hot-melt-based Adhesives, and Reactive & Others • By Adhesive Technology: Paper & Packaging, Building & Construction, Woodworking, Consumer & DIY |
| Regions Covered | Asia Pacific, North America, Europe, South America, and Middle East & Africa |
WHAT IS IN IT FOR YOU: Adhesives & Sealants Industry REPORT CONTENT GUIDE
DELIVERED CUSTOMIZATIONS
We have successfully delivered the following deep-dive customizations:
| CLIENT REQUEST | CUSTOMIZATION DELIVERED | VALUE ADDS |
|---|---|---|
| Europe-based Adhesives & Sealants Manufacturer | • Detailed Europe based company profiles of competitors (financials, product portfolio) • Customer landscape mapping by end-use sector • Partnership ecosystem analysis | • Identify interconnections and supply chain blind spots • Detect customer migration trends across the industry • Highlight untapped customer clusters for market entry |
| Asia Pacific-based Adhesives & Sealants Manufacturer | • Global & regional production capacity benchmarking • Customer base profiling across the application industries | • Strengthen forward integration strategy • Identify high-demand customers for long-term supply contracts • Assess supply-demand gaps for competitive advantage |
RECENT DEVELOPMENTS
- November 2023 : Henkel launched a novel medical-grade light-cure adhesive designed for devices worn on the body. The new product is formulated without isobornyl acrylate (IBOA) or known skin-sensitizing monomers. The solutions have also been tested for skin sensitization, making them suitable for various medical applications, including wearable devices.
- May 2023 : Bostik introduced its latest smart adhesive solutions, SG6518 and SG6520, for woodworking under its Supergrip adhesive solutions line. Supergrip is a hot-melt polyurethane reactive (HMPUR) adhesive solution produced for edge banding in the woodworking industry.
- February 2023 : 3M?Company unveiled its new medical adhesive that can stick to the skin for up to 28 days. It is intended for use with various health monitors, sensors, and long-term medical wearables.
- January 2023 : H.B. Fuller Company launched Swift Melt 1515-I, its first bio-compatible product compliant in India, the Middle East, and Africa. The product is for microporous medical tape applications used in stick-to-skin under unique climatic conditions, such as the high temperatures and humidity in the Indian sub-continent.
Table of Contents
 Exclusive indicates content/data unique to MarketsandMarkets and not available with any competitors.
Methodology
The study involved four main activities in estimating the adhesives & sealants market size. Extensive secondary research was conducted to gather information on the market, its peer markets, and its parent market. The next step was to validate these findings, assumptions, and size estimates with industry experts across the value chain through primary research. Both top-down and bottom-up approaches were used to calculate the complete market size. Then, market breakdown and data triangulation procedures were employed to estimate the sizes of segments and subsegments.
Secondary Research
Secondary sources used in this study included annual reports, press releases, and investor presentations from companies; white papers; certified publications; articles by recognized authors; and reputable websites such as Factiva, ICIS, Bloomberg, and others. The study’s findings were verified through primary research by conducting extensive interviews with key officials like CEOs, VPs, directors, and other executives.
Primary Research
The adhesives & sealants market includes stakeholders such as raw material suppliers, end-product manufacturers, and regulatory organizations involved in the supply chain. The demand side of this market is driven by key opinion leaders across various applications for adhesives & sealants. The supply side is influenced by technological advancements and diverse application industries. Interviews with primary sources from both the supply and demand sides of the market provided qualitative and quantitative information.
The breakdown of profiles of the primary interviewees is illustrated in the figure below:

Note: Tier 1, Tier 2, and Tier 3 companies are classified based on their market revenue in 2023/2024, available in the public domain, product portfolios, and geographical presence.
Other designations include consultants and sales, marketing, and procurement managers.
To know about the assumptions considered for the study, download the pdf brochure
| COMPANY NAME | DESIGNATION | |
|---|---|---|
| 3M Company | Supply Chain Manager | |
| Henkel AG & KGaA | Senior Director | |
| H.B. Fuller Company | Vice President | |
| Arkema (Bostik) | Assistant Manager | |
| Dow Inc | Executive Director | |
Market Size Estimation
Both top-down and bottom-up approaches were used to estimate and validate the total size of the adhesives & sealants market. These methods were also used extensively to estimate the size of various subsegments within the market. The research methodology used to estimate the market size includes the following:
- The key players in the industry have been identified through extensive secondary research.
- The industry’s supply chain has been mapped through both primary and secondary research.
- All percentage shares, splits, and breakdowns have been calculated using secondary sources and verified with primary sources.
- All relevant parameters affecting the markets covered in this research have been thoroughly examined, verified through primary research, and analyzed to produce the final quantitative and qualitative data.

Data Triangulation
After determining the overall market size—using the market size estimation processes described above, the market was divided into several segments and subsegments. Data triangulation and market breakdown methods were used as needed to complete the entire market analysis and obtain precise data for each segment and subsegment. The data was triangulated by examining various factors and trends from both the demand and supply sides in the adhesives & sealants industry.
Market Definition
Adhesives & sealants are specialized chemical formulations designed to bond, seal, and protect materials. Adhesives are primarily used to hold two surfaces together for extended periods, ensuring durability and strength in applications ranging from packaging to construction. Sealants, on the other hand, are used to join two surfaces while filling the gaps between them, thereby providing a protective barrier against environmental factors such as moisture, dust, and chemicals. Adhesives & sealants play a crucial role in enhancing product performance, durability, and efficiency across industries, including automotive, electronics, healthcare, packaging, and construction.
Stakeholders
- Manufacturers, dealers, and suppliers of adhesives & sealants and their raw materials
- Manufacturers across various end-use industries such as paper & packaging, building & construction, woodworking, automotive & transportation, consumer & DIY, leather & footwear, assembly, medical, electronics, and others
- Traders, distributors, and suppliers of adhesives & sealants
- Regional manufacturers’ associations and adhesives & sealants associations
- Government agencies, regional agencies, and research organizations
Report Objectives
- To analyze and forecast the adhesives & sealants market in terms of value and volume
- To provide detailed information about the key factors (drivers, restraints, opportunities, and challenges) influencing market growth
- To define, segment, and project the size of the global adhesives & sealants market based on adhesive technology, adhesive application, sealant resin type, sealant application, and region
- To project the market size for the five main regions: North America, Europe, Asia Pacific, the Middle East & Africa, and South America, with their key countries
- To analyze the micromarkets1 concerning individual growth trends, prospects, and their contribution to the overall market
- To analyze opportunities in the market for stakeholders and provide a competitive landscape of the market leaders
- To track and analyze R&D and competitive developments such as expansions, product launches, collaborations, investments, partnerships, agreements, developments, collaborations, and mergers & acquisitions in the adhesives & sealants market
Key Questions Addressed by the Adhesives & Sealants Industry Report
Who are the major players in the adhesives & sealants market?
Major companies include Henkel AG & KGaA, H.B. Fuller Company, Sika AG, Arkema (Bostik), 3M, Huntsman Corporation, Illinois Tool Works Inc., Avery Dennison Corporation, Dow Inc, Wacker Chemie AG, RPM International, Akzo Nobel N.V., and PPG Industries.
What are the drivers and opportunities for the adhesives & sealants market?
Growth in the building & construction, medical, and appliances industries drives the market. Opportunities lie in the development of hybrid adhesives and ongoing technological advancements.
Which strategies are the key players focusing on in the adhesives & sealants market?
Leading companies are adopting product launches, mergers & acquisitions, strategic agreements, and capacity expansions to enhance global reach and product offerings.
What is the expected growth rate of the adhesives & sealants market between 2025 and 2030?
The market is projected to grow at a CAGR of 3.46% during the forecast period.
Which major factors are expected to restrain market growth during the forecast period?
Regulatory compliance and stringent environmental regulations in developed regions are expected to act as key restraints.
Need a Tailored Report?
Customize this report to your needs
Get 10% FREE Customization
Customize This ReportPersonalize This Research
- Triangulate with your Own Data
- Get Data as per your Format and Definition
- Gain a Deeper Dive on a Specific Application, Geography, Customer or Competitor
- Any level of Personalization
Let Us Help You
- What are the Known and Unknown Adjacencies Impacting the Adhesives & Sealants Market
- What will your New Revenue Sources be?
- Who will be your Top Customer; what will make them switch?
- Defend your Market Share or Win Competitors
- Get a Scorecard for Target Partners

Custom Market Research Services
We Will Customise The Research For You, In Case The Report Listed Above Does Not Meet With Your Requirements
Get 10% Free CustomisationTESTIMONIALS

We at Nissan Chemicals Corporation have been clients of MarketsandMarkets for more than a year now. We recently consulted MarketsandMarkets for a study, the team at MarketsandMarkets was extremely professional and organized. The business insights were very detailed and aligned well with our expectations that really helped us formulate the Business Plans and device new strategies for development themes. MarketsandMarkets offers a unique combination of expertise and dedicated engagement model. Their research findings have helped us in designing our Pricing Strategy which will make it easier for us to predict the future sales and profits for the next ten years. We look forward to working with MarketsandMarkets in the future.
VP of Strategy & New Business Development
Leading Specialty Chemical Company
The MarketsandMarkets Engagement Model, composed of both the Knowledge Store and advisory custom research, has greatly helped us in understanding our markets and making strategic decisions. The Knowledge Store is a fast way to allow everyone in our organization to understand more about most any market they are interested in. The ability to then get custom research done and get answers to specific strategic questions and market insight has been spectacular. The Markets and Markets team feel more like colleagues than vendors and their services have helped us change our culture where statements of things like growth opportunities and competitive position are always backed by industry research.

Rich Gibson,
Director, Corporate Strategy
Milliken & Company,
Leading Industrial Manufacturer of specialty chemical, floor covering, performance and protective textile materials, and healthcaremilliken.com
MarketsandMarkets is a trusted resource that helps us to better understand markets that are near-adjacencies-whether its technology, value chain or geography. Their Knowledge Store platform provides a dashboard of markets and their characteristics which is easy to use and saves us time.
Adam Shaw,
Market Development and Strategy Manager
AdvanSix Inc. USA,
An American Leader in Chemicalswww.advansix.com
The Knowledge Store from MarketsandMarkets is a valuable tool which has helped my team acquire greater insight in to the end markets that our business serves. This has enabled us to help our company build stronger strategies throughout our planning process.
TOSHIO KINOSHITA
Senior Chif Consultion Research & Consulting Division
Mitsubishi Chemical Research Corporation,
Leading Manufacturer of Chemical Productswww.mitsubishichem-res.co.jp/en/

We recently engaged with MarketsandMarkets for a study, the team not only clearly understood our business objectives but was also extremely professional in the way they handled the entire project. The study was efficiently conducted in a phase-wise manner, and the engagement model furnished us with high-quality business insights that far exceeded our expectations at each phase. We were especially happy that MarketsandMarkets could provide us with both, an English as well as a Japanese version of the study. A special thanks to the Analyst Team and Client Services Team, whose fluency in Japanese enhanced our comfort level, as we could converse with them in our preferred language.
Independent entrepreneurs
Arrow Precision
We approached MarketsandMarkets for study on Proppants Market, and their work exceeded our expectations. The study conducted was comprehensive and enabled us to view the market through the various dimensions. In addition, the team was extraordinarily responsive throughout the process and resolved our queries on time. I strongly recommend MarketsandMarkets and will certainly consider them for additional market assessments we will need in the future.
Global engineering company, Japan
Deputy Manager,
Strategic Planning OfficeThe high-quality insights shared by the MarketsandMarkets team helped us understand the pharmaceutical plant designers in a specific geography. It also captured the risks that we may likely face in communicating with our potential partners. The study would enable us identify partners, which would impact our future growth.
Growth opportunities and latent adjacency in Adhesives & Sealants Market


Leena
Dec, 2015
Market dynamics, growth trends, key manufacturers, and raw material analysis, different applications present in the market.
Steffen
Jan, 2019
General information on Adhesives Market.
Madhurima
Jul, 2013
Oil & Gas market in India, Future of Telecom in India, Railways and Power. Manufacturers of sealant, adhesives , putty etc in india.
Madhurima
Jul, 2013
Data on potential market assessment of cable glands, sealant, putty etc in the segments such as Oil & Gas, Power, energy, Railways and Telecom Markets in India. .
Zaw
Mar, 2016
Require report list of seanat, adhesive, weld-crete, PU foam, and others.
Kenneth
May, 2012
General information on European adhesives and sealants market .
Gabriele
Aug, 2017
Report title not mentioned.
Masami
Mar, 2019
Interested in global market..
Burcu
May, 2015
General information on Adhesives & Sealants market by material.
Tim
Nov, 2014
Global Adhesives: Market Revenue, By Applications,2011 � 2018 ($Million) Sealants: Market Revenue, By Applications,2011 � 2018 ($Million) and for Europe.
Sandra
Feb, 2017
Market data for global Superplasticizers market.
kishan
Feb, 2015
sample data needed for demand drivers of adhesives and sealants industry in india.
Timothy
Jan, 2015
Interested in Woodflooring adhesives and Sealants..
Hans-Joachim
Jun, 2012
Looking for global adhesie market breakdown by Suppliers and future growth prospects.
Hans-Joachim
Jun, 2012
Global adhesive market split by suppliers (% share) by technology PUR, epoxy , acrylic etc. and future growth rate.
Nick
Apr, 2017
Adhesives (non consturction). i.e. Cyanoacylates, Epoxys, PVAs, PUs, SMPs, etc, for small job "repair and create" use..
Andrew
May, 2022
How big is the Adhesives And Sealants Market ? Do you have information on Adhesives And Sealants Market Size upto 2030 ? Report Attributes, Report coverage, Revenue forecast. Need this data at the earliest. Can you help ?.
Samantha
May, 2015
Interested in forecast, historical, per capita of global adhesives and sealants market.
Justin
Jun, 2012
Interested in thermoset adhesives such as PU or polycarbonate.
Justin
Jun, 2012
Thermoset adhesives, specifically those that are polycarbonate polyol based or polyurethanes and chemistries.
Donyaporn
Apr, 2015
Market value of adhesive market by technology (solvent, hotmelt, water based) in Thailand. .
Khaled
Feb, 2014
interetsed to about lamination adhesives market in UAE in terms of market size , current local production size and expected growth for the next 3 years (flexible packaging segment ).
Sigal
Dec, 2013
Purchase inquiry for Adhesives & Sealants market report.
Rahul
Jun, 2019
Market potential of Tile Adhesives in India, with a focus on Southern Region for a startup. .
Jack
Apr, 2017
Specific information on application of Adhesives & Sealants for electrically conductive, thermal, and UV-cured .
Mark
Oct, 2014
Need broad understanding of entire adhesives and sealants industry.
Csaszar
Sep, 2019
Find general informations about Adhesives and Sealants market..
Piyal
Jul, 2017
Bonding techniques in Fabric and future outlook.
JK
Oct, 2015
Interested in Tire Sealant, Hot melt Adhesive, Pressure sensitive adhesive.
JK
Oct, 2015
Adhesive and sealant for Tire Application.
jaime
Sep, 2016
Contact Adhesive Market.
Birendra
Sep, 2015
Coverage of off the shelf reports adhesive portfolio. Also wants to lear about overall global market of adhesive.
Birendra
Sep, 2015
Needed Adhesive market for book report .
Abhishek
Apr, 2013
Interested in comparitive study of natural adhesives vs their polymeric counterparts.
Seung
Mar, 2017
Global adhesive market and trends.
Deepakraja
Mar, 2016
Adhesives sales growth from 2012 to 2018 along with technology growth..
Zeeshan
Mar, 2016
Interested in Polyamide,Polyurethane,Water Based,Solventless and Solvent Based Adhesive for flexible packaging lamination.
Koshy
Jan, 2015
Information on Oil and Gas Sealant Market.
Alexander
Aug, 2017
General information on specialty adhesives market .
Alice
Feb, 2018
SOLVENT-BASED ADHESIVES MARKET.
DILIP
Jan, 2014
Information on India Adhesives market by Volume and Value.
Mark
Oct, 2014
Interested in market for Malaysia, Indonesia, Hongkong, Singapore, and Thailand.
SONER
Sep, 2017
required more information.
Kelvin
Dec, 2018
General information on two reports i.e. adhesive and sealant & ink additives .
janardhan
Dec, 2015
Interested in bottle label market.
Melissa
Oct, 2017
Report on Adhesives/sealants market.
Nina
Oct, 2017
Specific information for construction silicones, Polyurethane adhesives (1K, 2K- 1/2), MS-Polymers, Plastisoles in the automotive industry.
jalil
Sep, 2016
Market information on acrylic adhesive market globally .
Eduardo
Sep, 2014
Interested in Adhesives & Sealants Market report.
Ek
Aug, 2015
hot melt i.e. technology, industry, and equipment. Future technology as well if possible..
Ek
Aug, 2015
Specific information on hot melt .
Freddy
Aug, 2018
Customer identification for Vinyl Acetate/Ethylene (VAE) Emulsion and 1,4 BDO .
MyeongJin
Aug, 2015
Sample of Hot Melt Adhesive.
Julien
Aug, 2014
Looking for insights on footwear adhesives market.
Andrej
Jul, 2013
Specific information on poland adhesives .
Faheem
Jun, 2019
Cut-off report available?.
Anja
May, 2017
Information on scope of our study with a small description.
john
Apr, 2017
General information on adhesives and sealants market in electronics application.
Rakesh
Mar, 2014
Sealants market by type and Application.
Sharon
Mar, 2020
Can I get a citation reference for this report? .
Aaron
Feb, 2019
Information in adhesives and sealents market.
Vamsikrishna
Feb, 2012
Global polyisobutylene adhesive market .
Madhurima
Jan, 2013
Information on Cable Sealing compounds market potential, Electrical Cabinet manufacturers, Oil & Gas market in India.
Robin
Jan, 2014
Adhesives + sealants in: Agriculture/Construction/Filtration/Appliances/Medical/White goods/Wind energy..