Nanocomposites Market by Type (Carbon Nanotubes, Nanoclay Metal Oxide, Nanofiber, Graphene), Resin Type, Application (Packaging, Automotive, Electrical & Semiconductors, Coatings, Aerospace & Defense, Energy), Region - Global Forecast to 2024


[116 Pages Report] The nanocomposites market is projected to grow from USD 4.1 billion in 2019 to USD 8.5 billion, by 2024, at a CAGR of 16.0%, between 2019 and 2024. The market is growing due to the high demand from packaging, aerospace & defense, automotive, and electronics & semiconductor applications.
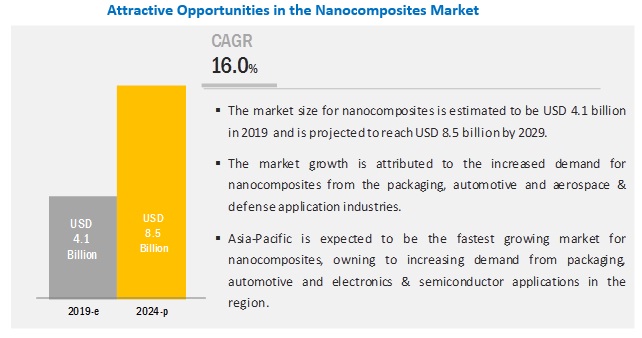
Packaging application to account for largest share in the nanocomposites market in 2019.
The packaging industry dominated the nanocomposites market in 2018, with increasing demand from applications, such as food & beverage, pharmaceuticals, and electronics devices. This increase in demand is mainly due to the improved physical, mechanical, and lightweight properties of polymer nanocomposites. The food is the major application, wherein containers and wrapping films are made of polymer nanocomposites whose demand continues to increase.
Carbon nanotube-based nanocomposites segment is projected to account for highest CAGR, in terms of value, during the forecast period.
The carbon nanotube-based nanocomposites are widely used in electronics & semiconductor application due to their desirable electrical properties. They are considered a viable replacement for IoT (Internet of things) transparent conductors in electronics applications. Fabricated as transparent conductive films (TCF), carbon nanotubes can be used as a highly conductive, transparent, and cost-efficient alternative in flexible displays and touch screens.
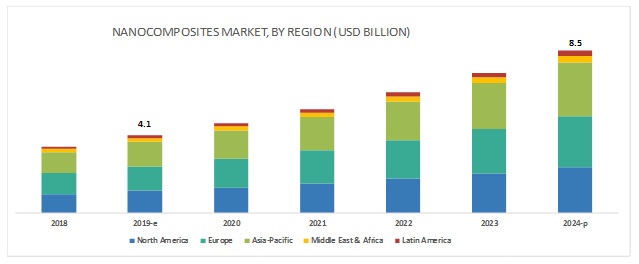
Asia Pacific is expected to lead the nanocomposites market during the forecast period.
Asia Pacific is the largest and the fastest-growing nanocomposites market, in terms of volume. Packaging is a major application of nanocomposites in the region. The presence of a large number of nanocomposites manufacturers and application industry makes the region the most important market for nanocomposites. The presence of an advanced nanocomposites industry and high demand for nanocomposites from the automotive and electronics & semiconductor applications in China are expected to drive the nanocomposite market in Asia Pacific. China is the most important market of nanocomposites in the region, where manufacturers are investing in new material types and R&D activities.
Key Market Players
Some of the key players in the nanocomposites market are General Nanocor Inc. (US), Arkema Inc. (France), Evonik Industries AG (Germany), Showa Denko, K.K. (Japan), and Zyvex Technologies Inc. (US). The key strategy adopted by the major players for enhancing their business revenue is new product development.
Scope of the report
|
Report Metric |
Details |
|
Years considered for the study |
2017–2024 |
|
Base year |
2018 |
|
Forecast period |
2019–2024 |
|
Units considered |
Value (USD), Volume (Ton) |
|
Segments |
Resin Type, Material Type, Application, and Region |
|
Regions |
North America, Europe, Asia Pacific, Middle East & Africa, and Latin America |
|
Companies |
Nanocor Inc. (US), E.I. Du Pont De Nemours (US), Zyvex Technologies Inc. (US), Arkema Inc. (France), Showa Denko K.K. (Japan), Powdermet Inc. (US), RTP Company (US), Nanophase Technologies Corporation (US), Unidym Inc. (US), and Nanocyl S.A. (Belgium). |
This research report categorizes the nanocomposite market based on resin type, material type, application, and region.
On the basis of material type, the nanocomposites market has been segmented as follows:
- Carbon Nanotubes
- Metal oxide
- Nanofiber
- Nanoclay
- Graphene
- Others (Expanded Graphite, Fullerene Fillers, Recycled Paper, Wood, Recycled Fibers)
On the basis of application, the nanocomposites market has been segmented as follows:
- Packaging
- Automotive
- Electronics and Semiconductors
- Coating
- Aerospace & Defense
- Energy
- Others (Marine, Biomedical, Industrial)
On the basis of region, the nanocomposite market has been segmented as follows:
- North America
- Europe
- Asia Pacific (APAC)
- Middle East & Africa (MEA)
- Latin America
Recent Developments
- In March 2015, Zyvex Technologies announced a new product family named ZNT (Zyvex Nanotube Technology). ZNT is a polymer-modified carbon nanotube additive for a wide range of host matrices that include epoxies, elastomers, thermoplastics, and aqueous-based solutions.
Key Questions Addressed by the Report
- Which are the major applications of nanocomposites?
- Which material type is majorly used in nanocomposites?
- Which region is the largest and fastest-growing market for nanocomposites?
- What are the major strategies adopted by the leading market players?
To speak to our analyst for a discussion on the above findings, click Speak to Analyst
 Exclusive indicates content/data unique to MarketsandMarkets and not available with any competitors.
Table of Contents
1 Introduction (Page No. - 15)
1.1 Objectives of the Study
1.2 Market Definition
1.3 Market Scope
1.3.1 Market Segmentation
1.3.2 Years Considered for the Study
1.4 Currency
1.5 Unit Considered
1.6 Limitations
1.7 Stakeholders
2 Research Methodology (Page No. - 18)
2.1 Research Data
2.1.1 Secondary Data
2.1.1.1 Key Data From Secondary Sources
2.1.2 Primary Data
2.1.2.1 Key Data From Primary Sources
2.1.2.2 Key Industry Insights
2.1.2.3 Breakdown of Primary Interviews
2.2 Market Size Estimation
2.2.1 Bottom-Up Approach
2.2.2 Top-Down Approach
2.3 Data Triangulation
2.4 Limitations
2.5 Assumptions
3 Executive Summary (Page No. - 26)
4 Premium Insights (Page No. - 30)
4.1 Attractive Opportunities in the Nanocomposites Market
4.2 Nanocomposite Market, By Application
4.3 Nanocomposites Market, By Material Type
4.4 Nanocomposite Market, By Resin Type
4.5 Nanocomposites Market, By Country
5 Market Overview (Page No. - 33)
5.1 Introduction
5.2 Market Dynamics
5.2.1 Drivers
5.2.1.1 Increasing Use of Nanocomposites in the Packaging Industry
5.2.1.2 Enhanced Physical and Mechanical Properties
5.2.1.3 Growing Demand for Nanocomposites in the Automotive Industry
5.2.2 Restraints
5.2.2.1 Environmental and Health Safety Issues
5.2.3 Opportunities
5.2.3.1 Development of Bio-Based Nanocomposites
5.2.3.2 Increasing High-Value Applications of Graphene-Based Nanocomposites
5.2.4 Challenges
5.2.4.1 High Research & Development and Processing Costs
5.3 Porter’s Five Forces Analysis
5.3.1 Bargaining Power of Suppliers
5.3.2 Bargaining Power of Buyers
5.3.3 Threat of Substitutes
5.3.4 Threat of New Entrants
5.3.5 Intensity of Competitive Rivalry
6 Macroeconomic Overview and Key Trends (Page No. - 39)
6.1 Introduction
6.2 Trends and Forecast of GDP
6.3 Trends in Aerospace Industry
6.4 Trends in Automotive Industry
7 Nanocomposites Market, By Material Type (Page No. - 43)
7.1 Introduction
7.2 Carbon Nanotubes
7.2.1 Growing Demand From Electronics & Semiconductor Applications to Drive Carbon Nanotube-Based Nanocomposites Market
7.3 Metal Oxide
7.3.1 Growing Demand From Packaging and Medical Applications to Drive Metal Oxide-Based Nanocomposites Market
7.4 Nanoclay
7.4.1 Nanoclay Based-Nanocomposites Holds the Largest Share in the Overall Market
7.5 Nanofiber
7.5.1 Nanofiber Based-Nanocomposites Offer Low-Cost Alternative to Carbon Nanotubes
7.6 Graphene
7.6.1 Graphene-Based Nanocomposites Witnessing High Demand in Biomedical Applications
7.7 Other Nanoparticles/Nanofillers
8 Nanocomposites Market, By Resin Type (Page No. - 54)
8.1 Introduction
9 Nanocomposite Market, By Application (Page No. - 57)
9.1 Introduction
9.2 Packaging
9.2.1 Demand for Fresh and Quality Packaged Food Driving the Nanocomposites Market in Packaging
9.3 Automotive
9.4 Electronics & Semiconductor
9.4.1 Solar Cells, Touch Screens, and Transparent Electrodes Emerging as Promising Applications of Nanocomposites
9.5 Coatings
9.5.1 APAC is Largest and Fastest-Growing Market for Nanocomposites in Coatings Applications
9.6 Aerospace & Defense
9.6.1 Europe is the Largest Consumer of Nanocomposites in Aerospace & Defence Application
9.7 Energy
9.7.1 Graphene-Based Nanocomposites Offer Prospective Applications in Energy Sector
9.8 Other Applications
10 Regional Analysis (Page No. - 67)
10.1 Introduction
10.2 North America
10.2.1 US
10.2.1.1 Huge Demand From the Automotive and Electronics Industries and New Technological Developments are Propelling the Market
10.2.2 Canada
10.2.2.1 Growing Consumption in the Packaging and Electronics & Semiconductor Applications is Boosting the Market
10.3 Europe
10.3.1 Germany
10.3.1.1 Germany’s Recognition as A Global Aerospace and Automotive Hub is A Major Driving Factor for the Nanocomposites Market in Europe
10.3.2 UK
10.3.2.1 Growing Packaging and Automotive Industries are Fueling the Market in the UK
10.3.3 France
10.3.3.1 The Strong Base of Major Aircraft Manufacturers in the Country is Helping the Market Growth
10.3.4 Rest of Europe
10.4 APAC
10.4.1 China
10.4.1.1 Expansion By Major Companies and Developments in the Automotive Sector are Expected to Drive the Market
10.4.2 Japan
10.4.2.1 Technology Advancements and CAPACity Expansion are the Two Major Factors That are Driving the Market
10.4.3 South Korea
10.4.3.1 Heavy Investment in the Automotive and Aircraft Manufacturing is Anticipated to Increase Nanocomposite Consumption
10.4.4 India
10.4.4.1 Increasing Aircraft Production and Drive Towards Clean Energy is Likely to Drive the Nanocomposite Market
10.4.5 Rest of APAC
10.5 Latin America
10.5.1 Brazil
10.5.1.1 Brazil is the Largest Consumer of Nanocomposites in Latin America
10.5.2 Mexico
10.5.2.1 Mexico to Play A Key Role in Driving the Market in Latin America
10.6 Middle East & Africa
10.6.1 Saudi Arabia
10.6.1.1 Increasing Demand From Automotive Industries is Driving the Market
10.6.2 UAE
10.6.2.1 High Investment in Packaging, Automotive, and Aerospace Industries is Driving the Market
11 Competitive Landscape (Page No. - 89)
11.1 Overview
11.2 Competitive Leadership Mapping
11.2.1 Dynamic Differentiators
11.2.2 Innovators
11.2.3 Visionary Leaders
11.2.4 Emerging Companies
11.2.5 Strength of Product Portfolio
11.2.6 Business Strategy Excellence
11.3 Market Ranking
12 Company Profiles (Page No. - 94)
(Business Overview, Products Offered, Recent Developments, SWOT Analysis, MnM View)*
12.1 Nanocor Inc.
12.2 E. I. Du Pont De Nemours
12.3 Zyvex Technologies Inc.
12.4 Arkema Inc.
12.5 Showa Denko K.K.
12.6 Powdermet Inc.
12.7 RTP Company
12.8 Nanophase Technologies Corporation
12.9 Unidym Inc.
12.10 Nanocyl S.A.
12.11 Other Companies
12.11.1 Inmat Inc.
12.11.2 Evonik Industries AG
12.11.3 Inframat Corporation
12.11.4 Polyone Corporation
12.11.5 Simcomposites
12.11.6 Unitika Ltd.
12.11.7 Nano Shine Group
12.11.8 Hyperion Catalysis International
12.11.9 Noble Polymers
12.11.10 NEI Corporation
*Details on Business Overview, Products Offered, Recent Developments, SWOT Analysis, MnM View Might Not Be Captured in Case of Unlisted Companies.
13 Appendix (Page No. - 111)
13.1 Discussion Guide
13.2 Knowledge Store: Marketsandmarkets Subscription Portal
13.3 Available Customizations
13.4 Related Reports
13.5 Author Details
List of Tables (69 Tables)
Table 1 Trends and Forecast of GDP, 2017–2024 (USD Billion)
Table 2 Number of New Airplane Deliveries, By Region (2018–2037)
Table 3 Automotive Production, Million Units (2017–2018)
Table 4 Areas of Applications for Different Nanomaterials/Nanofillers
Table 5 Nanocomposites Market Size, By Material Type, 2017–2024 (Kiloton)
Table 6 Nanocomposite Market Size, By Material Type, 2017–2024 (USD Million)
Table 7 Carbon Nanotubes Based Nanocomposites Market Size, By Region, 2017–2024 (Kiloton)
Table 8 Carbon Nanotubes Based Nanocomposite Market Size, By Region, 2017–2024 (USD Million)
Table 9 Metal Oxide Based Nanocomposites Market Size, By Region, 2017–2024 (Kiloton)
Table 10 Metal Oxide Based Nanocompostes Market Size, By Region, 2017–2027 (USD Million)
Table 11 Nanoclay-Based Nanocomposites Market Size, By Region, 2017–2024 (Kiloton)
Table 12 Nanoclay-Based Nanocomposite Market Size, By Region, 2017–2024 (USD Million)
Table 13 Nanofiber Based Nanocomposites Market Size, By Region, 2017–2024 (Kiloton)
Table 14 Nanofiber Based Nanocomposite Market Size, By Region, 2017–2024 (USD Million)
Table 15 Graphene Based Nanocomposites Market Size, By Region, 2017–2024 (Kiloton)
Table 16 Graphene Based Nanocomposite Market Size, By Region, 2017–2024 (USD Million)
Table 17 Other Nanoparticles Based Nanocomposites, By Region, 2017–2024 (Kiloton)
Table 18 Other Nanoparticles Based Nanocomposites Market Size, By Region, 2017–2024 (USD Million)
Table 19 Properties of Thermosetting and Thermoplastics Resins
Table 20 Nanocomposites Market Size, By Resin Type, 2017–2024 (Kiloton)
Table 21 Market Size, By Resin Type, 2017–2024 (USD Million)
Table 22 Market Size, By Application, 2017–2024 (Kiloton)
Table 23 Nanocomposite Market Size, By Application, 2017–2024 (USD Million)
Table 24 Nanocomposite Market Size in Packaging, By Region, 2017–2024 (Kiloton)
Table 25 Market Size in Packaging, By Region, 2017-2024 (USD Million)
Table 26 Market Size in Automotive, By Region, 2017–2024 (Kiloton)
Table 27 Market Size in Automotive, By Region, 2017–2024 (USD Million)
Table 28 Nanocomposites Market Size in Electronics & Semiconductor, By Region, 2017–2024 (Kiloton)
Table 29 Market Size in Electronics & Semiconductor, By Region, 2017–2024 (USD Million)
Table 30 Market Size in Coatings, By Region, 2017–2024 (Kiloton)
Table 31 Market Size in Coatings, By Region, 2017–2024 (USD Million)
Table 32 Nanocomposite Market Size in Aerospace & Defense, By Region, 2017–2024 (Kiloton)
Table 33 Market Size in Aerospace & Defense, By Region, 2017–2024 (USD Million)
Table 34 Market Size in Energy, By Region, 2017–2024 (Kiloton)
Table 35 Market Size in Energy, By Region, 2017–2024 (USD Million)
Table 36 Nanocomposites Market Size in Other Applications, By Region, 2017–2024 (Kiloton)
Table 37 Market Size in Other Applications, By Region, 2017–2024 (USD Million)
Table 38 Market Size, By Region, 2017–2024 (Kiloton)
Table 39 Market Size, By Region, 2017–2024 (USD Million)
Table 40 North America: Nanocomposites Market Size, By Country, 2017–2024 (Kiloton)
Table 41 North America: Nanocomposite Market Size, By Country, 2017–2024 (USD Million)
Table 42 North America: Polymer Nanocomposite Market Size, By Application, 2017–2024 (Kiloton)
Table 43 North America: Graphene Nanocomposites Market Size, By Application, 2017–2024 (USD Million)
Table 44 North America: Market Size, By Material Type, 2017–2024 (Kiloton)
Table 45 North America: Nanoclay Market Size, By Material Type, 2017–2029 (USD Million)
Table 46 Europe: Market Size, By Country, 2017–2024 (Kiloton)
Table 47 Europe: Polymer Nanocomposites Market Size, By Country, 2017–2024 (USD Million)
Table 48 Europe: Market Size, By Application, 2017–2024 (Kiloton)
Table 49 Europe: Graphene Nanocomposite Market Size, By Application, 2017–2029 (USD Million)
Table 50 Europe: Market Size, By Material Type, 2017–2024 (Kiloton)
Table 51 Europe: Market Size, By Material Type, 2017–2024 (USD Million)
Table 52 APAC: Market Size, By Country, 2017–2024 (Kiloton)
Table 53 APAC: Nanocomposite Market Size, By Country, 2017–2024 (USD Million)
Table 54 APAC: Polymer Nanocomposites Market Size, By Application, 2017–2024 (Kiloton)
Table 55 APAC: Nanoclay Market Size, By Application, 2017–2024 (USD Million)
Table 56 APAC: Graphene Nanocomposite Market Size, By Material Type, 2017–2024 (Kiloton)
Table 57 APAC: Market Size, By Material Type, 2017–2024 (USD Million)
Table 58 Latin America: Market Size, By Country, 2017–2024 (Kiloton)
Table 59 Latin America: Nanocomposite Market Size, By Country, 2017–2024 (USD Million)
Table 60 Latin America: Market Size, By Application, 2017–2024 (Kiloton)
Table 61 Latin America: Polymer Nanocomposites Market Size, By Application, 2017–2024 (USD Million)
Table 62 Latin America: Market Size, By Material Type, 2017–2024 (Kiloton)
Table 63 Latin America: Nanoclay Market Size, By Material Type, 2017–2024 (USD Million)
Table 64 Middle East & Africa: Market Size, By Country, 2017–2024 (Kiloton)
Table 65 Middle East & Africa: Nanocomposite Market Size, By Country, 2017–2024 (USD Million)
Table 66 Middle East & Africa: Market Size, By Application, 2017–2024 (Kiloton)
Table 67 Middle East & Africa: Polymer Nanocomposite Market Size, By Application, 2017–2024 (USD Million)
Table 68 Middle East & Africa: Market Size, By Material Type, 2017–2024 (Kiloton)
Table 69 Middle East & Africa: Graphene Nanocomposites Market Size, By Material Type, 2017–2024 (USD Million)
List of Figures (38 Figures)
Figure 1 Nanocomposites Market: Research Design
Figure 2 Market Size Estimation Methodology: Bottom-Up Approach
Figure 3 Market Size Estimation Methodology: Top-Down Approach
Figure 4 Nanocomposites Market: Data Triangulation
Figure 5 Packaging Application Dominates Overall Nanocomposite Market, By Value
Figure 6 Carbon Nanotube Based Nanocomposites Expected to Witness Highest CAGR Between 2019 and 2024 (By Value)
Figure 7 US to Be Fastest-Growing Nanocomposites Market From 2019 to 2024
Figure 8 APAC to Be Fastest-Growing Nanocomposite Market Between 2019 to 2024 (USD Million)
Figure 9 High Demand for Nanocomposites in Packaging Application
Figure 10 Packaging to Be Leading Application of Nanocomposites
Figure 11 Nanoclay to Be the Dominant Segment in the Overall Nanocomposite Market
Figure 12 Thermoplastic Nanocomposites to Dominate the Overall Market
Figure 13 China to Register Highest CAGR in Nanocomposites Market
Figure 14 Drivers, Restraints, Opportunities, and Challenges in the Nanocomposite Market
Figure 15 Porter’s Five Forces Analysis: Nanocomposites Market
Figure 16 Trends and Forecast of GDP, 2018–2024 (USD Billion)
Figure 17 New Airplane Deliveries, By Region (2018–2037)
Figure 18 Automotive Production in Key Countries, Million Units (2017 vs. 2018)
Figure 19 Nanoclay Based Nanocomposites to Dominate the Overall Nanocomposites Market, 2017–2024
Figure 20 APAC Expected to Drive Carbon Nanotubes-Based Nanocomposite Markets
Figure 21 APAC Expected to Drive Nanoclay-Based Nanocomposite Markets
Figure 22 Thermoplastic Resin Based Nanocomposites to Witness Higher CAGR During Forecast Period
Figure 23 Packaging Application to Dominate Nanocomposites Market, 2019–2024
Figure 24 APAC Accounts for Largest Nanocomposite Market in Packaging
Figure 25 APAC Anticipated to Show Highest Growth for Nanocomposites Market in Automotive Application, 2019–2024
Figure 26 APAC to Lead the Nanocomposite Market for All Applications, in Terms of Value, 2019–2024
Figure 27 North America: Nanocomposite Market Snapshot
Figure 28 Europe: Nanocomposites Market Snapshot
Figure 29 APAC: Nanocomposite Market Snapshot
Figure 30 Competitive Leadership Mapping: Nanocomposite Market
Figure 31 Nanocor Inc.: SWOT Analysis
Figure 32 E. I. Du Pont De Numours: Company Snapshot
Figure 33 E. I. Du Pont De Numours: SWOT Analysis
Figure 34 Zyvex Technologies Inc.: SWOT Analysis
Figure 35 Arkema Inc.: Company Snapshot
Figure 36 Arkema Inc.: SWOT Analysis
Figure 37 Showa Denko K.K.: Company Snapshot
Figure 38 Showa Denko K.K.: SWOT Analysis
The study involved four major activities in estimating the current market size for nanocomposites. Exhaustive secondary research was done to collect information on the market, peer market, and parent market. The next step was to validate these findings, assumptions, and sizing with industry experts across the value chain through primary research. Both top-down and bottom-up approaches were employed to estimate the complete market size. Thereafter, market breakdown and data triangulation procedures were used to estimate the size of market segments and subsegments.
Secondary Research
In the secondary research process, various secondary sources such as Hoovers, Bloomberg BusinessWeek, and Dun & Bradstreet were referred to identify and collect information for this study. These secondary sources included annual reports, press releases & investor presentations of companies; white papers; certified publications; articles by recognized authors; gold standard & silver standard websites; regulatory bodies; trade directories; and databases.
Primary Research
The nanocomposites market comprises several stakeholders, such as raw material suppliers, processors, end-product manufacturers, and regulatory organizations in the supply chain. The demand side of this market is characterized by the development of the various industries, such as aerospace & defense, automotive, and industrial. The supply side is characterized by advancements in technology and diverse applications. Various primary sources from both the supply and demand sides of the market were interviewed to obtain qualitative and quantitative information.
Following is the breakdown of primary respondents:
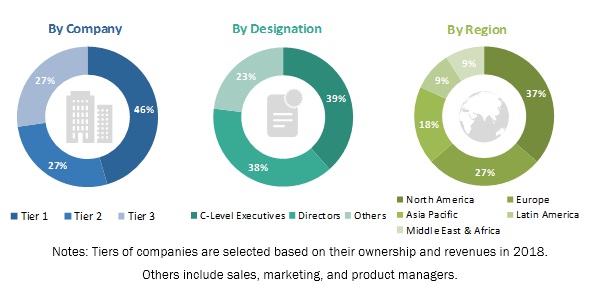
To know about the assumptions considered for the study, download the pdf brochure
Market Size Estimation
Both the top-down and bottom-up approaches were used to estimate and validate the total nanocomposites market size. These methods were also used extensively to estimate the size of various subsegments in the market. The research methodology used to estimate the market size included the following steps:
- The key players in the industry and markets were identified through extensive secondary research.
- The industry’s supply chain and market size, in terms of value, were determined through primary and secondary research processes.
- All percentage shares, splits, and breakdowns were determined by using secondary sources and verified through primary sources.
Data Triangulation
After arriving at the overall market size using the market size estimation process as explained above, the market was split into several segments and subsegments. In order to complete the overall market engineering process and arrive at the exact statistics of each market segment and subsegment, the data triangulation and market breakdown procedures were employed, wherever applicable. The data was triangulated by studying various factors and trends from both the demand and supply sides in packaging, automotive, electronics & semiconductor, costing, aerospace & defense, energy, and other applications.
Objectives of the Report
- To define, describe, and forecast the market size of nanocomposites, in terms of value and volume
- To provide detailed information about the key factors (drivers, restraints, opportunities, and challenges) influencing the growth of the market
- To provide detailed information about the technological advancements influencing the growth of the market
- To forecast the market on the basis of material type, resin type, and application
- To define, describe, and forecast the market on the basis of five regions, namely, North America, Europe, Asia Pacific (APAC), the Middle East & Africa, and Latin America
- To strategically analyze micro markets with respect to individual growth trends, growth prospects, and their contribution to the overall market
- To analyze the opportunities in the market for stakeholders and provide a competitive landscape for the market leaders
- To analyze recent developments, for instance, new product development, in the market
- To strategically profile the key players and comprehensively analyze their market shares and core competencies
Available Customizations
MarketsandMarkets offers customizations according to the specific needs of the companies with the given market data.
The following customization options are available for the report:
Product Analysis
- Product matrix, which gives a detailed comparison of the product portfolio of each company
Regional Analysis
- Further breakdown of the Rest of Europe nanocomposites market
- Further breakdown of the Rest of Asia Pacific nanocomposites market
- Further breakdown of the Rest of Latin America nanocomposites market
- Further breakdown of the Rest of Middle East & Africa nanocomposites market
Company Information
- Detailed analysis and profiling of additional market players (up to five)
Graphene Nanocomposites Market Overview
Graphene Nanocomposites Market Trends
Top Companies in Graphene Nanocomposites Market
Graphene Nanocomposites Market Impact on Different Industries
Speak to our Analyst today to know more about Graphene Nanocomposites Market!


Growth opportunities and latent adjacency in Nanocomposites Market