Phytonutrients Market by Type (Carotenoids, Phytosterols, Flavonoids, Phenolic Compounds, and Vitamin E), Application (Food & Beverage, Feed, Pharmaceutical, and Cosmetic), Source, & by Region - Global Trends and Forecast to 2020


Phytonutrients are certain specific, organic components found in plants, said to promote health benefits. Phytonutrients are gaining importance globally due to their potential health benefits and are facing growing demand from the fortified foods and dietary supplements industries. Vegetables, legumes, nuts, grains, fruits, and teas, are rich sources of phytonutrients
Phytonutrients are added to food for their disease-preventing properties. There are numerous commercial products, both raw materials and finished products, containing phytonutrients in different proportions. The phytonutrients market is projected to exhibit a growth potential (7.2%) in the next five years. As assessed, the growth of this market is to be propelled by the health benefits, increasing end-use applications, and government promotions regarding the consumption of phytonutrients.
The global phytonutrients market, in terms of value, is projected to reach $4.63 Billion in 2020, at a CAGR of 7.2% from 2015 to 2020. The market is projected to grow significantly in the next five years in almost all parts of the world, especially in European and North American countries. The high rate of adoption of phytonutrients by manufacturers drives the European market.
The phytonutrients market is highly fragmented with the key market players driving the growth with agreements, expansions, acquisitions, and new product launches to develop their position in the market. The market is competitive with leading players being involved in the research & development of new products and new application of phytonutrients.
The phytonutrients industry has many players, (small, medium, and large); however the industry is dominated by a few. Raisio Plc. (Finland), FMC Corporation (U.S.), DSM N.V. (The Netherlands), Chr. Hansen A/S (Denmark) and BASF SE (Germany) collectively account for around ~35% of the total phytonutrients market. Acquisitions were found to be the most preferred growth strategy in the phytonutrients market. The purpose of adopting this strategic expansion is that it results in increasing geographic presence, clientele, and product portfolio. Other players such as Pharmachem Laboratories, Inc. (U.S.), Archer Daniels Midland Co. (U.S.), Cargill Inc. (U.S.), Allied Biotech Corporation (U.S.), Arboris, LLC (U.S.), Dohler Group (Germany), Carotech Berhad (Malaysia), and D.D. Williamson & Co. (U.S.) also have a strong presence in the market.
Phytonutrients Market Share, by Region, 2014 ($Million)
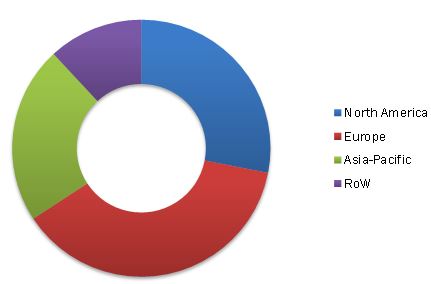
Source: Expert Interviews and MarketsandMarkets Analysis
This report estimates the market size of the global phytonutrients market in terms of value ($Million). In this report, the market is broadly segmented based on types, applications, sources, and regions. Market drivers, restraints, and challenges, raw material, and product price trends are discussed in detail. Market share, by participant, for the overall market is discussed in detail. The global phytonutrients market has grown exponentially in the last few years and this growth is expected to continue. Factors such as high efficiency, ease of application, and rise in health concerns are increasing the market for phytonutrients, globally.
Scope of the Report
Based on type, the market has been segmented as follows:
- Carotenoids
- Phytosterols
- Flavonoids
- Phenolic compounds
- Vitamin E
- Others (betalains, alkaloids, monoterpenes, anthocyanins, and lignans)
Based on application, the market has been segmented as follow:
- Food & Beverages
- Pharmaceuticals
- Cosmetics
- Feed
Based on source, the market has been segmented as follows:
- Fruits & Vegetables
- Cereals, Pulses & Oilseeds
- Herbs & Trees
- Others
Based on region, the market has been segmented as follows:
- North America
- Europe
- Asia-Pacific
- RoW
Phytonutrients are non-nutrient compounds in plants which are utilized as antioxidants, detoxify carcinogens, mimic hormones, enhance immune system, and suppress development of diseases, thus rendering a host of health benefits. They are formally classified as non-nutrients and unlike vitamins, phytonutrients are not considered important due to the fact that no known nutritional scarcities occur without intake. Although phytonutrients are not considered as essential, they alter hormonal balance (such as estrogen breakdown); convert beta-carotene into vitamin A; enhance immune system function; act as antioxidants; repair DNA damage caused by smoking or other toxic exposure; enhance cell-to-cell communication; and eradicate cancer cells.
Phytonutrients are naturally found in all items of plant origin, fruits, vegetables, grains, legumes, nuts, and teas. They are used widely as ingredients in the food, feed products, pharmaceuticals, and cosmetics industries.
The phytonutrients market is projected to grow significantly for the next five years in almost all parts of the world, especially in European and North American countries. Significant increase in health issues, changing lifestyles of consumers, cardiovascular diseases, and other health issues such as cancer, type 2 diabetes are the major driving factors of the phytonutrients market, globally. On the other hand, the aging population and increased awareness about health and wellness are also contributing to the market growth. Phytonutrients have been given the GRAS (Generally Recognized As Safe) status in the U.S., followed by the approval from the FDA and the EU Scientific Committee on Food (SFC).
Phytonutrients Market Size, by Type, 2015 vs. 2020 ($Million)
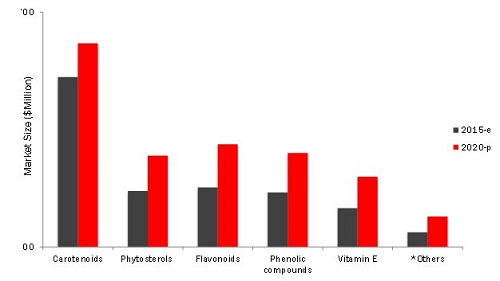
Note: *Others include betalains, alkaloids, monoterpenes, anthocyanins, and lignans
Source: Expert Interviews and MarketsandMarkets Analysis
Phytonutrients Market is projected to reach $4.63 Billion and CAGR of 7.2% between 2015 and 2020. The market was dominated by Europe, which accounted for around 37.65% of the total share, in 2014. Regulatory approvals from the EU, increasing incidences of cardiovascular diseases, increasing health issues, changing lifestyle of people, and increasing aging population are the major driving factors for the growth of phytonutrients market in Europe. In 2014, Germany was the largest phytonutrients market in Europe.
The global phytonutrients market is marked with intense competition due to the presence of a large number of both, big and small firms. New product launches, mergers & acquisitions, and partnerships and expansions are the key strategies adopted by market players to ensure their growth in the market. The market is dominated by players such as dominated FMC Corporation (U.S.), BASF SE (Germany), Pharmachem Laboratories Inc. (U.S.), DSM N.V. (The Netherlands), and Raisio Plc. (Finland).
 Exclusive indicates content/data unique to MarketsandMarkets and not available with any competitors.
Table of Contents
1 Introduction (Page No. - 17)
1.1 Objectives of the Study
1.2 Market Definition
1.3 Market Scope
1.3.1 Markets Covered
1.3.2 Years Considered for the Study
1.4 Currency Considered for the Study
1.5 Limitations
1.6 Stakeholders
2 Research Methodology (Page No. - 21)
2.1 Research Data
2.1.1 Secondary Data
2.1.1.1 Key Data From Secondary Sources
2.1.2 Primary Data
2.1.2.1 Key Data From Primary Sources
2.1.2.2 Key Industry Insights
2.1.2.3 Breakdown of Primary Interviews
2.2 Factor Analysis
2.2.1 Introduction
2.2.2 Demand-Side Analysis
2.2.2.1 Growing Population and Rising Diversified Food Demand
2.2.2.2 Growing Middle-Class Population
2.2.2.3 Health Benefits of Phytonutrients - Carotenoids
2.2.2.4 Increasing Demand for Milk & Meat Products
2.2.3 Supply-Side Analysis
2.2.3.1 Parent Market Analysis: Growth of Functional Food Market
2.3 Global Market Size Estimation
2.3.1 Bottom-Up Approach
2.3.2 Top-Down Approach
2.4 Market Breakdown & Data Triangulation
2.5 Research Assumptions & Limitations
2.5.1 Assumptions
2.5.2 Limitations
3 Executive Summary (Page No. - 36)
4 Premium Insights (Page No. - 40)
4.1 Attractive Opportunities in Phytonutrients Market
4.2 Pharmaceuticals: Leading Segment By Application
4.3 Leading Market for Phytonutrients
4.4 Europe: Largest Phytonutrients Market
4.5 U.S. Dominated Phytonutrients Market, 2014
4.6 Life Cycle Analysis: By Region
5 Market Overview (Page No. - 46)
5.1 Introduction
5.2 Evolution
5.3 Market Segmentation
5.3.1 Phytonutrients Market, By Type
5.3.2 Phytonutrients Market, By Application
5.3.3 Phytonutrients Market, By Source
5.4 Market Dynamics
5.4.1 Drivers
5.4.1.1 Various Health Benefits
5.4.1.2 Increasing End-Use Applications
5.4.2 Restraints
5.4.2.1 Possible Side Effects of Phytonutrients
5.4.2.2 Carotenoids (Beta-Carotene): Not Suitable for All
5.4.3 Opportunity
5.4.3.1 Promotion of Phytonutrients to Control Cancer
5.4.4 Challenges
5.4.4.1 Raising Awareness Levels Among Consumers and Intensifying Research Activities
5.4.4.2 Effective Marketing Strategies
6 Industry Trends (Page No. - 60)
6.1 Introduction
6.2 Value Chain Analysis
6.3 Supply Chain Analysis
6.3.1 Prominent Companies
6.3.2 Small & Medium Enterprises
6.3.3 End Users (Manufacturers/Consumers)
6.3.4 Key Influencers
6.4 Industry Insights
6.4.1 Carotenoids Segment Dominates Phytonutrients Market
6.4.2 Vitamin E is Fastest Growing Segment in Phytonutrients Market
6.5 Porter’s Five Forces Analysis
6.5.1 Intensity of Competitive Rivalry
6.5.2 Bargaining Power of Suppliers
6.5.3 Bargaining Power of Buyers
6.5.4 Threat of New Entrants
6.5.5 Threat of Substitutes
6.6 Strategic Benchmarking
6.6.1 Mergers & Acquisitions
7 Phytonutrients Market, By Type (Page No. - 70)
7.1 Introduction
7.2 Carotenoids
7.2.1 Beta-Carotenes
7.2.2 Lutein
7.2.3 Lycopene
7.2.4 Astaxanthin
7.2.5 Zeaxanthin
7.2.6 Canthaxanthin
7.2.7 Others (Carotenoids)
7.3 Phytosterols
7.3.1 Beta-Sitosterol
7.3.2 Campesterol
7.3.3 Stigmasterol
7.3.4 Others (Phytosterols)
7.4 Flavonoids
7.5 Phenolic Compounds
7.6 Vitamin E
7.7 Other Phytonutrients
8 Phytonutrients Market, By Application (Page No. - 82)
8.1 Introduction
8.2 Food & Beverages
8.3 Feed
8.4 Pharmaceuticals
8.5 Cosmetics
9 Phytonutrients Market, By Source (Page No. - 89)
9.1 Introduction
9.2 Fruits & Vegetables
9.3 Cereals, Pulses, and Oilseeds
9.4 Herbs & Trees
9.5 Other Sources
10 Phytonutrients Market, By Region (Page No. - 96)
10.1 Introduction
10.2 North America
10.2.1 U.S.
10.2.2 Canada
10.2.3 Mexico
10.3 Europe
10.3.1 France
10.3.2 Germany
10.3.3 Italy
10.3.4 The Netherlands
10.3.5 Spain
10.3.6 Rest of Europe
10.4 Asia-Pacific
10.4.1 China
10.4.2 India
10.4.3 Japan
10.4.4 Malaysia
10.4.5 Rest of Asia-Pacific
10.5 Rest of the World (RoW)
10.5.1 Brazil
10.5.2 Argentina
10.5.3 South Africa
10.5.4 Others in RoW
11 Competitive Landscape (Page No. - 135)
11.1 Overview
11.2 Phytonutrients Market: Market Share Analysis (Developments)
11.3 Competitive Situations & Trends
11.3.1 Mergers & Acquisitions
11.3.2 Expansions & Investments
11.3.3 Agreements, Partnerships, Joint Ventures & Collaborations
11.3.4 New Product Launches
12 Company Profiles (Page No. - 142)
(Overview, Products & Services, Strategies & Insights, Developments and Mnm View)*
12.1 Introduction
12.2 Archer Daniels Midland Company
12.3 BASF SE
12.4 Cargill Inc.
12.5 Chr. Hansen A/S
12.6 DSM N. V.
12.7 Cyanotech Corporation
12.8 FMC Corporation
12.9 Kemin Industries Inc.
12.10 Allied Biotech Corporation
12.11 Arboris Llc
12.12 Carotech Berhad
12.13 D.D. Williamson & Co.
12.14 Döhler Group
12.15 Pharmachem Laboratories Inc.
12.16 Raisio Plc.
*Details on Overview, Products & Services, Strategies & Insights, Developments and Mnm View Might Not Be Captured in Case of Unlisted Companies.
13 Appendix (Page No. - 193)
13.1 Insights of Industry Experts
13.2 Discussion Guide
13.3 Company Developments
13.3.1 Mergers & Aquisitions
13.3.2 Expansions & Investments
13.3.3 Agreements, Partnerships, Joint Ventures & Collaborations
13.3.4 New Product Launches
13.4 Introducing RT: Real Time Market Intelligence
13.5 Available Customizations
13.6 Related Reports
List of Tables (79 Tables)
Table 1 Assumptions of the Study
Table 2 Impact of Key Drivers on the Phytonutrients Market
Table 3 Impact of Key Restraints on the Phytonutrients Market
Table 4 Challenges to the Phytonutrients Market
Table 5 Phytonutrients Market Size, By Type, 2013-2020 ($Million)
Table 6 Carotenoids in Phytonutrients Market Size, By Region, 2013-2020 ($Million)
Table 7 Carotenoids in Phytonutrients Market Size, By Type, 2013-2020 ($Million)
Table 8 Phytosterolsin Phytonutrients Market Size, By Region, 2013-2020 ($Million)
Table 9 Phytosterols in Phytonutrients Market Size, By Type, 2013-2020 ($Million)
Table 10 Flavonoids in Phytonutrients Market Size, By Region, 2013-2020 ($Million)
Table 11 Phenolic Compounds in Phytonutrients Market Size, By Region, 2013-2020 ($Million)
Table 12 Vitamin E in Phytonutrients Market Size, By Region, 2013-2020 ($Million)
Table 13 Other Phytonutrients Market Size, By Region, 2013-2020 ($Million)
Table 14 Phytonutrients Market Size, By Application, 2013-2020 ($Million)
Table 15 Phytonutrients Market Size for Food & Beverages, By Region, 2013-2020 ($Million)
Table 16 Phytonutrients Market Size for Feed, By Region, 2013-2020 ($Million)
Table 17 Phytonutrients Market Size for Pharmaceuticals, By Region, 2015-2020 ($Million)
Table 18 Phytonutrients Market Size for Cosmetics, By Region, 2015-2020 ($Million)
Table 19 Phytonutrients Market Size, By Source, 2013-2020 ($Million)
Table 20 Fruits & Vegetables in Phytonutrients Market Size, By Region, 2013-2020 ($Million)
Table 21 Cereals, Pulses, and Oilseeds in Phytonutrients Market Size, By Region, 2015-2020 ($Million)
Table 22 Herbs & Trees in Phytonutrients Market Size, By Source, 2015-2020 ($Million)
Table 23 Other Sources in Phytonutruents Market Size, By Region, 2013-2020 ($Million)
Table 24 Phytonutrients Market Size, By Region, 2013-2020 ($Million)
Table 25 North America: Phytonutrients Market Size, By Country, 2013-2020 ($Million)
Table 26 North America: Phytonutrients Market Size, By Type, 2013-2020 ($Million)
Table 27 North America: Phytonutrients Market Size, By Application, 2013-2020 ($Million)
Table 28 U.S.: Phytonutrients Market Size, By Type, 2013-2020 ($Million)
Table 29 U.S.: Phytonutrients Market Size, By Application, 2013-2020 ($Million)
Table 30 Canada: Phytonutrients Market Size, By Type, 2013-2020 ($Million)
Table 31 Canada: Phytonutrients Market Size, By Application, 2013-2020 ($Million)
Table 32 Mexico: Phytonutrients Market Size, By Type, 2013-2020 ($Million)
Table 33 Mexico: Phytonutrients Market Size, By Application, 2013-2020 ($Million)
Table 34 Europe: Phytonutrients Market Size, By Country, 2013–2020 ($Million)
Table 35 Europe: Phytonutrients Market Size, By Type, 2013-2020 ($Million)
Table 36 Europe: Phytonutrients Market Size, By Application, 2013-2020 ($Million)
Table 37 France: Phytonutrients Market Size, By Type, 2013-2020 ($Million)
Table 38 France: Phytonutrients Market Size, By Application, 2013-2020 ($Million)
Table 39 Germany: Phytonutrients Market Size, By Type, 2013-2020 ($Million)
Table 40 Germany: Phytonutrients Market Size, By Application, 2013-2020 ($Million)
Table 41 Italy: Phytonutrients Market Size, By Type, 2013-2020 ($Million)
Table 42 Italy: Phytonutrients Market Size, By Application, 2013-2020 ($Million)
Table 43 The Netherlands: Phytonutrients Market Size, By Type, 2013-2020 ($Million)
Table 44 The Netherlands: Phytonutrients Market Size, By Application, 2013-2020 ($Million)
Table 45 Spain: Phytonutrients Market Size, By Type, 2013-2020 ($Million)
Table 46 Spain: Phytonutrients Market Size, By Application, 2013-2020 ($Million)
Table 47 Rest of Europe: Phytonutrients Market Size, By Type, 2013-2020 ($Million)
Table 48 Rest of Europe: Phytonutrients Market Size, By Application, 2013-2020 ($Million)
Table 49 Asia-Pacific: Phytonutrients Market Size, By Country, 2013–2020 ($Million)
Table 50 Asia-Pacific: Phytonutrients Market Size, By Type, 2013-2020 ($Million)
Table 51 Asia-Pacific: Phytonutrients Market Size, By Application, 2013-2020 ($Million)
Table 52 China: Phytonutrients Market Size, By Type, 2013-2020 ($Million)
Table 53 China: Phytonutrients Market Size, By Application, 2013-2020 ($Million)
Table 54 India: Phytonutrients Market Size, By Type, 2013-2020 ($Million)
Table 55 India: Phytonutrients Market Size, By Application, 2013-2020 ($Million)
Table 56 Japan: Phytonutrients Market Size, By Type, 2013-2020 ($Million)
Table 57 Japan: Phytonutrients Market Size, By Application, 2013-2020 ($Million)
Table 58 Malaysia: Phytonutrients Market Size, By Type, 2013-2020 ($Million)
Table 59 Malaysia: Phytonutrients Market Size, By Application, 2013-2020 ($Million)
Table 60 Rest of Asia-Pacific: Phytonutrients Market Size, By Type, 2013-2020 ($Million)
Table 61 Rest of Asia-Pacific: Phytonutrients Market Size, By Application, 2013-2020 ($Million)
Table 62 RoW: Phytonutrients Market Size, By Country, 2013-2020 ($Million)
Table 63 RoW: Phytonutrients Market Size, By Type, 2013-2020 ($Million)
Table 64 RoW: Phytonutrients Market Size, By Application, 2013-2020 ($Million)
Table 65 Brazil: Phytonutrients Market Size, By Type, 2013-2020 ($Million)
Table 66 Brazil: Phytonutrients Market Size, By Application, 2013-2020 ($Million)
Table 67 Argentina: Phytonutrients Market Size, By Type, 2013-2020 ($Million)
Table 68 Argentina: Phytonutrients Market Size, By Application, 2013-2020 ($Million)
Table 69 South Africa: Phytonutrients Market Size, By Type, 2013-2020 ($Million)
Table 70 South Africa: Phytonutrients Market Size, By Application, 2013-2020 ($Million)
Table 71 Others in RoW: Phytonutrients Market Size, By Type, 2013-2020 ($Million)
Table 72 Others in RoW: Phytonutrients Market Size, By Application, 2013-2020 ($Million)
Table 73 Mergers & Acquisitions, 2010–2015
Table 74 Expansions & Investments, 2010–2015
Table 75 Agreements, Partnerships, Joint Ventures & Collaborations, 2010–2015
Table 76 New Product Launches, 2010–2015
Table 77 BASF SE:Animal Nutrition Products & Their Description
Table 78 BASF SE: Human Nutrition Products & Their Description
Table 79 Allied Biotech Corporation: Divisions & Products
List of Figures (66 Figures)
Figure 1 Phytonutrients Market Segmentation
Figure 2 Research Design
Figure 3 Population Growth Trend, 1961-2050
Figure 4 Growing Middle-Class Population in Asia-Pacific
Figure 5 Health Concerns Due to Obesity
Figure 6 Per Capita Consumption of Livestock Products
Figure 7 Functional Foods in the U.S.
Figure 8 Market Size Estimation Methodology: Bottom-Up Approach
Figure 9 Market Size Estimation Methodology: Top-Down Approach
Figure 10 Data Triangulation
Figure 11 Phytonutrients Market Snapshot (2014)
Figure 12 Pharmaceutical Segment in Phytonutrients Market Projected to Be Largest By 2020
Figure 13 Phytonutrients Market Trend, By Region, 2014-2020
Figure 14 Europe & North American Was Largest Market in 2014
Figure 15 Attractive Opportunities in Phytonutrients Market
Figure 16 Pharmaceuticals Projected to Be the Largest Segment
Figure 17 U.S.: Largest Market in Next Five Years
Figure 18 Carotenoids Segment Accounted for Largest Share in European Phytonutrients Market, 2014
Figure 19 U.S. Dominates Global Phytonutrients Market
Figure 20 Asia-Pacific Region to Provide Immense Potential Opportunities for Phytonutrients Market Growth
Figure 21 Evolution of the Phytonutrients Market
Figure 22 Phytonutrients Market, By Type
Figure 23 Phytonutrients Market, By Application
Figure 24 Phytonutrients Market, By Source
Figure 25 Key Drivers: Various Health Benefits & Increasing End-Use Applications
Figure 26 Functional Food Market Size, 2012 vs 1997 ($Billion)
Figure 27 Annual Average Population Growth Rate, 1980-2010
Figure 28 Countries With Highest Cancer Rates, 2012
Figure 29 Processing Segment Contributes Major Value to Overall Price of Phytonutrients
Figure 30 Research Organizations & Technologists: Integral Part of Supply Chain of Phytonutrients Market
Figure 31 Carotenoids Segment Dominated Phytonutrients Market, 2014
Figure 32 Europe is the Largest Market for Vitamin E
Figure 33 Porter’s Five Forces Analysis: Phytonutrients Market
Figure 34 Strategic Benchmarking: Mergers & Acquisitions
Figure 35 Vitamin E: Fastest Growing Phytonutrients Type (2015-2020)
Figure 36 Phytonutrients Market: Food & Beverages Projected to Be Fastest-Growing Application Between 2015 & 2020
Figure 37 Global Compound Feed Production in 2013, By Volume
Figure 38 Fruits & Vegetables to Be the Fastest Growing Source Segment of Phytonutrients (2015-2020)
Figure 39 Europe to Be the Largest Market for Phytonutrients (2015-2020))
Figure 40 Geographic Snapshot (2015-2020): New Hotspots for Phytonutrients
Figure 41 North American Phytonutrients Market: A Snapshot
Figure 42 European Phytonutrients Market: A Snapshot
Figure 43 Germany: Largest Share in European Phytonutrients Market
Figure 44 China: Market Leader in Asia-Pacific Region in 2014
Figure 45 Mergers & Acquisitions: Leading Approach of Key Players
Figure 46 Phytonutrients Market Share (Developments), By Company, 2010–2015
Figure 47 Mergers & Acquisitions Fueled Growth & Innovation of Phytonutrients Between 2010 to 2015
Figure 48 Mergers & Acquisitions: The Key Strategy, 2010-2015
Figure 49 Geographical Revenue Mix of Top 5 Market Players
Figure 50 Archer Daniels Midland Company: Company Snapshot
Figure 51 Archer Daniels Midland Company: SWOT Analysis
Figure 52 BASF SE: Company Snapshot
Figure 53 BASF SE: SWOT Analysis
Figure 54 Cargill Inc.: Company Snapshot
Figure 55 Cargill Inc.: SWOT Analysis
Figure 56 Chr. Hansen Holdings A/S: Company Snapshot
Figure 57 Chr. Hansen A/S: SWOT Analysis
Figure 58 DSM N. V.: Company Snapshot
Figure 59 DSM N. V.: SWOT Analysis
Figure 60 Cynotech Corporation: Company Snapshot
Figure 61 Cyanotech Corporation: SWOT Analysis
Figure 62 FMC Corporation: Company Snapshot
Figure 63 FMC Corporation: SWOT Analysis
Figure 64 Kemin Industries Inc.: SWOT Analysis
Figure 65 Carotech Berhad: Company Snapshot
Figure 66 Raisio PLC.: Company Snapshot


Growth opportunities and latent adjacency in Phytonutrients Market