Polystyrene Market by Application (Packaging, Electronics, Consumer Goods & Appliances, Construction, and Others) & Geography - Global Trends & Forecast to 2019


Polystyrene is a hard and solid plastic, which is produced through the polymerization of styrene. It is a vinyl polymer, with a long hydrocarbon chain structure, wherein a phenyl group is attached to every other carbon atom. Polystyrene is a versatile plastic that is mainly utilized in refrigerators, air conditioners, instrument panels, televisions, computers, and disposable utensils (such as foamed cups, plates, and bowls). It is also used to develop consumer products, such as CD and DVD cases and food packaging materials. It is an inexpensive and strong plastic that can be used to insulate buildings, create sterile disposable cutlery, and can also be recycled into domestic building products. The global polystyrene market is projected to reach USD 28.2 Billion by 2019, at a CAGR of 5.1% between 2014 and 2019. The growth is mainly attributed to the increasing rates of industrialization and globalization across the globe. This is also expected to give impetus to the global demand for market in packaging and electronics applications. China is anticipated to be the largest market for polystyrene, followed by other emerging economies in the Asia-Pacific region. Asia-Pacific is the most dominant region in the market owing to increasing plastic consumption and rapid urbanization in this region.
Packaging and electronics are estimated to be the two largest application segments of the market in 2014. These segments are projected to grow at the highest CAGR in global market between 2014 and 2019. High penetration of polystyrene in the electronics and appliances industry is anticipated to fuel the growth of the global polystyrene market.
This report estimates the market for 2014, and projects its expected market size till 2019. It also provides a detailed qualitative and quantitative analysis of the market. Various secondary sources, such as encyclopedia, directories, and databases are used to identify and collect information useful for this extensive commercial study. The primary sources comprise interviews of suppliers and experts from related industries, to obtain and verify critical information as well as to assess the future prospects of the market.
Competitive scenario of top players in the market has been discussed in detail, along with their recent developments and other growth strategies. Leading players profiled in this report include BASF SE (Germany), Styrosolution Group (Germany), Videolar S/A. (Sao Paulo), SABIC (Saudi Arabia), and Formosa Plastic Corporation (Taiwan) among others.
Scope of the Report
This research report categorizes the global polystyrene market on the basis of application and region.
On the basis of application: By application, the market is segmented into packaging, electronics, consumer goods & appliances, and construction among others. Each application is further described in detail in the report with volume and value forecasts.
On the basis of region: Regional level segmentation is carried out for the polystyrene market; it includes Asia-Pacific, Europe, North America, and South America & MEA, and other countries in each region that include:
- Asia-Pacific
- China
- Japan
- Korea
- Taiwan
- Australia
- Europe
- Germany
- Italy
- France
- U.K.
- Netherlands
- North America
- U.S.
- Canada
- Mexico
- South America & MEA
- Brazil
- Saudi Arabia
- Argentina
- Others
The polystyrene market is expected to reach USD 28.2 Billion by 2019, at a CAGR of 5.1% from 2014 to 2019. Polystyrene is a hard and inexpensive polymer found in objects of day-to-day use. It is mainly utilized in the production of model cars, airplanes, and foams among others. Polystyrene is marginally biodegradable, and is often found in abundance as a form of litter in the outdoor environment, particularly along shores and waterways.
The report covers the polystyrene market, and is segmented into varied applications, such as packaging, electronics, consumer goods & appliances, and construction among others. The packaging application is the most dominant application of polystyrene, followed by electronics and consumer goods & appliances. The packaging application accounted for a share of 37.6% in 2014. Similarly, the electronics application of the market is projected to grow at the highest CAGR of 5.9% between 2014 and 2019.
On the basis of region, the market is classified into Asia-Pacific, Europe, North America, and South America & MEA. The market has further been analyzed with respect to sixteen major countries, which include China, Japan, Korea, Taiwan, Australia, Germany, Italy, France, the U.K., the Netherlands, U.S., Canada, Mexico, Brazil, Saudi Arabia, and Argentina. These countries have been selected based on the existing market of polystyrene and their growth potential. Some of the most prominent companies in the market include Styrolution Group GMBH (Germany), Total Petrochemicals (Houston), BASF SE (Germany), Formosa Chemicals & Fiber Corporation (Taiwan), Kumho Petrochemicals Ltd. (South Korea), Chi Mei Corporation (Taiwan), SABIC (Saudi Arabia), Trinseo (U.S.), Videolar S/A (Brazil), and The Dow Chemical Company (U.S.).
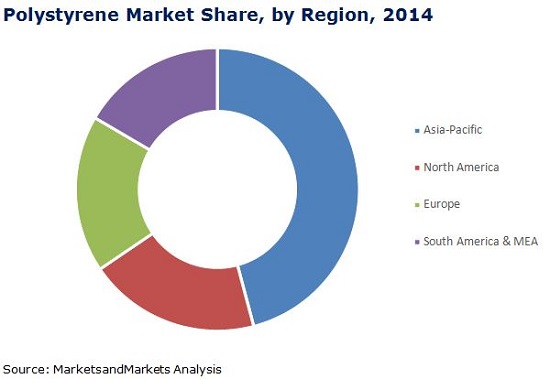
Asia-Pacific is projected to continue to lead the polystyrene market till 2019, followed by North America and Europe. Asia-Pacific and South America & MEA are the fastest-growing regions in the market. Asia-Pacific has its major demand and supply of polystyrene concentrated in the north-eastern region, with China being the largest producer and consumer of polystyrene, followed by Japan, Korea, and Australia.
 Exclusive indicates content/data unique to MarketsandMarkets and not available with any competitors.
Table of Contents
1 Introduction (Page No. - 10)
1.1 Objectives of the Study
1.2 Market Segmentation & Coverage
1.3 Stakeholders
2 Research Methodology (Page No. - 12)
2.1 Integrated Ecosystem of the Polystyrene Market
2.2 Arriving at Market Size of Polystyrene Market
2.2.1 Top-Down Approach
2.2.2 Bottom-Up Approach
2.2.3 Demand Side Approach
3 Executive Summary (Page No. - 16)
4 Market Overview (Page No. - 18)
4.1 Introduction
4.2 Market Drivers and Inhibitors
4.3 Key Market Dynamics
5 Polystyrene Market, By Application (Page No. - 22)
5.1 Introduction
5.2 Packaging
5.3 Electronics
5.4 Consumer Goods & Appliances
5.5 Construction
6 Polystyrene Market, By Geography (Page No. - 32)
6.1 Introduction
6.2 Asia-Pacific
6.3 Europe
6.4 North America
6.5 South America & MEA
7 Competitive Landscape (Page No. - 47)
7.1 Market: Company Share Analysis
7.2 Mergers & Acquisitions
7.3 New Technology Launch
7.4 Investment
7.5 Consolidation
7.6 Joint Venture
7.7 Expansion
8 Company Profiles (Page No. - 51)
(Company at A Glance, Recent Financials, Products & Services, Strategies & Insights, & Recent Developments)*
8.1 Styrolution Group GmbH
8.2 Total Petrochemicals
8.3 BASF SE
8.4 Formosa Chemicals & Fibre Corporation
8.5 Kumho Petrochemicals Ltd.
8.6 CHI MEI Corporation
8.7 SABic
8.8 Trinseo
8.9 Videolar S/A.
8.10 ACH Foam Technologies Llc
8.11 Alpek SAB DE CV
8.12 The DOW Chemical Company
*Details on Company at A Glance, Recent Financials, Products & Services, Strategies & Insights, & Recent Developments Might Not Be Captured in Case of Unlisted Companies.
9 Appendix (Page No. - 77)
9.1 Customization Options
9.1.1 Technical Analysis
9.1.2 Low-Cost Sourcing Locations
9.1.3 Regulatory Framework
9.1.4 Polystyrene Usage Data
9.1.5 Impact Analysis
9.1.6 Trade Analysis
9.1.7 Historical Data and Trends
9.2 Introducing RT: Real Time Market Intelligence
9.2.1 Rt Snapshots
9.3 Related Reports
List of Tables (63 Tables)
Table 1 Polystyrene Peer Market Share Value 2013 (%)
Table 2 Polystyrene Application Market, 2014 (KT)
Table 3 Assumptions
Table 4 Polystyrene Market: Comparison With Parent Market, 2013 � 2019 (USD MN)
Table 5 Polystyrene Market: Comparison With Parent Market, 2013 � 2019 (KT)
Table 6 Market: Drivers and Inhibitors
Table 7 Market, By Application, 2013-2019 (USD MN)
Table 8 Market, By Application, 2013-2019 (KT)
Table 9 Market, By Geography, 2013-2019 (USD MN)
Table 10 Polystyrene Market, By Geography, 2013-2019 (KT)
Table 11 Market, By Application, 2013-2019 (USD MN)
Table 12 Market, By Application, 2013-2019 (KT)
Table 13 Polystyrene in Packaging, By Geography, 2013-2019 (USD MN)
Table 14 Polystyrene in Packaging, By Geography, 2013-2019 (KT)
Table 15 Polystyrene in Electronics, By Geography, 2013-2019 (USD MN)
Table 16 Polystyrene in Electronics, By Geography, 2013-2019 (KT)
Table 17 Polystyrene in Consumer Goods & Appliances, By Geography, 2013-2019 (USD MN)
Table 18 Polystyrene in Consumer Goods & Appliances, By Geography, 2013-2019 (KT)
Table 19 Polystyrene in Construction, By Geography, 2013-2019 (USD MN)
Table 20 Polystyrene in Construction, By Geography, 2013-2019 (KT)
Table 21 Polystyrene Market, By Geography, 2013-2019 (USD MN)
Table 22 Market: Growth Analysis, By Geography 2014 & 2019 (KT)
Table 23 Market, By Geography, 2013-2019 (KT)
Table 24 Asia-Pacific Polystyrene Market, By Application, 2013-2019 (USD MN)
Table 25 Asia-Pacific Market, By Application, 2013-2019 (KT)
Table 26 Europe Polystyrene Market, By Application, 2013-2019 (USD MN)
Table 27 Europe Polystyrene Market, By Application, 2013-2019 (KT)
Table 28 North America Polystyrene Market, By Application, 2013-2019 (USD MN)
Table 29 North America Market, By Application, 2013-2019 (KT)
Table 30 South America & MEA Polystyrene Market, By Application, 2013-2019 (USD MN)
Table 31 South America & MEA Market, By Application, 2013-2019 (KT)
Table 32 Polystyrene Market: Company Share Analysis, 2014 (%)
Table 33 Polystyrene Market: Mergers & Acquisitions
Table 34 Market: New Technology Launch
Table 35 Market: Investment
Table 36 Market: Consolidation
Table 37 Market: Joint Venture
Table 38 Polystyrene Market: Expansion
Table 39 Styrolution Group GmbH : Products & Services Offerings
Table 40 Styrolution Group GmbH : Related Developments
Table 41 Total Petro Chemicals : Products & Services Offerings
Table 42 Total Petro Chemicals: Related Developments
Table 43 BASF SE : Key Financials, 2009-2013 (USD MN)
Table 44 BASF SE : Products & Services Offerings
Table 45 BASF SE : Related Developments
Table 46 Formosa Chemicals & Fibre Corporation: Products & Services Offerings
Table 47 Formosa Chemicals & Fibre Corporation: Related Developments
Table 48 Kumho Petrochemicals Ltd.: Key Financials, 2011-2013 (USD MN)
Table 49 Kumho Petrochemicals Ltd. : Products & Services Offerings
Table 50 Kumho Petrochemicals Ltd.: Related Developments
Table 51 CHI MEI Corporation: Products & Services Offerings
Table 52 SABic: Products & Services Offerings
Table 53 SABic: Related Developments
Table 54 Trinseo: Products & Services Offerings
Table 55 Videolar S/A: Products & Services Offerings
Table 56 Videolar S/A: Related Developments
Table 57 ACH Foam Technologies: Products & Services Offerings
Table 58 ACH Foam Technologies: Related Developments
Table 59 Alpek SAB DE CV: Products & Services Offerings
Table 60 Alpek SAB DE CV: Related Developments
Table 61 DOW Chemical CO.: Key Financials, 2011-2013 (USD MN)
Table 62 DOW Chemical CO.: Products & Services Offerings
Table 63 DOW Chemical CO.: Related Developments
List of Figures (46 Figures)
Figure 1 Polystyrene Market: Segmentation & Coverage
Figure 2 Polystyrene Market: Integrated Ecosystem
Figure 3 Top-Down Approach
Figure 4 Bottom-Up Approach
Figure 5 Demand Side Approach
Figure 6 Polystyrene Market: Snapshot, 2014
Figure 7 Market: Growth Aspects
Figure 8 Market: Comparison With Parent Market
Figure 9 Polystyrene, By Application, 2014 & 2019
Figure 10 Polystyrene Market, By Application, 2014 & 2019 (USD MN)
Figure 11 Polystyrene Market, By Application, 2014 & 2019 (KT)
Figure 12 Polystyrene Market in Packaging, By Geography, 2014 & 2019 (USD MN)
Figure 13 Polystyrene in Electronics, By Geography, 2014 & 2019 (USD MN)
Figure 14 Polystyrene in Consumer Goods & Appliances, By Geography, 2014 & 2019 (USD MN)
Figure 15 Polystyrene in Construction, By Geography, 2014 & 2019 (USD MN)
Figure 16 Polystyrene Market: Growth Analysis, By Geography, 2014 & 2019 (USD MN)
Figure 17 Asia-Pacific Market Overview, 2014 & 2019 (%)
Figure 18 Asia-Pacific Polystyrene Market, By Application, 2014 & 2019 (USD MN)
Figure 19 Asia-Pacific Market: Application Snapshot
Figure 20 Europe Polystyrene Market Overview, By Geography, 2014 & 2019 (%)
Figure 21 Europe Market Overview, By Application 2014 & 2019 (USD MN)
Figure 22 Europe Market: Application Snapshot
Figure 23 North America Polystyrene Market Overview, 2014 & 2019 (%)
Figure 24 North America Market, Market Overview, 2014 & 2019 (USD MN)
Figure 25 North America Polystyrene Market: Application Snapshot
Figure 26 South America & MEA Polystyrene Market Overview, 2014 & 2019 (%)
Figure 27 South America & MEA Market, Market Overview, 2014 & 2019 (USD MN)
Figure 28 South America Market: Application Snapshot
Figure 29 Polystyrene Market: Company Share Analysis, 2014 (%)
Figure 30 Styrolution Group GmbH Revenue Mix, 2013 (%)
Figure 31 Total Petro Chemicals Revenue Mix, 2013 (%)
Figure 32 BASF SE: Revenue Mix, 2014 (%)
Figure 33 BASF SE :Company Revenues, 2009-2013 (USD MN)
Figure 34 Formosa Chemicals & Fibre Corporation: Revenue Mix, 2013 (%)
Figure 35 Formosa Chemicals & Fibre Corporation: Company Revenues, 2010-2014 (USD MN)
Figure 36 Kumho Petrochemicals Ltd.: Revenue Mix, 2013 (%)
Figure 37 Kumho Petrochemicals Ltd.: Company Revenues, 2009-2013 (USD MN)
Figure 38 SABic: Revenue Mix, 2014 (%)
Figure 39 SABic: Company Revenues, 2009-2013 (USD MN)
Figure 40 Trinseo: Revenue Mix 2014 (%)
Figure 41 Trinseo: Company Revenues, 2009-2013 (USD MN)
Figure 42 Videolar S/A: Company Revenues, 2009-2013 (USD MN)
Figure 43 Alpek SAB DE CV: Revenue Mix, 2014 (%)
Figure 44 Alpek SAB DE CV: Company Revenues, 2010-2014 (USD MN)
Figure 45 DOW Chemical Co.: Revenue Mix, 2014 (%)
Figure 46 Contribution of Polystyrene Towards Company Revenues, 2010-2014 (USD MN)


Growth opportunities and latent adjacency in Polystyrene Market