Market for Proximity Marketing by Location (Indoor, and Outdoor), Technology (Wi-Fi, BLE Beacons, NFC, GPS Geofencing), Hardware (Sensors, RFID Tags), Software (Location Analytics), Service, Application - Global Growth Driver and Industry Forecast to 2035


Proximity Marketing Market Summary
The global Proximity Marketing Market is entering a stronger growth phase as retailers, hospitality operators, transportation providers, entertainment venues, and other customer-facing businesses increasingly combine location intelligence with mobile engagement. Based on current adoption patterns across Bluetooth Low Energy (BLE) beacons, location-based services, mobile applications, indoor positioning, and connected IoT infrastructure, the global Proximity Marketing Market is estimated at approximately USD 8-10 billion in 2025 and is projected to reach around USD 35-40 billion by 2035, representing an estimated 14-16% CAGR during the forecast period. The market is being supported by the rapid penetration of smartphones and connected devices, increasing investment in omnichannel retail, and demand for personalized customer experiences. BLE remains particularly important because it offers low-power proximity detection and is already integrated across a broad ecosystem of smartphones, wearables, gateways, and IoT devices.
The next stage of market development is being shaped by AI, IoT, automation, cloud computing, and digital transformation. Instead of simply triggering coupons when customers enter a defined area, modern proximity marketing platforms can combine location signals with purchase history, customer profiles, inventory information, footfall data, and contextual information to determine the most relevant engagement. This transition is moving the market from basic beacon-based messaging toward broader real-time location intelligence and automated customer engagement. At the same time, privacy, consent management, mobile operating-system permissions, and cybersecurity are becoming increasingly important competitive considerations.
Key Market Trends & Insights
The North American market is expected to remain a leading regional contributor because of high smartphone penetration, sophisticated retail infrastructure, mature digital advertising ecosystems, and strong adoption of location-based customer engagement. Retailers and hospitality businesses in the region increasingly view proximity marketing as part of a broader customer-data and omnichannel strategy rather than an isolated promotional technology.
Asia Pacific is projected to be the fastest-growing regional market through 2035. Rapid urbanization, expansion of organized retail, smart-city development, increasing mobile commerce adoption, and growing deployment of IoT infrastructure are creating favorable conditions for location-aware marketing. China, Japan, and other digitally advanced Asian economies are also developing sophisticated indoor positioning and connected customer-experience applications.
Retail is expected to remain the dominant application segment, supported by the need to connect physical stores with digital channels. Beacon-triggered offers, indoor navigation, loyalty engagement, product discovery, customer journey analytics, and personalized promotions are creating measurable opportunities for retailers seeking to improve conversion and customer retention.
BLE-based proximity solutions remain the dominant technology foundation, while UWB, Wi-Fi positioning, NFC, QR codes, RFID, and hybrid positioning technologies are expanding the addressable market. Recent market research indicates that beacons are increasingly being deployed beyond marketing for asset tracking, indoor navigation, staff safety, and operational visibility.
AI is becoming a major differentiator. Machine-learning models can identify customer behavior patterns, optimize message timing, predict purchase intent, and automate campaign decisions. The combination of AI with IoT-generated location data is expected to make proximity marketing more contextual and less dependent on manually configured campaigns.
Market Size & Forecast
- Base year market size: Approximately USD 8-10 billion in 2025, including proximity marketing platforms, beacon-enabled engagement, location-based services, and associated software and services.
- Forecast value by 2035: Approximately USD 35-40 billion, supported by expanding mobile engagement, connected retail, indoor positioning, and IoT deployment.
- CAGR: Approximately 14-16% during the forecast period.
- Growth factors: Increasing smartphone connectivity, omnichannel commerce, BLE infrastructure, AI-driven personalization, automated marketing, smart venues, and demand for measurable physical-store engagement are expected to support sustained expansion.
The broader beacon technology ecosystem provides an important indication of the market's technology trajectory. Recent industry estimates place the beacon technology market at several billion dollars and forecast strong double-digit growth through the early 2030s, reflecting expansion into retail, healthcare, transportation, hospitality, manufacturing, and smart buildings.
Proximity Marketing Market Top 10 key takeaway
- The global Proximity Marketing Market is expected to expand at an estimated 14-16% CAGR through 2035.
- Market revenue is projected to rise from approximately USD 8-10 billion in 2025 to USD 35-40 billion by 2035.
- North America is expected to remain a leading regional market due to advanced digital commerce and high enterprise technology adoption.
- Asia Pacific is projected to record the fastest growth as mobile commerce, organized retail, and IoT infrastructure expand.
- Retail is expected to remain the leading application for proximity marketing solutions.
- Bluetooth Low Energy is likely to retain its central position because of low power consumption, affordability, and compatibility with connected devices.
- AI is shifting proximity marketing from rule-based notifications toward predictive, personalized, and automated engagement.
- Cloud platforms are improving campaign management, analytics, scalability, and integration with customer relationship management systems.
- Privacy, consent, cybersecurity, and mobile permission requirements will remain important adoption considerations.
- The market opportunity is expanding from promotional messaging toward indoor navigation, customer analytics, loyalty, smart-venue experiences, and broader location intelligence.
Product Insights
The hardware and beacon-enabled solution segment is expected to maintain a significant position in the Proximity Marketing Market because physical proximity detection remains the foundation for location-triggered engagement. BLE beacons are particularly attractive because they are compact, comparatively inexpensive, energy efficient, and capable of broadcasting identifiers to nearby smartphones, gateways, wearables, and other connected devices. Their low-power architecture has supported adoption across retail stores, airports, hotels, hospitals, shopping centers, and other environments where organizations need to identify a device's presence within a defined area.
However, the market is gradually shifting from standalone beacon hardware toward integrated platforms. Modern solutions increasingly combine beacons with mobile applications, cloud dashboards, customer-data platforms, analytics engines, CRM systems, and marketing automation software. This enables organizations to move from a simple "customer entered this zone" trigger to more sophisticated workflows, such as identifying a returning customer, assessing their preferences, checking product availability, and delivering a relevant offer automatically.
Emerging product categories include smart beacons with improved battery management, OTA configuration, gateway connectivity, environmental sensing, and stronger security capabilities. Hybrid location platforms combining BLE with UWB, Wi-Fi, RFID, GPS, and computer vision are also becoming more attractive where organizations require higher positioning accuracy or broader coverage.
AI-enabled proximity platforms represent another important product evolution. These platforms can use historical engagement data to determine which message, promotion, product recommendation, or service is most likely to generate a response. Consequently, product differentiation is increasingly moving from transmitter hardware toward software intelligence, interoperability, analytics, and automated decision-making.
Technology / Component Insights (Rename based on keyword if needed)
BLE remains the core enabling technology for many proximity marketing deployments because it provides an efficient method for communicating with nearby mobile and IoT devices. Bluetooth-enabled smartphones and wearables create a large installed ecosystem, reducing the need for specialized customer hardware. Industry research also identifies BLE as an important component of indoor positioning and location-based services.
Cloud computing is becoming equally important. Cloud-based proximity marketing platforms allow businesses to centrally manage large numbers of beacons, campaigns, customer interactions, and analytics across multiple locations. This is particularly valuable for national retailers and hospitality chains that need consistent campaign logic across hundreds or thousands of physical sites.
AI and machine learning will increasingly operate above the connectivity layer. Algorithms can segment customers, estimate intent, identify behavioral patterns, predict optimal engagement times, and automatically adjust campaign parameters. Automation reduces the dependence on manually configured rules and allows marketers to respond to changing customer behavior in near real time.
Future technology development is likely to emphasize interoperability, privacy-preserving analytics, edge computing, and multi-sensor positioning. UWB can provide more precise spatial information, while Wi-Fi and RFID can complement BLE in larger or more complex environments. Research on indoor microlocation highlights the importance of accuracy, energy efficiency, range, and integration in IoT-equipped buildings.
Application Insights
Retail is expected to remain the leading application segment in the Proximity Marketing Market. Physical retailers increasingly need digital tools that can reproduce some of the personalization advantages of e-commerce while preserving the advantages of in-store experiences. Proximity marketing can support location-triggered promotions, loyalty rewards, product information, aisle navigation, queue management, customer journey analytics, and personalized recommendations.
Hospitality represents another attractive application. Hotels, resorts, restaurants, airports, and entertainment venues can use proximity technologies to deliver contextual information throughout a visitor's journey. A guest could receive a check-in notification near an entrance, a restaurant promotion near a dining area, or navigation assistance within a large property. This makes proximity marketing relevant not only for advertising but also for service automation.
Transportation and tourism are expected to generate additional opportunities through indoor navigation, wayfinding, passenger communication, and location-aware information. Healthcare organizations can also use proximity technologies for patient navigation, staff workflows, and asset visibility, although privacy and security requirements are particularly important.
Looking ahead, the largest opportunity may come from the convergence of marketing and operational intelligence. As organizations connect customer engagement with inventory, workforce, building, and IoT data, proximity marketing can become part of a broader real-time decision platform.
Regional Insights
North America is expected to maintain its leadership position in the Proximity Marketing Market because of high enterprise spending on digital marketing, widespread smartphone usage, sophisticated retail networks, and established cloud infrastructure. The region also has a strong ecosystem of technology vendors and enterprises experimenting with location-based engagement. Earlier beacon deployments by major retailers helped demonstrate the commercial potential of personalized physical-store experiences, while newer deployments are increasingly incorporating analytics and operational use cases.
Europe is expected to represent a mature but technologically advanced market. Retail modernization, smart-building initiatives, tourism infrastructure, and demand for personalized customer experiences support adoption. However, privacy and data-governance requirements can make implementation more structured, increasing the importance of explicit consent, transparent data practices, and secure architecture.
Asia Pacific is forecast to be the fastest-growing region. Expanding organized retail, mobile-first consumers, smart-city projects, digital payments, and rapid IoT adoption create favorable conditions for proximity marketing. China and Japan are particularly important because of their advanced technology ecosystems, dense urban environments, and high demand for connected customer experiences.
- North America is expected to remain the leading regional market through the forecast period.
- Asia Pacific is projected to record the fastest CAGR.
- Europe will emphasize privacy-conscious and integrated proximity experiences.
- Smart retail and smart-city investments are widening the addressable market.
- Hybrid BLE, UWB, Wi-Fi, and IoT platforms are likely to gain regional traction.
Country-Specific Market Trends
China is expected to represent one of the fastest-growing national markets in Asia Pacific, supported by large-scale digital commerce, smart-city investment, connected retail infrastructure, and widespread smartphone adoption. Proximity marketing can increasingly be integrated with mobile applications, digital loyalty systems, payment ecosystems, and indoor navigation. Japan is expected to maintain strong adoption in retail, transportation, hospitality, and smart-building applications, with demand supported by advanced automation and IoT capabilities. APAC overall is expected to record approximately 16-18% CAGR through 2035.
In North America, the United States will remain the largest national market due to mature retail technology, strong cloud adoption, established loyalty programs, and significant enterprise investment in customer analytics. Canada is expected to demonstrate steady adoption across retail, transportation, hospitality, and public infrastructure, while Mexico offers emerging opportunities as organized retail and digital commerce expand. The regional national markets are collectively expected to maintain approximately 13-15% CAGR, with the United States accounting for the largest share.
Germany and France are expected to lead European adoption. Germany's strong industrial and retail technology ecosystem creates opportunities for proximity-enabled smart facilities and customer engagement, while France offers significant potential across tourism, hospitality, retail, and connected public spaces. European markets are likely to emphasize privacy-by-design architectures and consent-based engagement, resulting in an estimated 11-14% CAGR range across major markets.
- China is expected to benefit from rapid mobile and smart-city adoption.
- Japan will emphasize automation, IoT, transportation, and advanced retail experiences.
- United States is expected to remain the largest North American country market.
- Germany and France will support European growth through retail and smart-infrastructure investments.
- Privacy, consent, and cybersecurity will increasingly influence country-level deployment strategies.
Key Proximity Marketing Market Company Insights
The competitive landscape includes technology providers focused on beacons, location intelligence, IoT platforms, customer engagement, and indoor positioning. Major participants and ecosystem companies include Apple, Google, Kontakt.io, Estimote, BlueCats, Aruba Networks, Cisco, HID Global, Gimbal, and Beaconinside. Their strategies increasingly extend beyond basic proximity notifications toward location intelligence, analytics, asset visibility, smart-building integration, and automated engagement. Industry research indicates that the beacon ecosystem is broadening from traditional proximity marketing toward enterprise-grade applications such as asset tracking, indoor navigation, staff safety, and building utilization.
Apple and Google have historically played an important role in establishing beacon-related mobile ecosystems, while specialist providers such as Kontakt.io, Estimote, BlueCats, and Gimbal have focused on beacon hardware, location platforms, analytics, and enterprise applications. Network and infrastructure companies such as Aruba and Cisco can provide the connectivity and management layers required to integrate proximity data with larger enterprise environments.
The next competitive phase is expected to focus heavily on AI-powered analytics, interoperability, privacy management, cloud scalability, and integration with CRM and marketing automation platforms. Vendors capable of demonstrating measurable improvements in conversion, customer retention, operational efficiency, or visitor experience are likely to gain an advantage over providers competing primarily on hardware cost.
- Vendors are shifting from beacon hardware toward full location-intelligence platforms.
- AI-powered customer analytics are becoming an important competitive differentiator.
- Cloud management improves scalability across multi-location deployments.
- Integration with CRM, loyalty, and marketing automation systems is increasingly important.
- Privacy, security, and interoperability are becoming core product-selection criteria.
Recent Developments
Recent market development has centered on the transition from traditional beacon-based messaging to broader location intelligence. Current beacon platforms increasingly support indoor navigation, asset tracking, visitor analytics, and workflow automation in addition to customer engagement. This expansion is helping proximity technology reach healthcare, logistics, transportation, manufacturing, and smart-building environments.
A second major development is the integration of AI and cloud analytics into proximity platforms. Instead of relying entirely on fixed rules, newer systems can analyze behavioral data and automate campaign decisions, enabling more contextual personalization.
The third development is the growing use of hybrid positioning. BLE continues to provide a cost-effective foundation, while UWB, Wi-Fi, RFID, and other technologies can be incorporated when greater positioning accuracy or wider operational functionality is required.
Market Segmentation
The Proximity Marketing Market can be segmented by product into beacons, proximity marketing platforms, mobile applications, gateways, and associated services. Beacons and beacon-enabled solutions remain foundational, but software and managed services are expected to capture increasing value as businesses demand centralized analytics, campaign automation, and integration with customer-data systems. By technology/component, the market includes Bluetooth Low Energy, Wi-Fi, UWB, NFC, RFID, QR-based solutions, cloud platforms, mobile connectivity, and hybrid positioning technologies. BLE is expected to remain the leading connectivity approach, while UWB and multi-technology systems will gain traction in precision-location applications.
By application, retail is expected to hold the largest share, followed by hospitality, transportation and tourism, healthcare, entertainment, banking and financial services, education, and smart buildings. Retail will remain strongly focused on customer engagement, whereas other sectors are expected to increasingly adopt proximity technology for navigation, asset management, workflow automation, and visitor services. By region, the market spans North America, Europe, Asia Pacific, Latin America, and the Middle East & Africa, with North America leading and Asia Pacific recording the fastest growth.
- Retail is expected to remain the largest application segment.
- BLE is projected to remain the leading technology foundation.
- Software, analytics, and managed services will gain market importance.
- Asia Pacific is expected to record the fastest regional expansion.
- Hybrid positioning will create new opportunities beyond conventional marketing.
Conclusion
The Proximity Marketing Market is evolving from a niche beacon-enabled advertising solution into a broader digital engagement and location-intelligence ecosystem. Over the forecast period through 2035, AI, IoT, cloud computing, automation, and advanced positioning technologies are expected to transform how businesses understand and respond to customers in physical environments. The market's estimated expansion from approximately USD 8-10 billion in 2025 to USD 35-40 billion by 2035 indicates substantial room for investment in platforms that connect physical locations with digital customer journeys.
AI will be particularly important because it can transform raw proximity signals into actionable intelligence. Instead of simply identifying that a customer is near a store section, AI-enabled systems can determine the likely intent of that customer, identify the most relevant product or promotion, and automate engagement while considering previous interactions and real-time context.
Businesses should therefore view proximity marketing as part of a wider digital-transformation strategy rather than a standalone advertising channel. Companies that combine location intelligence with CRM, loyalty, inventory, IoT, analytics, and automation capabilities will be better positioned to create measurable customer value. At the same time, responsible data practices, consent management, cybersecurity, and transparent customer experiences will be essential for sustainable adoption. With strong double-digit growth expected through 2035, proximity marketing is positioned to become an increasingly strategic component of connected retail, smart venues, and real-time customer experience management.
FAQs
1. What is the estimated Proximity Marketing Market size?
The global Proximity Marketing Market is estimated at approximately USD 8-10 billion in 2025. Based on current technology adoption and the expansion of location-based engagement, the market is projected to reach approximately USD 35-40 billion by 2035.
2. What is the expected growth rate of the Proximity Marketing Market?
The Proximity Marketing Market is expected to grow at an estimated 14-16% CAGR during the forecast period. Growth is being supported by increasing smartphone connectivity, IoT adoption, cloud platforms, AI-driven personalization, and demand for omnichannel customer engagement.
3. What are the key drivers of the Proximity Marketing Market?
Major drivers include the growth of location-based services, increasing smartphone and wearable adoption, expansion of organized retail, demand for personalized customer experiences, IoT deployment, cloud computing, AI-based analytics, and marketing automation. BLE's low power consumption and compatibility with connected devices also support adoption.
4. Which region is leading the Proximity Marketing Market?
North America is expected to remain the leading regional market because of mature retail infrastructure, high digitalization, strong enterprise technology spending, and established cloud and customer-data ecosystems. Asia Pacific, however, is projected to achieve the fastest growth through 2035.
5. Who are the key companies in the Proximity Marketing Market?
Key companies and ecosystem participants include Apple, Google, Kontakt.io, Estimote, BlueCats, Aruba Networks, Cisco, HID Global, Gimbal, and Beaconinside. Competitive strategies increasingly emphasize AI, cloud analytics, indoor positioning, IoT integration, automation, and privacy-focused location intelligence.
To speak to our analyst for a discussion on the above findings, click Speak to Analyst
 Exclusive indicates content/data unique to MarketsandMarkets and not available with any competitors.
Table of Contents
1 Introduction (Page No. - 15)
1.1 Objectives of the Study
1.2 Market Definition
1.3 Study Scope
1.3.1 Markets Covered
1.3.2 Years Considered for the Study
1.4 Currency
1.5 Limitations
1.6 Stakeholders
2 Research Methodology (Page No. - 19)
2.1 Research Data
2.1.1 Secondary Data
2.1.1.1 Key Data From Secondary Sources
2.1.2 Primary Data
2.1.2.1 Key Data From Primary Sources
2.1.2.2 Key Industry Insights
2.1.2.3 Breakdown of Primaries
2.2 Market Size Estimation
2.2.1 Bottom-Up Approach
2.2.2 Top-Down Approach
2.3 Market Share Estimation
2.4 Market Breakdown and Data Triangulation
2.5 Research Assumptions
3 Executive Summary (Page No. - 28)
4 Premium Insights (Page No. - 33)
4.1 Attractive Opportunities for the Growth of the Proximity Marketing Market
4.2 Market for Proximity Marketing, By Location
4.3 Software Market Expected to Grow at the Highest CAGR During the Forecast Period in the Market
4.4 Market for Proximity Marketing, By Service
4.5 North America Held A Major Share of the Overall Market in 2015
4.6 Market for Proximity Marketing, By Application
5 Market Overview (Page No. - 36)
5.1 Introduction
5.2 Market Segmentation
5.2.1 By Location
5.2.2 By Technology
5.2.3 By Hardware
5.2.4 By Software
5.2.5 By Service
5.2.6 By Application
5.2.7 By Geography
5.3 Market Dynamics
5.3.1 Drivers
5.3.1.1 Increased Focus on Business Intelligence (BI) and Rising Market Competitiveness
5.3.1.2 Growing Adoption of Smartphones and Proximity Technology
5.3.1.3 Increasing Technological Advancements in Location-Based Services
5.3.1.4 Increased Use of Beacons and Growing Availability of Spatial Data and Analytical Tools
5.3.2 Restraints
5.3.2.1 Concerns Regarding Security & Privacy
5.3.2.2 Low Awareness Among End Users and Lack of Expert Workforce
5.3.3 Opportunities
5.3.3.1 Rising Demand for Internet of Things (IOT) and Emergence of the Cloud Platform
5.3.3.2 High Demand for Mobile Computing and Trending Social Media
5.3.4 Challenges
5.3.4.1 Challenges in Understanding Consumer Behaviour
6 Industry Trends (Page No. - 46)
6.1 Introduction
6.2 Value Chain Analysis
6.3 Porter’s Five Forces Analysis
6.3.1 Intensity of Competitive Rivalry
6.3.2 Threat of Substitutes
6.3.3 Bargaining Power of Buyers
6.3.4 Bargaining Power of Suppliers
6.3.5 Threat of New Entrants
7 Market, By Location (Page No. - 56)
7.1 Introduction
7.2 Indoor Proximity Marketing
7.3 Outdoor Proximity Marketing
8 Market, By Technology (Page No. - 59)
8.1 Introduction
8.2 Wi-Fi
8.3 BLE Beacons
8.4 Near Field Communication (NFC)
8.5 GPS Geofencing
8.6 Others
9 Market, By Hardware (Page No. - 71)
9.1 Introduction
9.2 Sensors
9.3 RFID Tags
9.4 Others
10 Market, By Software (Page No. - 77)
10.1 Introduction
10.2 Content Management System
10.3 Location Analytics
10.4 Context Accelerator and Geofencing
10.5 Others
11 Market, By Service (Page No. - 82)
11.1 Introduction
11.2 Consulting Services
11.3 Deployment & Integration Services
11.4 Application Support & Maintenance Services
12 Market, By Application (Page No. - 85)
12.1 Introduction
12.2 Retail and E-Commerce
12.3 Healthcare
12.4 Infrastructural
12.4.1 Media and Entertainment
12.4.1.1 Sports and Events
12.4.1.2 Museums
12.4.2 Transporation and Logistics
12.4.3 Hospitality
12.5 Banking, Financial Services, and Insurance (BFSI)
12.6 Other Applications
13 Proximity Marketing Market, By Geography (Page No. - 110)
13.1 Introduction
13.2 North America
13.2.1 U.S.
13.2.2 Canada
13.2.3 Mexico
13.3 Europe
13.3.1 U.K.
13.3.2 Germany
13.3.3 France
13.3.4 Rest of Europe
13.4 Asia-Pacific (APAC)
13.4.1 China
13.4.2 Japan
13.4.3 India
13.4.4 South Korea
13.4.5 Rest of APAC
13.5 Rest of the World (RoW)
13.5.1 Middle East & Africa
13.5.2 South America
14 Competitive Landscape (Page No. - 141)
14.1 Overview
14.2 Market Ranking Analysis of the Proximity Marketing Market
14.3 Competitive Situation and Trends
14.3.1 New Product Launches/New Product Developments
14.3.2 Partnerships & Agreements
14.3.3 Expansions, Investments and Patents
14.3.4 Mergers & Acquisitions
15 Company Profiles (Page No. - 153)
(Overview, Products and Services, Financials, Strategy & Development)*
15.1 Introduction
15.2 Google Inc.
15.3 Microsoft Corporation
15.4 Apple Inc.
15.5 Zebra Technologies Corporation
15.6 Qualcomm Inc.
15.7 Inmarket LLC
15.8 Swirl Networks Inc.
15.9 Shopkick
15.10 Estimote Inc.
15.11 Unacast
15.12 Bluvision, Inc.
15.13 Roximity
15.14 Proxama PLC
15.15 Scanbuy Inc.
*Details on Overview, Products and Services, Financials, Strategy & Development Might Not Be Captured in Case of Unlisted Companies.
16 Appendix (Page No. - 184)
16.1 Insights of Industry Experts
16.2 Discussion Guide
16.3 Knowledge Store: Marketsandmarkets’ Subscription Portal
16.4 Introducing RT: Real-Time Market Intelligence
16.5 Available Customizations
16.6 Related Reports
List of Tables (71 Tables)
Table 1 Proximity Marketing Market, By Technology, 2013–2022 (USD Billion)
Table 2 Proximity Marketing Market, By Application, 2013–2022 (USD Billion)
Table 3 Proximity Marketing Market, By Region, 2013–2022 (USD Billion)
Table 4 Quantification of the Overall Porter’s Analysis
Table 5 Proximity Marketing Market, By Location, 2013–2022 (USD Billion)
Table 6 Comparison Between Wi-Fi, BLE and NFC
Table 7 Proximity Marketing Market, By Technology, 2013–2022 (USD Billion)
Table 8 Wi-Fi–Based Proximity Marketing Market, By Application, 2013–2022 (USD Billion)
Table 9 BLE Beacons-Based Proximity Marketing Market, By Application, 2013–2022 (USD Billion)
Table 10 NFC-Based Proximity Marketing Market, By Application, 2013–2022 (USD Billion)
Table 11 GPS Geofencing-Based Proximity Marketing Market, By Application, 2013–2022 (USD Billion)
Table 12 Market Based on Other Technologies, By Application, 2013–2022 (USD Billion)
Table 13 Market, By Type, 2013–2022 (USD Billion)
Table 14 Market, By Hardware, 2013–2022 (USD Billion)
Table 15 Market Volume, By Hardware, 2013–2022 (Million Units)
Table 16 Difference Between Active and Passive RFID Tags
Table 17 Market, By Software, 2013–2022 (USD Billion)
Table 18 Market, By Service, 2013–2022 (USD Billion)
Table 19 Market, By Application, 2013–2022 (USD Billion)
Table 20 Market for Retail and E-Commerce Application, By Region, 2013–2022 (USD Million)
Table 21 Market for Retail and E-Commerce Application in North America, By Country, 2013–2022 (USD Million)
Table 22 Market for Retail and E-Commerce Application in Europe, By Country, 2013–2022 (USD Million)
Table 23 Market for Retail and E-Commerce Application in APAC, By Country, 2013–2022 (USD Million)
Table 24 Market for Retail and E-Commerce Application in RoW, By Region, 2013–2022 (USD Million)
Table 25 Market for Healthcare Application, By Region, 2013–2022 (USD Million)
Table 26 Market for Healthcare Application in North America, By Country, 2013–2022 (USD Million)
Table 27 Market for Healthcare Application in Europe, By Country, 2013–2022 (USD Million)
Table 28 Market for Healthcare Application in APAC, By Country, 2013–2022 (USD Million)
Table 29 Market for Healthcare Application in RoW, By Region, 2013–2022 (USD Million)
Table 30 Market for Infrastructural Application, By Region, 2013–2022 (USD Million)
Table 31 Market for Infrastructural Application in North America, By Country, 2013–2022 (USD Million)
Table 32 Market for Infrastructural Application in Europe, By Country, 2013–2022 (USD Million)
Table 33 Market for Infrastructural Application in APAC, By Country, 2013–2022 (USD Million)
Table 34 Market for Infrastructural Application in RoW, By Region, 2013–2022 (USD Million)
Table 35 Market for BFSI Application, By Region, 2013–2022 (USD Million)
Table 36 Market for BFSI Application in North America, By Country, 2013–2022 (USD Million)
Table 37 Market for BFSI Application in Europe, By Country, 2013–2022 (USD Million)
Table 38 Market for the BFSI Application in APAC, By Country, 2013–2022 (USD Million)
Table 39 Market for BFSI Application in RoW, By Region, 2013–2022 (USD Million)
Table 40 Market for Other Applications, By Region, 2013–2022 (USD Million)
Table 41 Market for Other Applications in North America, By Country, 2013–2022 (USD Million)
Table 42 Market for Other Applications in Europe, By Country, 2013–2022 (USD Million)
Table 43 Market for Other Applications in APAC, By Country, 2013–2022 (USD Million)
Table 44 Market for Other Applications in RoW, By Region, 2013–2022 (USD Million)
Table 45 Market, By Region, 2013–2022 (USD Billion)
Table 46 Market in North America, By Country, 2013–2022 (USD Billion)
Table 47 Market in North America, By Application, 2013–2022 (USD Million)
Table 48 Market in U.S., By Application, 2013–2022 (USD Million)
Table 49 Market in Canada, By Application, 2013–2022 (USD Million)
Table 50 Market in Mexico, By Application, 2013–2022 (USD Million)
Table 51 Market in Europe, By Country, 2013–2022 (USD Billion)
Table 52 Market in Europe, By Application, 2013–2022 (USD Million)
Table 53 Market in U.K., By Application, 2013–2022 (USD Million)
Table 54 Market in Germany, By Application, 2013–2022 (USD Million)
Table 55 Market in France, By Application, 2013–2022 (USD Million)
Table 56 Market in Rest of Europe, By Application, 2013–2022 (USD Million)
Table 57 Market in APAC, By Country, 2013–2022 (USD Billion)
Table 58 Market in APAC, By Application, 2013–2022 (USD Million)
Table 59 Market in China, By Application, 2013–2022 (USD Million)
Table 60 Market in Japan, By Application, 2013–2022 (USD Million)
Table 61 Market in India, By Application, 2013–2022 (USD Million)
Table 62 Market in South Korea, By Application, 2013–2022 (USD Million)
Table 63 Market in Rest of APAC, By Application, 2013–2022 (USD Million)
Table 64 Market in RoW, By Region, 2013–2022 (USD Billion)
Table 65 Market in RoW, By Application, 2013–2022 (USD Million)
Table 66 Market in Middle East & Africa, By Application, 2013–2022 (USD Million)
Table 67 Market in South America, By Application, 2013–2022 (USD Million)
Table 68 New Product Launches
Table 69 Partnerships, Contracts, Agreements, and Joint Ventures
Table 70 Expansions, Investments, and Patents
Table 71 Mergers & Acquisitions
List of Figures (76 Figures)
Figure 1 Market Segmentation
Figure 2 Proximity Marketing Market: Research Design
Figure 3 Process Flow of Market Size Estimation
Figure 4 Market Size Estimation Methodology: Bottom-Up Approach
Figure 5 Market Size Estimation Methodology: Top-Down Approach
Figure 6 Data Triangulation
Figure 7 Proximity Marketing Market, 2013–2022 (USD Billion)
Figure 8 Proximity Marketing Market, By Type, 2016 vs 2022 (USD Billion)
Figure 9 Proximity Marketing Market, By Technology, 2013–2022 (USD Billion)
Figure 10 Proximity Marketing Market, By Application, 2016 vs 2022 (USD Billion)
Figure 11 APAC Market Expected to Grow at the Highest CAGR Between 2016 and 2022
Figure 12 Proximity Marketing Market Expected to Exhibit High Growth Between 2016 and 2022
Figure 13 Indoor Proximity Marketing Held the Largest Market Share in 2015
Figure 14 Location Analytics Software Expected to Exhibit the Highest Growth During the Forecast Period
Figure 15 Deployment and Integration Services Expected to Grow at the Highest CAGR During the Forecast Period
Figure 16 APAC Expected to Grow at the Highest CAGR During the Forecast Period
Figure 17 Market for Infrastructual Application Expected to Grow at the Highest CAGR Between 2016 and 2022
Figure 18 Proximity Marketing Market: Drivers, Restraints, Opportunities, and Challenges
Figure 19 Value Chain Analysis: Proximity Marketing Market
Figure 20 Porter’s Five Forces Analysis, 2015
Figure 21 Proximity Marketing Market: Porter’s Five Forces Analysis (2015)
Figure 22 High Impact of Intensity of Competitive Rivalry in the Proximity Marketing in 2015
Figure 23 Low Impact of Threat of Substitutes in the Proximity Marketing in 2015
Figure 24 High Impact of the Bargaining Power of Buyers in the Proximity Marketing in 2015
Figure 25 Medium Impact of Bargaining Power of Suppliers in the Proximity Marketing in 2015
Figure 26 High Impact of the Threat of New Entrants High in the Proximity Marketing in 2015
Figure 27 Proximity Marketing Market, By Location, 2016 vs 2022 (USD Billion)
Figure 28 BLE Beacons–Based Proximity Marketing Expected to Grow at the Highest CAGR in the Proximity Marketing Market
Figure 29 Wi-Fi–Based Proximity Marketing Market, By Application, 2016 vs 2022 (USD Billion)
Figure 30 BLE Beacons-Based Proximity Marketing Market, By Application, 2016 vs 2022 (USD Billion)
Figure 31 NFC-Based Proximity Marketing Market, By Application, 2016 vs 2022 (USD Billion)
Figure 32 Types of Geofencing Action Triggers
Figure 33 GPS Geofencing-Based Proximity Marketing Market, By Application, 2016 vs 2022 (USD Billion)
Figure 34 Market Based on Other Technologies, By Application, 2016 vs 2022 (USD Billion)
Figure 35 Proximity Marketing Market, By Type, 2016 vs 2022 (USD Billion)
Figure 36 Proximity Marketing Market, By Hardware, 2016 vs 2022 (USD Billion)
Figure 37 Proximity Marketing Market, By Software, 2016 vs 2022 (USD Billion)
Figure 38 Proximity Marketing Market, By Service, 2016 vs 2022 (USD Billion)
Figure 39 Applications of Proximity Marketing Market
Figure 40 Proximity Marketing Market, By Application, 2016 vs 2022 (USD Billion)
Figure 41 Proximity Marketing Market in Retail and E-Commerce Application, By Region, 2016 vs 2022 (USD Million)
Figure 42 Proximity Marketing Market for Healthcare Application, By Region, 2016 vs 2022 (USD Million)
Figure 43 Different Media and Entertainment Applications in the Proximity Marketing Market
Figure 44 Market for Infrastructural Application, By Region, 2016 vs 2022 (USD Million)
Figure 45 Market for BFSI Application, By Region, 2016 vs 2022 (USD Million)
Figure 46 Market for Other Applications, By Region, 2016 vs 2022 (USD Million)
Figure 47 Proximity Marketing Market, By Geography
Figure 48 Geographic Snapshot of Proximity Marketing Market: Rapidly Growing Markets Emerging as New Hotspots
Figure 49 APAC Expected to Register the Highest Growth Rate During the Forecast Period
Figure 50 Proximity Marketing Market, By Region, 2016 vs 2022 (USD Billion)
Figure 51 U.S. Held A Major Share of the North American Proximity Marketing Market in 2015
Figure 52 Market in North America, By Country, 2016 vs 2022 (USD Billion)
Figure 53 Market in North America, By Application, 2016 vs 2022 (USD Million)
Figure 54 Market in Europe, By Country, 2016 vs 2022 (USD Billion)
Figure 55 Market in Europe, By Application, 2016 vs 2022 (USD Million)
Figure 56 Snapshot of the Proximity Marketing in APAC (China–The Most Lucrative Market in 2015)
Figure 57 Market in APAC, By Country, 2016 vs 2022 (USD Billion)
Figure 58 Market in APAC, By Application, 2016 vs 2022 (USD Million)
Figure 59 Market in RoW, By Region, 2016 vs 2022 (USD Billion)
Figure 60 Market in RoW, By Application, 2016 vs 2022 (USD Million)
Figure 61 Companies Adopted New Product Developments and Partnerships & Agreements as the Key Growth Strategies Between 2013 and 2015
Figure 62 Zebra Technologies Corporation Grew at the Highest Rate Between 2013 and 2015
Figure 63 Key Player Market Ranking, 2015
Figure 64 Market Evolution Framework—Strategy of Partnerships and Agreements Fueled Growth and Innovation in the Market Between 2013 and 2015
Figure 65 Battle for Market Share: New Product Launches and Partnerships & Agreements Were the Key Strategies Between 2013 and 2015
Figure 66 Geographic Revenue Mix of the Top 5 Proximity Marketing Market Players
Figure 67 Google Inc.: Company Snapshot
Figure 68 Google Inc.: SWOT Analysis
Figure 69 Microsoft Corporation: Company Snapshot
Figure 70 Microsoft Corporation: SWOT Analysis
Figure 71 Apple Inc.: Company Snapshot
Figure 72 Apple Inc.: SWOT Analysis
Figure 73 Zebra Technologies Corporation:Company Snapshot
Figure 74 Zebra Technologies Corporation: SWOT Analysis
Figure 75 Qualcomm Inc. Company Snapshot
Figure 76 Proxama PLC: Company Snapshot
Research Methodology:
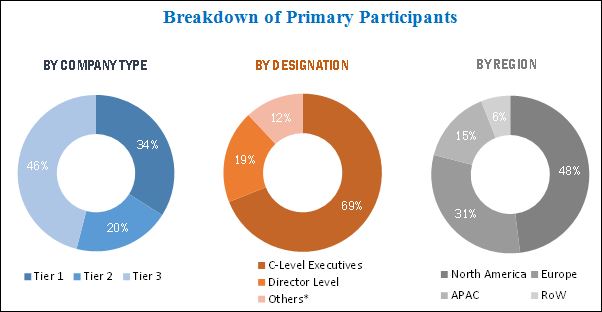
The research methodology used to estimate and forecast the proximity marketing market begins with capturing data on key vendor revenues through secondary research. The vendor offerings are also taken into consideration to determine the market segmentation. The bottom-up procedure was employed to arrive at the overall market size of the global market from the revenue of the key market players. After arriving at the overall market size, the total market has been split into several segments and subsegments, which were then verified through primary research by conducting extensive interviews with key people such as CEOs, VPs, directors, and executives. The data triangulation and market breakdown procedures have been employed to complete the overall market engineering process and arrive at the exact statistics for all segments and subsegments. The breakdown of the profiles of primary respondents has been depicted in the figure below:
To know about the assumptions considered for the study, download the pdf brochure
This report provides valuable insights into the ecosystem of the proximity marketing market. The major players in this industry include Apple Inc. (U.S.), Google Inc. (U.S.), Microsoft Corporation (U.S.), Qualcomm Inc. (U.S.), Zebra Technologies Corporation (U.S), Bluvision Inc. (U.S.), Estimote Inc. (U.S.), inMarket Media LLC (Italy), Proxama PLC (U.K.), ROXIMITY (U.S.), Shopkick Inc. (U.S.), Swirl Networks (U.S.), and Unacast (U.S.), among others.
Please visit 360Quadrants to see the vendor listing of Affiliate Marketing Software
Key Target Audience
- Raw material and manufacturing equipment suppliers
- Semiconductor foundries
- Original equipment manufacturers (OEMs)
- Smart device manufacturers and network providers
- ODM and OEM technology solution providers
- Mobile content developers and aggregators
- Mobile commerce and advertising companies
- Research organizations
- Technology standards organizations, forums, alliances, and associations
- Technology investors and venture capitalists
- Governments, financial institutions, and investment communities
- Analysts and strategic business planners
- End users
Scope of the Report:
The research report segments the proximity marketing market into the following submarkets:
By Location:
- Indoor
- Outdoor
By Technology:
- Wi-Fi
- BLE Beacon
- Near Field Communication (NFC)
- GPS Geofencing
- Others
By Hardware:
- Sensors
- RFID Tags
- Others
By Software:
- Content Management System
- Location Analytics
- Context Accelerator and Geofencing
- Others
By Service:
- Consulting Services
- Deployment & Integration Services
- Application Support & Maintenance Services
By Application:
- Retail & E-Commerce
- Healthcare
-
Infrastructural
-
Media & Entertainment
- Sports & Events
- Museums
- Transportation & Logistics
- Hospitality
-
Media & Entertainment
- Banking, Financial Services, and Insurance (BFSI)
- Other Applications
By Geography:
-
North America
- U.S.
- Canada
- Mexico
-
Europe
- U.K
- Germany
- France
- Rest of Europe
-
Asia-Pacific (APAC)
- China
- Japan
- India
- South Korea
- India
- Rest of APAC
-
Rest of the World (RoW)
- Middle East and Africa
- South America
Available Customizations:
With the given market data, MarketsandMarkets offers customizations according to the company’s specific needs. The following customization options are available for the report.
Company Information
- Detailed analysis and profiling of additional market players (Up to five)
- Additional regional analysis












Growth opportunities and latent adjacency in Market