Wind Turbine Rotor Blade Market by Material (Glass Fiber, Carbon Fiber), by Blade Size (<27 Meter, 27-37 Meter, 38-50 Meter, and >50 Meter) and Geography - Global Trends and Forecasts to 2019


The use of carbon fiber is expected to grow at a fast rate as the trend for larger blade sizes takes a firm hold in the global market. The wind turbine rotor blade market to reach a value of $16,982 and it is projected to grow at a CAGR of 9.2% from 2014 to 2019. In 2014, the market was dominated by Asia-Pacific, which had more than 54% of the total installed blades in the world. The region is projected to remain the most attractive market through to 2019, even as South America along with the Middle East and Africa are set to witness promising growth rates.
The market was segmented on the basis of material type, blade length, and region in terms of volume and value. The market segments by material type include carbon fiber and glass fiber. The market segments for blade lengths include <27 meter, 27-37 meter, 38-50 meter, and >50 meter blades. The regional segmentation includes market volume and value for Asia-Pacific, North America, Europe, the Middle East and Africa, and South America.
The report provides a full analysis of key companies and competitive analysis of developments recorded in the industry during the past three years. Market drivers, restraints, and opportunities of the market are discussed in detail. The leading players in the market such Siemens AG (Germany), Vestas Wind System AS (Denmark), Suzlon Energy Limited (India), Acciona S.A. (Spain), and Gamesa Corporacion Tecnologica (Spain) have been profiled in this report.
Favorable policy environment and declining cost of wind energy generation are propelling the growth of wind turbine rotor blade. A combination of environmental concerns and economic advantages has led governments across the world to support the renewable energy industry. Although costs for generating wind power have been falling over the years, the capital costs involved in setting up a functional wind power project still remain high. Apart from construction and installation of wind turbines, costs may also increase, depending on the load factor and capacity factor of the turbines, which vary from according to the location of the project and the quality of wind resource.
Wind Turbine Rotor Market Size, by Region 2014-2019 (No. of Units)
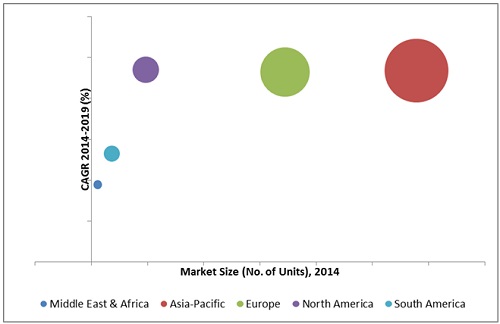
Source: MarketsandMarkets Analysis
In 2014, Asia-Pacific is estimated to be the largest market for wind turbine rotor blades and is expected to remain so in 2014. The key players of wind turbine rotor blade market undertake various agreements, contracts, joint ventures, and partnerships to increase their share in the market. The leading turbine blade manufacturers are trying to locate their facilities closer to their target markets in order to reduce transportation costs and meet regulatory conditions.
Scope of the Report
This report focuses on the wind turbine rotor blade market. The market was segmented on the basis of material types, blade lengths, and regions.
On the basis of material type
- Carbon Fiber
- Glass Fiber
On the basis of blade lengths
- <27 meter
- 27-37 meter
- 38-50 meter
- >50 meter
On the basis of region
- Asia-Pacific
- North America
- Europe
- Middle East and Africa
- South America
The global wind turbine blade market was valued at $9,998.9 million in 2013 and it is projected to reach a value of $16,982 million by 2019 from an estimated value of $10,914.3 million in 2014 with a CAGR of 9.2% for forecast period.. Rising electricity demand, support from government policies, and reducing costs of wind power generation are the major drivers for this market. The most commonly used turbines in the past few years have a capacity of 1.5 to 2.5 MW, for which the blade length varies between 38-50 meters.
The wind turbine rotor blade market is estimated to witness large-scale investments in wind power projects, creating healthy opportunities for market growth. According to projections made by the International Energy Agency (IEA), global wind energy generation is set to get double by 2018, accounting for nearly 25% of all electricity generated in the world, making it the fastest growing among all other renewable energy options.
The wind turbine rotor blade market was segmented on the basis of material, blade length, and region. The market segmentation on the basis of material types includes glass fiber and carbon fiber, whereas blade length includes blades <27 meters, between 27-37 meter, between 38-50 meter, and blade length >50 meters. The regional segmentation of the market includes Asia-Pacific, Europe, North America, South America and the Middle East and Africa.
Wind Turbine Rotor Blade Market Size, by Region, 2012-2019 (MW)
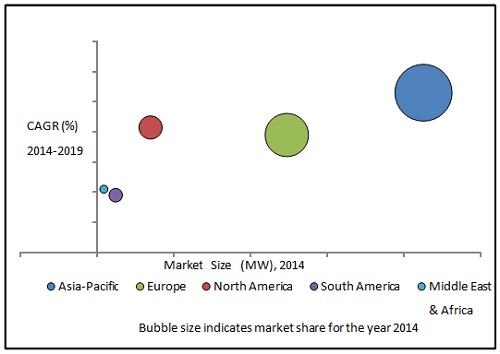
Source: Secondary Research and MarketsandMarkets Analysis
In 2014, Asia-Pacific was the largest market for wind turbine rotor blade and it is estimated to grow at the fastest CAGR as well. In 2014, Asia-Pacific is expected to be the largest market for wind turbine rotor blade and is estimated to grow at the highest CAGR. The key players of wind turbine rotor blade prefer contracts and agreements, new product developments, and mergers and acquisitions strategies to garner a larger share in the market. The leading wind turbine rotor blade manufacturers are focusing on the emerging countries that are estimated to show potential demand for wind power generation in the near future.
 Exclusive indicates content/data unique to MarketsandMarkets and not available with any competitors.
Table of Contents
1 Introduction (Page No. - 14)
1.1 Objectives
1.2 Market Definition
1.3 Market Scope
1.3.1 Markets Covered
1.3.2 Years
1.4 Currency & Pricing
1.5 Package Size
1.6 Limitations
1.7 Stakeholders
2 Research Methodoloy (Page No. - 17)
2.1 Research Data
2.2 Secondary Data
2.2.1 Key Data From Secondary Sources
2.3 Primary Data
2.3.1 Key Data From Primary Sources
2.3.2 Key Industry Insights
2.3.3 Breakdown of Primary Interviews
2.4 Market Size Estimation
2.5 Market Breakdown and Data Triangulation
2.6 Research Asssumptions
2.6.1 Assumptions of the Research Study
3 Executive Summary (Page No. - 25)
4 Premium Insights (Page No. - 33)
4.1 Attractive Opportunities in offshore Wind Power Generation
4.2 Wind Turbine Rotor Blade Market, By Blade Length
4.3 Wind Turbine Rotor Blade Market in Asia-Pacific
4.4 Asia-Pacific to Account for More Than Half of the Market Share
4.5 Wind Turbine Rotor Blade Market: Developed vs. Developing Nations
4.6 Wind Turbine Rotor Blade Market, By Blade Length (2014-2019)
4.7 Wind Turbine Rotor Blade Market, By Blade Length
4.8 Life Cycle Analysis, By Region
5 Market Overview (Page No. - 41)
5.1 Global Wind Energy Scenario
5.2 Market Evolution
5.3 Market Segmentation
5.3.1 By Materials
5.3.2 By Blade Length
5.3.3 By Region
5.4 Market Dynamics
5.4.1 Drivers
5.4.1.1 Favorable Environmental Policy
5.4.1.2 Declining Costs of Wind Energy Generation
5.4.2 Restraints
5.4.2.1 High Capital Investment
5.4.2.2 Use of Expensive Material
5.4.3 Opportunities
5.4.3.1 Future Growth in Wind Energy Sector
5.4.3.2 Repowering Old Projects
5.4.3.3 Increasing Size of Rotor Blades
5.4.4 Challenges
5.4.4.1 Localized Regulatory Hurdles
5.4.4.2 Opposition From Local Communities and Energy Lobbies
5.4.4.3 Transportation of Rotor Blades
5.4.4.4 Variability in Wind Speeds
6 Industry Trends (Page No. - 55)
6.1 Value Chain Analysis
6.2 Porter�s Five Forces Analysis
6.2.1 Threat of New Entrants
6.2.2 Threat of Substitutes
6.2.3 Bargaining Power of Suppliers
6.2.4 Bargaining Power of Buyers
6.2.5 Intensity of Rivalry
7 Wind Turbine Blade Market, By Material (Page No. - 60)
7.1 Introduction
7.2 Market Analysis, By Blade Material, 2012�2019 ($Million)
7.3 Market Analysis, By Material, 2012�2019 (Metric Tonnes)
7.4 Glass Fiber
7.4.1 By Region
7.5 Carbon Fiber
7.5.1 By Region
7.6 Regional Overview
7.6.1 Middle East & Africa
7.6.2 Asia-Pacific
7.6.3 Europe
7.6.4 North America
7.6.5 South America
8 Wind Turbine Blade Market, By Blade Length (Page No. - 71)
8.1 Introduction
8.2 Market Analysis, By Blade Length
8.2.1 Less Than 27 Meter
8.2.2 Between 27-37 Meter
8.2.3 Between 38-50 Meter
8.2.4 Greater Than 50 Meters
8.3 Region-Wise Wind Turbine Blade Market, By Blade Length
8.3.1 Middle East and Africa
8.3.2 Asia-Pacific
8.3.3 European
8.3.4 North America
8.3.5 South America
9 Wind Turbine Rotor Blade Market, By Geography (Page No. - 84)
9.1 Introduction
9.2 Market Analysis, By Region
9.3 Cumulative Wind Energy Market, By Region
9.4 Regional Overview, By Number of Blades
9.5 Middle East & Africa
9.5.1 Overview
9.5.2 Annual Wind Energy Market
9.5.3 Cumulative Wind Energy Market
9.5.4 By Country
9.5.4.1 South Africa
9.5.4.2 Others
9.6 Asia-Pacific
9.6.1 Overview
9.6.2 Annual Wind Energy Market
9.6.3 Cumulative Wind Energy Market
9.6.4 By Country
9.6.4.1 China
9.6.4.2 India
9.6.4.3 Australia
9.6.4.4 Others
9.7 Europe
9.7.1 Overview
9.7.2 Annual Wind Energy Market
9.7.3 Cumulative Wind Energy Market
9.7.4 By Country
9.7.4.1 Germany
9.7.4.2 Spain
9.7.4.3 U.K.
9.7.4.4 Others
9.8 North America
9.8.1 Overview
9.8.2 Annual Wind Energy Market
9.8.3 Cumulative Wind Energy Market
9.8.4 By Country
9.8.4.1 U.S.
9.8.4.2 Others
9.9 South America
9.9.1 Overview
9.9.2 Annual Wind Energy Market
9.9.3 Cumulative Wind Energy Market
9.9.4 By Country
9.9.4.1 Brazil
9.9.4.2 Others
10 Competitive Landscape (Page No. - 116)
10.1 Overview
10.2 Competitive Situation and Trends
10.2.1 Contracts & Agreements
10.2.2 New Product/Service Development
10.2.3 Expansions
10.2.4 Mergers & Acquisitions
10.2.5 Other Developments
11 Company Profiles (Page No. - 158)
(Company at A Glance, Recent Financials, Products & Services, Strategies & Insights, & Recent Developments)*
11.1 Introduction
11.2 China National Materials Company Limited (Sinoma)
11.3 Gamesa S.A.
11.4 General Electric Company
11.5 Siemens AG
11.6 Sinoi GMBH
11.7 Suzlon Energy Limited
11.8 Vestas Wind Systems A/S
11.9 Acciona, S.A
11.10 Enercon GMBH
11.11 Nordex S.E.
11.12 Powerblades GMBH
11.13 SGL Rotec GMBH & Co. KG (Carbon Rotec)
*Details on Company at A Glance, Recent Financials, Products & Services, Strategies & Insights, & Recent Developments Might Not Be Captured in Case of
Unlisted Companies.
12 Appendix (Page No. - 229)
12.1 Insights of Industry Experts
12.2 Discussion Guide
12.3 Introducing RT: Real Time Market Intelligence
12.4 Available Customizations
12.5 Related Reports
List of Tables (74 Tables)
Table 1 Net Electricity Generation, By Region, 2009�2013 (Terrawatt-Hours)
Table 2 Wind Energy Cumulative Installed Capacity, By Country, 2009�2013 (MW)
Table 3 Cost Benefits and Favorable Policy Structures Are Propelling the Growth of Wind Turbine Rotor Blade Market
Table 4 High Initial Investment of Wind Turbines Restrain Market Growth
Table 5 Average Annual Investment in Wind Energy Sector, ($Billion)
Table 6 Future Growth Projections for Wind Energy Generation and Repowering of Existing Projects Present Opportunities for Wind Turbine Rotor Blade Market
Table 7 Localized Regulatory Hurdles and Opposition to Wind Farms in Some Local Communities is A Challenge for Wind Energy Industry
Table 8 Characteristics of Carbon Fiber
Table 9 Characteristics of Glass Fiber
Table 10 Wind Turbine Blade Market Size, By Material, 2012�2019 ($Million)
Table 11 Wind Turbine Blade Market Size, By Blade Material, 2012�2019 (Metric Tones)
Table 12 Glass Fiber Material Market Size, By Region, 2012�2019 ($Million)
Table 13 Glass Fiber Material Market Size, By Region, 2012�2019 (Metric Tones)
Table 14 Carbon Fiber Material Market Size, By Region, 2012�2019 ($Million)
Table 15 Carbon Fiber Material Market Size, By Region, 2012�2019 (Metric Tones)
Table 16 Middle East & Africa: Wind Turbine Blade Market Size, By Material, 2012�2019 ($Million)
Table 17 Middle East & Africa: Wind Turbine Blade Market Size, By Material, 2012�2019 (Metric Tones)
Table 18 Asia-Pacific: Wind Turbine Blade Market Size, By Material, 2012�2019 ($Million)
Table 19 Asia-Pacific: Wind Turbine Blade Market Size, By Material, 2012�2019 (Metric Tones)
Table 20 Europe: Wind Turbine Blade Market Size, By Material, 2012�2019 ($Million)
Table 21 Europe: Wind Turbine Blade Market Size, By Material, 2012�2019 (Metric Tones)
Table 22 North America: Wind Turbine Blade Market Size, By Material, 2012�2019 ($Million)
Table 23 North America: Wind Turbine Blade Market Size, By Material, 2012�2019 (Metric Tones)
Table 24 South America: Wind Turbine Market Size, By Material, 2012�2019 ($Million)
Table 25 South America: Wind Turbine Blade Market Size, By Material, 2012�2019 (Metric Tones)
Table 26 Wind Turbine Blade Market Size, By Blade Length, 2012-2019 ($Million)
Table 27 Wind Turbine Blade Market Size, By Blade Length, 2012-2019 (Number of Blades)
Table 28 <27 Meter- Wind Turbine Blade Length Market Size, By Region, 2012�2019 (Number of Blades)
Table 29 27-37 Meter - Wind Turbine Blade Length Market Size, By Region, 2012�2019 (Number of Blades)
Table 30 38-50 Meter - Wind Turbine Blade Length Market Size, By Region, 2012�2019 (Number of Blades)
Table 31 >50- Wind Turbine Blade Length Market Size, By Region, 2012�2019 (Number of Blades)
Table 32 Middle East & African Wind Turbine Blade Market Size, By Blade Length, 2012�2019 (Number of Blades)
Table 33 Asia-Pacific Wind Turbine Blade Market Size, By Blade Length, 2012�2019 (Number of Blades)
Table 34 European Wind Turbine Blade Market Size, By Blade Length, 2012�2019 (Number of Blades)
Table 35 North American Wind Turbine Blade Market, By Blade Length, 2012�2019 (Number of Blades)
Table 36 South American Wind Turbine Blade Market Size, By Blade Length, 2012�2019 (Number of Blades)
Table 37 Wind Turbine Blade Market Size, By Region, 2012�2019 ($Million)
Table 38 Annual Installed Wind Energy Market Size, By Region, 2012-2019 (MW)
Table 39 Cumulative Wind Energy Market Size, By Region 2012-2019 (MW)
Table 40 Wind Turbine Blade Market Size, By Region, 2012�2019 (Number of Blades)
Table 41 Middle East and Africa: Annual Wind Energy Market Size, By Country 2012-2019 (MW)
Table 42 Middle East and Africa: Cumulative Wind Energy Market Size, By Country 2012-2019 (MW)
Table 43 Middle East and Africa: Wind Turbine Blade Market Size, By Country, 2012�2019 (Number of Blades)
Table 44 South Africa: Wind Turbine Blade Market Size, By Blade Length, 2012�2019 (Number of Blades)
Table 45 Others: Wind Turbine Blade Market Size, By Blade Length, 2012�2019 (Number of Blades)
Table 46 Asia-Pacific: Annual Wind Energy Market Size, By Countries, 2012-2019 (MW)
Table 47 Asia-Pacific: Cumulative Wind Energy Market Size, By Country 2012-2019 (MW)
Table 48 Asia-Pacific: Wind Turbine Blade Market Size, By Country, 2012-2019 (Number of Blades)
Table 49 China: Wind Turbine Blade Market Size, By Blade Length, 2012-2019 (Number of Blades)
Table 50 India: Wind Turbine Blade Market Size, By Blade Length, 2012�2019 (Number of Blades)
Table 51 Australia: Wind Turbine Blade Market Size, By Blade Length, 2012�2019 (Number of Blades)
Table 52 Others: Wind Turbine Blade Market, By Blade Length, 2012�2019 (Number of Blades)
Table 53 Europe: Annual Wind Energy Market Size, By Country, 2012-2019 (MW)
Table 54 Europe: Cumulative Wind Energy Market Size, By Country, 2012-2019 (MW)
Table 55 Europe: Wind Turbine Blade Market Size, By Blade Length, 2012�2019 (Number of Blades)
Table 56 Germany: Wind Turbine Blade Market Size, By Blade Length, 2012�2019 (Number of Blades)
Table 57 Spain: Wind Turbine Blade Market Size, By Blade Length, 2012�2019 (Number of Blades)
Table 58 U.K.: Wind Turbine Blade Market Size, By Blade Length, 2012�2019 (Number of Blades)
Table 59 Others: Wind Turbine Blade Market Size, By Blade Length, 2012�2019 (Number of Blades)
Table 60 North America: Annual Wind Energy Market Size, By Country 2012-2019 (MW)
Table 61 North America: Cumulative Wind Energy Market Size, By Country, 2012-2019 (MW)
Table 62 North America: Wind Turbine Blade Market Size, By Country, 2012�2019 (Number of Blades)
Table 63 U.S.: Wind Turbine Blade Market Size, By Blade Length, 2012�2019 (Number of Blades)
Table 64 Others: Wind Turbine Blade Market Size, By Blade Length, 2012�2019 (Number of Blades)
Table 65 South America: Annual Wind Energy Market Size, By Country, 2012-2019 (MW)
Table 66 South America: Cumulative Wind Energy Market Size, By Country, 2012-2019 (MW)
Table 67 South America: Wind Turbine Blade Market Size, By Country, 2012�2019 (Number of Blades)
Table 68 Brazil: Wind Turbine Blade Market Size, By Blade Length, 2012�2019 (Number of Blades)
Table 69 Others: Wind Turbine Blade Market Size, By Blade Length, 2012�2019 (Number of Blades)
Table 70 Contracts & Agreements, 2012-2014
Table 71 New Product/Service Development, 2012-2014
Table 72 Expansions, 2012-2014
Table 73 Mergers & Acquisitions, 2012-2014
Table 74 Other Developments, 2012-2014
List of Figures (66 Figures)
Figure 1 Wind Turbine Rotor Blade Markets Covered
Figure 2 Wind Turbine Rotor Blade Market: Research Design
Figure 3 Breakdown of Primary Sources: By Company Type, Designation, and Region
Figure 4 Market Size Estimation Methodology: Bottom-Up Approach
Figure 5 Market Size Estimation Methodology: Top-Down Approach
Figure 6 Data Triangulation Methodology
Figure 7 Market for 27-37 Meter Blades to Grow at Fastest Pace During 2014-2019
Figure 8 The 38-50 Meter Blade Market is the Most Attractive Investment Option for the Next Five Years
Figure 9 Asia-Pacific is the Leading Wind Turbine Rotor Blade Market, 2013
Figure 10 Trend of Increasing Blade Lengths to Continue Till 2019
Figure 11 Use of Carbon Fiber in Blade Manufacture to Increase at A Higher Rate Between, 2014-2019
Figure 12 Contracts and Agreements: Top Drivers of Growth for Wind Turbine Rotor Blade Companies, 2011-2014
Figure 13 China and Germany Most Lucrative Among Top Country Markets, 2014-2019
Figure 14 Offshore Wind Power Generation Offer Lucrative Opportunity
Figure 15 The Demand for Blade Length Between 38-50 Meters Will Be Highest
Figure 16 China Expected to Capture the Lion�s Share in the Asia-Pacific Market
Figure 17 Asia-Pacific to Remain the Largest and Fastest Growing Market, Due to Decline in the U.S., and Europe Market
Figure 18 Developing Economies Are Growing Fast
Figure 19 Major Share of the Total Market Growth Would Come From Rotor Blade With Average Length Between 38-50 Meters ,Between 2014�2019
Figure 20 China to Have the Largest Share in Emerging Economies of the Asia-Pacific Region
Figure 21 Market in India and China Soon to Enter Exponential Growth Phase During the forecast Period
Figure 22 Annual New Wind Energy Installed Capacity, By Top 10 Countries, 2012�2013 (MW)
Figure 23 Market Evolution: Wind Turbine Rotor Blades Have Been Larger in Size During the Last Two Decades
Figure 24 Market Segmentation of Wind Turbine Rotor Blade Market
Figure 25 Wind Turbine Rotor Blade Market, By Materials
Figure 26 Wind Turbine Rotor Blade Market, By Blade Length
Figure 27 Wind Turbine Rotor Blade Market, By Region
Figure 28 Market Dynamics of Wind Turbine Rotor Blade
Figure 29 Projections for Repowering Demand, Annual and Cumulative (MW)
Figure 30 Value Chain Analysis: Major Value is Added During Manufacture and Installation Phase
Figure 31 Wind Turbine Rotor Blade: Porter�s Five forces Analysis
Figure 32 Wind Turbine Blade Market Share (Value), By Material, 2013
Figure 33 Global Wind Turbine Blade Market Share (Volume), By Blade Length, 2013
Figure 34 Wind Turbine Blade Market, 2012-2019 (No. of Blades)
Figure 35 Annual Installed Wind Energy Market Share, By Region, 2013
Figure 36 Middle East & African Annual Wind Energy Market Share By Country, 2013
Figure 37 Asia-Pacific Annual Wind Energy Market Share By Country, 2013
Figure 38 Europe Annual Wind Energy Market Share (Volume) By Country, 2013
Figure 39 North American Annual Wind Energy Market Share, By Country, 2013
Figure 40 South American Annual Wind Energy Market Share, By Country, 2013
Figure 41 Companies Adopted Contracts & Agreements as the Key Growth Strategy Over the Last Three Years
Figure 42 Siemens Grew at the Highest Rate Between 2010-2013
Figure 43 Wind Turbine Rotor Blade Market Share: Top 4 Companies vs. Others in 2013
Figure 44 Battle for Market Share: Contracts and Agreements is the Key Strategy
Figure 45 Market Evolution Framework � Significant Contracts & Agreements Has Fueled Growth in 2012 to 2014
Figure 46 Geographic Revenue Mix of the Top 5 Market Players
Figure 47 Sinoma: Business Overview
Figure 48 China National Materials Company Limited (Sinoma): SWOT Analysis
Figure 49 Gamesa S.A.: Company Snapshot
Figure 50 Gamesa S.A.: SWOT Analysis
Figure 51 General Electric: Company Snapshot
Figure 52 General Electric: SWOT Analysis
Figure 53 Siemens AG: Company Snapshot
Figure 54 Siemens AG: SWOT Analysis
Figure 55 Sinoi GMBH: Company Snapshot
Figure 56 Sinoi GMBH: SWOT Analysis
Figure 57 Suzlon Energy Limited: Company Snapshot
Figure 58 Suzlon Energy Limited: SWOT Analysis
Figure 59 Vestas Wind Systems A/S: Company Snapshot
Figure 60 Vestas Wind Systems A/S: SWOT Analysis
Figure 61 Acciona SA: Company Snapshot
Figure 62 Acciona SA: SWOT Analysis
Figure 63 Enercon GMBH: Company Snapshot
Figure 64 Nordex SE: Company Snapshot
Figure 65 Powerblades GMBH: Company Snapshot
Figure 66 SGL: Company Snapshot


Growth opportunities and latent adjacency in Wind Turbine Rotor Blade Market