Glass & Specialty Synthetic Fiber Market by Fiber Type (Glass, Carbon, Aramid, UHMWPE, PPS), Application (Composite, Non-Composite), End-Use Industry, and Region (North America, Europe, APAC,MEA, Latin America) - Global Forecast to 2024


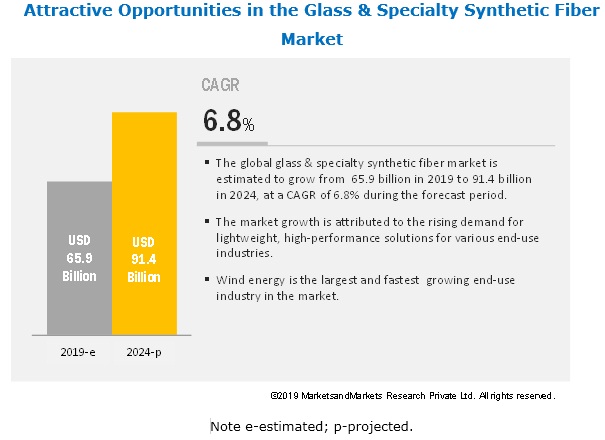
The glass & specialty synthetic fibers market is projected to reach USD 517 million by 2025, at a CAGR of 5.0%. The glass & specialty synthetic fiber market is increasing due to the rise in the demand for high-performance materials, globally.
The glass fiber to account for a significant market share, in terms of value and volume, during the forecast period
Glass fibers are expected to dominate the overall market in terms of volume and value during the next five years. The glass fibers are high in demand as they are low cost and have superior physical & mechanical properties such as strength, durability, flexibility, stability, and lightweight. The normal E-glass fibers are used mostly in wind energy, pipes & tanks, electrical & electronics, and construction & infrastructure industries. High strength glass is such as R, S, S-2, advances, among others, are used in aerospace & defense, automotive & transportation, and wind energy industries.
Composite application is expected to account for a major share of the glass & specialty synthetic fiber market in terms of value and volume during the forecast period.
Composite application would lead to the market between 2019 and 2024. When these fibers are combined with a matrix, the resulting material is termed composite. The use of fibers in composites offers superior performance properties compared to traditional metals. These properties include micro-cracking resistance, good tensile strength, electrical conductivity, high strength-to-weight ratio, and fatigue resistance. There is a huge demand for glass, carbon, aramid, and UHMWPE fibers based composites in aerospace & defense, automotive & transportation, wind energy, and glass & pipes industries.
The wind energy end-use industry is expected to have the largest share in the glass & specialty synthetic fiber market in terms of volume.
In terms of volume, the wind energy is projected to hold the largest share during the forecast period. Glass & specialty synthetic fibers have a high demand in the manufacture of wind turbine blades, nacelle, and hubs. Many companies are investing in the production of composites for the wind energy industry. For instance, in July 2017, LM Wind Power (GE Renewable Energy business and leading designer and manufacturer of wind turbine blades) begun their production of wind turbine blades at a new factory in Bergama, Turkey.

APAC to hold the largest market share in the glass & specialty synthetic fiber market.
APAC is estimated to be the largest market in the glass & specialty synthetic fiber market owing to the growing economies of China and India, the presence of prominent players, and expanding transportation, wind energy, and construction & infrastructure industries. In APAC, China is projected to grow at the fastest rate during the forecast period. It is the largest market for glass fibers in APAC. The economic growth of the nation is the main factor for the high consumption of glass fibers. The automotive & transportation and construction & infrastructure industries are rapidly expanding in the country, thereby driving the demand for glass & specialty synthetic fiber market.
Key Players in Glass & Specialty Synthetic Fiber Market
The key players in the global composites market Owens Corning (US), Toray Industries, Inc. (Japan), Teijin Limited (Japan), Mitsubishi Chemical Holdings Corporation (Japan), Hexcel Corporation (US), SGL Group (Germany), Nippon Electrical Glass Co. Ltd. (Japan), DSM (Netherland), Honeywell International, Inc. (US), Jushi Group Co., Ltd. (China), among others. These companies are involved in adopting various inorganic and organic strategies to increase their foothold in the composites industry. The study includes an in-depth competitive analysis of these key players in the composites market, with their company profiles, recent developments, and key market strategies.
Glass & Specialty Synthetic Fiber Market Report Scope
|
Report Metric |
Details |
|
Years Considered for the study |
2019–2024 |
|
Base year |
2018 |
|
Forecast period |
2019–2024 |
|
Units considered |
Value (USD Million), Volume (Kiloton) |
|
Segments |
Fiber Type, Application, End-use Industry and Region |
|
Regions |
Europe, North America, APAC, MEA, and Latin America |
|
Companies |
Owens Corning (US), Toray Industries, Inc. (Japan), Teijin Limited (Japan), Mitsubishi Chemical Holdings Corporation (Japan), Hexcel Corporation (US), SGL Group (Germany), Nippon Electrical Glass Co. Ltd. (Japan), DSM (Netherland), Honeywell international, Inc. (US), Jushi Group Co., Ltd. (China), among others. |
This research report categorizes the glass & specialty synthetic fiber market based on fiber type, resin type, manufacturing process, end-use industry, and region.
By Fiber Type:
- Glass
- Carbon
- Aramid
- Ultra-High Molecular Weight Polyethylene (UHMWPE) Fibers
- Polyphenylene Sulfide (PPS) Fibers
- Other Fibers
By Application:
- Composite
- Non-Composite
By End-use industry:
- Aerospace & defense
- Wind Energy
- Transportation
- Construction & Infrastructure
- Marine
- Pipe & Tank
- Electrical & Electronics
- Protective Clothing
- Others
By region:
- North America
- Europe
- APAC
- MEA
- Latin America
Recent Developments
- In July 2019, Teijin signed an agreement with AEV Robotics (Australia) to co-develop lightweight automotive solutions for future transportation. These automotive solutions would use Teijin's high-performance carbon and aramid fibers.
- In November 2019, Honeywell International, Inc. increased the production capacity of its Spectra fiber PE to meet the demands of the defense industry for high-performing and lightweight armors.
- In April 2018, Toray expanded the large tow carbon fiber production capacity at its US-based subsidiary, Zoltek Companies, Inc. They are also planning to increase the production capacity of Zoltek’s Hungarian and Mexican facilities. This will lead to Zoltek’s total annual production capacity of approximately 25,000 tons.
- In November 2017, Nippon Electrical Glass Co. Ltd. expanded its production capacity of glass fiber in its subsidiary in the Netherlands and the US, which is used for the reinforcement of high functional thermoplastic resins for automotive applications.
- In November 2018, Toray developed a new higher tensile strength and tensile modulus carbon fiber named TORAYCA MX series. This carbon fiber is mainly for aerospace, industrial, and sports applications.
- In April 2019, Teijin limited expanded the production of carbon fibers in China and Taiwan by establishing Teijin Carbon Shanghai Co., Ltd. in Shanghai and Teijin Carbon Taiwan Inc.
Key Questions Addressed By The Report
- Which are the major end-use industries of glass & specialty synthetic fiber?
- Which industry is the major consumer of glass & specialty synthetic fiber?
- Which region is the largest and fastest-growing market for glass & specialty synthetic fiber?
- What are the significant types of glass & specialty synthetic fiber?
- What are the major end-use industries of glass & specialty synthetic fiber?
- What are the major strategies adopted by leading market players?
To speak to our analyst for a discussion on the above findings, click Speak to Analyst
 Exclusive indicates content/data unique to MarketsandMarkets and not available with any competitors.
Table of Contents
1 Introduction (Page No. - 20)
1.1 Objectives of the Study
1.2 Market Definition
1.3 Market Scope
1.3.1 Market Segmentation
1.3.2 Regions Covered
1.3.3 Years Considered for the Study
1.4 Currency
1.5 Unit Considered
1.6 Stakeholders
2 Research Methodology (Page No. - 24)
2.1 Research Data
2.1.1 Secondary Data
2.1.1.1 Key Data From Secondary Sources
2.1.2 Primary Data
2.1.2.1 Key Data From Primary Sources
2.1.2.2 Key Industry Insights
2.1.2.3 Breakdown of Primary Interviews
2.2 Market Size Estimation
2.2.1 Supply Side Analysis
2.2.2 Segment Analysis
2.2.3 Forecast
2.3 Data Triangulation
2.4 Assumptions
2.5 Limitations
3 Executive Summary (Page No. - 31)
4 Premium Insights (Page No. - 34)
4.1 Attractive Opportunities in the Glass & Specialty Synthetic Fiber Market
4.2 Glass & Specialty Synthetic Fiber Market, By Fiber Type and Region
4.3 Glass & Specialty Synthetic Fiber Market, By End-Use Industry
4.4 Glass & Specialty Synthetic Fiber Market, By Application
4.5 Glass & Specialty Synthetic Fiber Market, By Key Countries
5 Market Overview (Page No. - 37)
5.1 Market Dynamics
5.1.1 Drivers
5.1.1.1 Increasing Demand for Advanced Materials in Renewable Energy Sector
5.1.1.2 High Demand From Automotive, Aerospace, and Marine Industries
5.1.1.2.1 Automotive Industry
5.1.1.2.2 Aerospace Industry
5.1.1.2.3 Marine Industry
5.1.1.3 Growing Demand for Optical Fiber Cables and Electronics
5.1.2 Restraints
5.1.2.1 High Production Costs
5.1.2.2 Issues Related to Recycling
5.1.2.3 Lack of R&D Investments on Specialty Synthetic Fibers
5.1.3 Opportunities
5.1.3.1 High Demand for Glass Fibers Pipes in Emerging Economies
5.1.3.2 Increasing Demand for Glass Fibers From Construction & Infrastructure Industry in the MEA
5.1.4 Challenges
5.1.4.1 Developing Low-Cost Fibers
5.2 Porter’s Five Forces Analysis
5.2.1 Bargaining Power of Suppliers
5.2.2 Bargaining Power of Buyers
5.2.3 Threat of Substitutes
5.2.4 Threat of New Entrants
5.2.5 Intensity of Rivalry
6 Macroeconomic Overview and Key Trends (Page No. - 44)
6.1 Introduction
6.2 Trends and Forecast of GDP
6.3 Per Capita GDP vs. Per Capita Glass & Specialty Synthetic Fiber Materials Demand
6.4 Trends in Wind Energy Industry
6.5 Trends in Aerospace Industry
6.6 Trends in Automotive Industry
6.7 Trends in Construction Industry
7 Glass & Specialty Synthetic Fiber Market, By Fiber Type (Page No. - 52)
7.1 Introduction
7.2 Glass Fiber
7.3 Specialty Synthetic Fibers
7.3.1 Carbon Fiber
7.3.2 Aramid Fiber
7.3.2.1 Para Aramid Fiber
7.3.2.2 Meta Aramid Fiber
7.3.3 Uhmwpe Fiber
7.3.4 PPS Fiber
7.3.5 Other Fibers
7.3.5.1 PBO Fiber
7.3.5.2 PBI Fiber
7.3.5.3 Vectran
8 Global Glass & Specialty Synthetic Fiber Market, By Application (Page No. - 63)
8.1 Introduction
8.2 Composite
8.3 Non-Composite
9 Glass & Specialty Synthetic Fiber Market, By End-Use Industry (Page No. - 67)
9.1 Introduction
9.2 Aerospace & Defense
9.3 Wind Energy
9.4 Automotive & Transportation
9.5 Construction & Infrastructure
9.6 Marine
9.7 Pipes & Tanks
9.8 Electrical & Electronics
9.9 Protective Clothing
9.10 Others
10 Glass & Specialty Synthetic Market, By Region (Page No. - 83)
10.1 Introduction
10.2 North America
10.2.1 North America: Glass & Specialty Synthetic Fiber Market, By End-Use Industry
10.2.2 North America: Glass & Specialty Synthetic Fiber Market, By Country
10.2.2.1 US
10.2.2.1.1 US: Glass & Specialty Synthetic Fiber Market, By End-Use Industry
10.2.2.2 Canada
10.2.2.2.1 Canada: Glass & Specialty Synthetic Fiber Market, By End-Use Industry
10.3 Europe
10.3.1 Europe: Glass & Specialty Synthetic Fiber Market, By End-Use Industry
10.3.2 Europe: Glass & Specialty Synthetic Fiber Market, By Country
10.3.2.1 Germany
10.3.2.1.1 Germany: Glass & Specialty Synthetic Fiber Market, By End-Use Industry
10.3.2.2 France
10.3.2.2.1 France: Glass & Specialty Synthetic Fiber Market, By End-Use Industry
10.3.2.3 UK
10.3.2.3.1 UK: Glass R & Specialty Synthetic Fiber Market, By End-Use Industry
10.3.2.4 Italy
10.3.2.4.1 Italy: Glass & Specialty Synthetic Fiber Market, By End-Use Industry
10.3.2.5 Spain
10.3.2.5.1 Spain: Glass & Specialty Synthetic Fiber Market, By End-Use Industry
10.3.2.6 Russia
10.3.2.6.1 Russia: Glass & Specialty Synthetic Fiber Market, By End-Use Industry
10.3.2.7 Rest of Europe
10.3.2.7.1 Rest of Europe: Glass & Specialty Synthetic Fiber Market, By End-Use Industry
10.4 APAC
10.4.1 APAC: Glass & Specialty Synthetic Fiber Market, By End-Use Industry
10.4.2 APAC: Glass & Specialty Synthetic Fiber Market, By Country
10.4.2.1 China
10.4.2.1.1 China: Glass & Specialty Synthetic Fiber Market, By End-Use Industry
10.4.2.2 Japan
10.4.2.2.1 Japan: Glass & Specialty Synthetic Fiber Market, By End-Use Industry
10.4.2.3 India
10.4.2.3.1 India: Glass & Specialty Synthetic Fiber Market, By End-Use Industry
10.4.2.4 South Korea
10.4.2.4.1 South Korea: Glass & Specialty Synthetic Fiber Market, By End-Use Industry
10.4.2.5 Rest of APAC
10.4.2.5.1 Rest of APAC: Glass & Specialty Synthetic Fiber Market, By End-Use Industry
10.5 Middle East & Africa (MEA)
10.5.1 MEA: Glass & Specialty Synthetic Fiber Market, By End-Use Industry
10.5.2 MEA: Glass & Specialty Synthetic Fiber Market, By Country
10.5.2.1 Uae
10.5.2.1.1 Uae: Glass & Specialty Synthetic Fiber Market, By End-Use Industry
10.5.2.2 South Africa
10.5.2.2.1 South Africa: Glass & Specialty Synthetic Fiber Market, By End-Use Industry
10.5.2.3 Rest of MEA
10.5.2.3.1 Rest of MEA: Glass & Specialty Synthetic Fiber Market, By End-Use Industry
10.6 Latin America
10.6.1 Latin America: Glass & Specialty Synthetic Fiber Market, By End-Use Industry
10.6.2 Latin America: Glass & Specialty Synthetic Fiber Market, By Country
10.6.2.1 Brazil
10.6.2.1.1 Brazil: Glass & Specialty Synthetic Market, By End-Use Industry
10.6.2.2 Mexico
10.6.2.2.1 Mexico: Glass & Specialty Synthetic Fiber Market, By End-Use Industry
10.6.2.3 Rest of Latin America
10.6.2.3.1 Rest of Latin America: Glass & Specialty Synthetic Fiber Market, By End-Use Industry
11 Competitive Landscape (Page No. - 125)
11.1 Introduction
11.2 Competitive Leadership Mapping
11.2.1 Visionary Leaders
11.2.2 Dynamic Differentiators
11.2.3 Emerging Companies
11.2.4 Innovators
11.2.5 Strength of Product Portfolio
11.2.6 Business Strategy Excellence
11.3 Market Ranking
11.4 Competitive Scenario
11.4.1 Agreement
11.4.2 Expansion
11.4.3 New Product/Technology Launch
11.4.4 Partnership
11.4.5 Merger & Acquisition and Collaboration
11.4.6 Joint Venture
12 Company Profiles (Page No. - 139)
(Business Overview, Products Offered, Recent Developments, SWOT Analysis, MnM View Winning Imperatives, Current Focus and Strategies, Threat From Competition, Owens Corning Right to Win)*
12.1 Owens Corning
12.2 Toray Industries, Inc.
12.3 Teijin Limited
12.4 Mitsubishi Chemical Holdings Corporation
12.5 Hexcel Corporation
12.6 SGL Group
12.7 Nippon Electric Glass Co. Ltd.
12.8 Honeywell International Inc.
12.9 DSM
12.10 E. I. Du Pont Nemours & Co.
12.11 Chongqing Polycomp International Corporation
12.12 Jushi Group Co., Ltd.
12.13 Taishan Fiberglass Inc. (CTG)
12.14 Other Players
12.14.1 AGY
12.14.2 Kuraray Co., Ltd.
12.14.3 PBI Performance Products, Inc.
12.14.4 Toyobo Co., Ltd.
12.14.5 Solvay
12.14.6 Huvis
12.14.7 3B Fiberglass
*Details on Business Overview, Products Offered, Recent Developments, SWOT Analysis, MnM View Winning Imperatives, Current Focus and Strategies, Threat From Competition, Owens Corning Right to Win Might Not Be Captured in Case of Unlisted Companies.
13 Appendix (Page No. - 181)
13.1 Discussion Guide
13.2 Knowledge Store: Marketsandmarkets Subscription Portal
13.3 Available Customizations
13.4 Related Reports
13.5 Author Details
List of Tables (133 Tables)
Table 1 European Union: Co2 Emission Standards for New Passenger Cars (G/Km)
Table 2 Trends and Forecast of GDP, 2017–2024 (USD Billion)
Table 3 Per Capita GDP vs. Per Capita Demand for Glass & Specialty Synthetic Fibers, 2019
Table 4 Wind Energy Installation, Mw (2017–2018)
Table 5 New Airplane Deliveries, 2019–2038
Table 6 Automotive Production, Million Units (2014–2018)
Table 7 North America: Contribution of Construction Industry to GDP, By Country, 2017–2024 (USD Billion)
Table 8 Europe: Contribution of Construction Industry to GDP, By Country, 2017–2024 (USD Billion)
Table 9 APAC: Contribution of Construction Industry to GDP, By Country, 2017–2024 (USD Billion)
Table 10 MEA: Contribution of Construction Industry to GDP, By Country, 2017–2024 (USD Billion)
Table 11 Latin America: Contribution of Construction Industry to GDP, By Country, 2017–2024 (USD Billion)
Table 12 Glass & Specialty Synthetic Fiber Market Size, By Fiber Type, 2017–2024 (USD Million)
Table 13 Glass & Specialty Synthetic Fiber Market Size, By Fiber Type, 2017–2024 (Kiloton)
Table 14 Glass Fiber Market Size, By Region, 2017–2024 (USD Million)
Table 15 Glass Fiber Market Size, By Region, 2017-2024 (Kiloton)
Table 16 Carbon Fiber Market Size, By Region, 2017–2024 (USD Million)
Table 17 Carbon Fiber Market Size, By Region, 2017-2024 (Kiloton)
Table 18 Physical Properties of Aramid Fibers
Table 19 Aramid Fiber Market Size, By Region, 2017–2024 (USD Million)
Table 20 Aramid Fiber Market Size, By Region, 2017-2024 (Kiloton)
Table 21 Uhmwpe Market Size, By Region, 2017–2024 (USD Million)
Table 22 Uhmwpe Market Size, By Region, 2017–2020 (Kiloton)
Table 23 PPS Fiber Market Size, By Region, 2017–2024 (USD Million)
Table 24 PPS Fiber Market Size, By Region, 2017–2024 (Kiloton)
Table 25 Other Fibers Market Size, By Region, 2017–2020 (USD Million)
Table 26 Other Fibers Market Size, By Region, 2017–2020 (Kiloton)
Table 27 Glass & Specialty Synthetic Fiber Market Size, By Application, 2017–2024 (USD Million)
Table 28 Glass & Specialty Synthetic Fiber Market Size , By Application, 2017–2024 (Kiloton)
Table 29 Composite: Glass & Specialty Synthetic Fiber Market Size, By Region, 2017–2024 (USD Million)
Table 30 Composite: Glass & Specialty Synthetic Fiber Market Size, By Region, 2017-2024 (Kiloton)
Table 31 Non-Composite: Glass & Specialty Synthetic Fiber Market Size, By Region, 2017–2024 (USD Million)
Table 32 Non-Composite: Glass & Specialty Synthetic Fiber Market Size, By Region, 2017–2024 (Kiloton)
Table 33 Glass & Specialty Synthetic Fiber Market Size, By End-Use Industry, 2017–2024 (USD Million)
Table 34 Glass & Specialty Synthetic Fiber Market Size, By End-Use Industry, 2017–2024 (Kiloton)
Table 35 Number of New Commercial Airplane Deliveries, By Region (2019–2038)
Table 36 Carbon Fiber Consumption Per Aircraft, 2018 (Ton)
Table 37 Trend of Key Carbon Fiber Consumption in Commercial Aircraft Production (2017–2024)
Table 38 Glass & Specialty Synthetic Fiber Market Size in Aerospace & Defense, By Region, 2017–2024 (USD Million)
Table 39 Glass & Specialty Synthetic Fiber Market Size in Aerospace & Defense, By Region, 2017–2024 (Kiloton)
Table 40 Breakdown of Materials Used in Wind Blade Manufacturing
Table 41 Glass & Specialty Synthetic Fiber Market Size in Wind Energy, By Region, 2017–2024 (USD Million)
Table 42 Glass & Specialty Synthetic Fiber Market Size in Wind Energy, By Region, 2017–2024 (Kiloton)
Table 43 Cost Benefits of Carbon Fiber Composite Parts Over Steel Parts
Table 44 Glass & Specialty Synthetic Fiber Market Size in Automotive & Transportation, By Region, 2017–2024 (USD Million)
Table 45 Glass & Specialty Synthetic Fiber Market Size in Automotive & Transportation, By Region, 2017–2024 (Kiloton)
Table 46 Units of Electric Vehicles Sold, By Country (2015–2018)
Table 47 Glass & Specialty Synthetic Fiber Market Size in Construction & Infrastructure, By Region, 2017–2024 (USD Million)
Table 48 Glass & Specialty Synthetic Fiber Market Size in Construction & Infrastructure, By Region, 2017–2024 (Kiloton)
Table 49 Glass & Specialty Synthetic Fiber Market Size in Marine, By Region, 2017–2024 (USD Million)
Table 50 Glass & Specialty Synthetic Fiber Market Size in Marine, By Region, 2017–2024 (Kiloton)
Table 51 Glass & Specialty Synthetic Fiber Market Size in Pipes & Tanks, By Region, 2017–2024 (USD Million)
Table 52 Glass & Specialty Synthetic Fiber Market Size in Pipes & Tanks, By Region, 2017–2024 (Kiloton)
Table 53 Glass & Specialty Synthetic Fiber Market Size in Electrical & Electronics, By Region, 2017–2024 (USD Million)
Table 54 Glass & Specialty Synthetic Fiber Market Size in Electrical & Electronics, By Region, 2017–2024 (Kiloton)
Table 55 Glass & Specialty Synthetic Fiber Market Size in Protective Clothing, By Region, 2017–2024 (USD Million)
Table 56 Glass & Specialty Synthetic Fiber Market Size in Protective Clothing, By Region, 2017–2024 (Kiloton)
Table 57 Glass & Specialty Synthetic Fiber Market Size in Other End-Use Industries, By Region, 2017–2024 (USD Million)
Table 58 Glass & Specialty Synthetic Fiber Market Size in Other End-Use Industries, By Region, 2017–2024 (Kiloton)
Table 59 Glass & Specialty Synthetic Fiber Market Size, By Region, 2017–2024 (USD Million)
Table 60 Glass & Specialty Synthetic Fiber Market Size, By Region, 2017–2024 (Kiloton)
Table 61 North America: Glass & Specialty Synthetic Fiber Market Size, By End-Use Industry, 2017–2024 (USD Million)
Table 62 North America: Glass & Specialty Synthetic Fiber Market Size, By End-Use Industry, 2017–2024 (Kiloton)
Table 63 North America: Glass & Specialty Synthetic Fiber Market Size, By Country, 2017–2024 (USD Million)
Table 64 North America: Glass & Specialty Synthetic Fiber Market Size, By Country, 2017–2024 (Kiloton)
Table 65 US: Glass & Specialty Synthetic Fiber Market Size, By End-Use Industry, 2017–2024 (USD Million)
Table 66 US: Glass & Specialty Synthetic Fiber Market Size, By End-Use Industry, 2017–2024 (Kiloton)
Table 67 Canada: Glass & Specialty Synthetic Fiber Market Size, By End-Use Industry, 2017–2024 (USD Million)
Table 68 Canada: Glass & Specialty Synthetic Fiber Market Size, By End-Use Industry, 2017–2024 (Kiloton)
Table 69 Europe: Glass & Specialty Synthetic Fiber Market Size, By End-Use Industry, 2017–2024 (USD Million)
Table 70 Europe: Glass & Specialty Synthetic Fiber Market Size, By End-Use Industry, 2017–2024 (Kiloton)
Table 71 Europe: Glass & Specialty Synthetic Fiber Market Size, By Country, 2017–2024 (USD Million)
Table 72 Europe: Glass & Specialty Synthetic Fiber Market Size, By Country, 2017–2024 (Kiloton)
Table 73 Germany: New Wind Energy Installations, 2010–2018 (Mw)
Table 74 Germany: Glass & Specialty Synthetic Fiber Market Size, By End-Use Industry, 2017–2024 (USD Million)
Table 75 Germany: Glass & Specialty Synthetic Fiber Market Size, By End-Use Industry, 2017–2024 (Kiloton)
Table 76 France: Glass & Specialty Synthetic Fiber Market Size, By End-Use Industry, 2017–2024 (USD Million)
Table 77 France: Glass & Specialty Synthetic Fiber Market Size, By End-Use Industry, 2017–2024 (Kiloton)
Table 78 UK: Glass & Specialty Synthetic Fiber Market Size, By End-Use Industry, 2017–2024 (USD Million)
Table 79 UK: Glass & Specialty Synthetic Fiber Market Size, By End-Use Industry, 2017–2024 (Kiloton)
Table 80 Italy: Glass & Specialty Synthetic Fiber Market Size, By End-Use Industry, 2017–2024 (USD Million)
Table 81 Italy: Glass & Specialty Synthetic Fiber Market Size, By End-Use Industry, 2017–2024 (Kiloton)
Table 82 Spain: Glass & Specialty Synthetic Fiber Market Size, By End-Use Industry, 2017–2024 (USD Million)
Table 83 Spain: Glass & Specialty Synthetic Fiber Market Size, By End-Use Industry, 2017–2024 (Kiloton)
Table 84 Russia: Glass & Specialty Synthetic Fiber Market Size, By End-Use Industry, 2017–2024 (USD Million)
Table 85 Russia: Glass & Specialty Synthetic Fiber Market Size, By End-Use Industry, 2017–2024 (Kiloton)
Table 86 Rest of Europe: Glass & Specialty Synthetic Fiber Market Size, By End-Use Industry, 2017–2024 (USD Million)
Table 87 Rest of Europe: Glass & Specialty Synthetic Fiber Market Size, By End-Use Industry, 2017–2024 (Kiloton)
Table 88 APAC: Glass & Specialty Synthetic Fiber Market Size, By End-Use Industry, 2017–2024 (USD Million)
Table 89 APAC: Glass & Specialty Synthetic Fiber Market Size, By End-Use Industry, 2017–2024 (Kiloton)
Table 90 APAC: Glass & Specialty Synthetic Fiber Market Size, By Country, 2017–2024 (USD Million)
Table 91 APAC: Glass & Specialty Synthetic Fiber Market Size, By Country, 2017–2024 (Kiloton)
Table 92 China: New Wind Energy Installations, 2010–2018 (Mw)
Table 93 China: Glass & Specialty Synthetic Fiber Market Size, By End-Use Industry, 2017–2024 (USD Million)
Table 94 China: Glass & Specialty Synthetic Fiber Market Size, By End-Use Industry, 2017–2024 (Kiloton)
Table 95 Japan: Glass & Specialty Synthetic Fiber Market Size, By End-Use Industry, 2017–2024 (USD Million)
Table 96 Japan: Glass & Specialty Synthetic Fiber Market Size, By End-Use Industry, 2017–2024 (Kiloton)
Table 97 India: New Wind Energy Installations, 2010–2018 (Mw)
Table 98 India: Glass & Specialty Synthetic Fiber Market Size, By End-Use Industry, 2017–2024 (USD Million)
Table 99 India: Glass & Specialty Synthetic Fiber Market Size, By End-Use Industry, 2017–2024 (Kiloton)
Table 100 South Korea: Glass & Specialty Synthetic Fiber Market Size, By End-Use Industry, 2017–2024 (USD Million)
Table 101 South Korea: Glass & Specialty Synthetic Fiber Market Size, By End-Use Industry, 2017–2024 (Kiloton)
Table 102 Rest of APAC: Glass & Specialty Synthetic Fiber Market Size, By End-Use Industry, 2017–2024 (USD Million)
Table 103 Rest of APAC: Glass & Specialty Synthetic Fiber Market Size, By End-Use Industry, 2017–2024 (Kiloton)
Table 104 MEA: Glass & Specialty Synthetic Fiber Market Size, By End-Use Industry, 2017–2024 (USD Million)
Table 105 MEA: Glass & Specialty Synthetic Fiber Market Size, By End-Use Industry, 2017–2024 (Kiloton)
Table 106 MEA: Glass & Specialty Synthetic Fiber Market Size, By Country, 2017–2024 (USD Million)
Table 107 MEA: Glass & Specialty Synthetic Fiber Market Size, By Country, 2017–2024 (Kiloton)
Table 108 Uae: Glass & Specialty Synthetic Fiber Market Size, By End-Use Industry, 2017–2024 (USD Million)
Table 109 Uae: Glass & Specialty Synthetic Fiber Market Size, By End-Use Industry, 2017–2024 (Kiloton)
Table 110 South Africa: Glass & Specialty Synthetic Fiber Market Size, By End-Use Industry, 2017–2024 (USD Million)
Table 111 South Africa: Glass & Specialty Synthetic Fiber Market Size, By End-Use Industry, 2017–2024 (Kiloton)
Table 112 Rest of MEA: Glass & Specialty Synthetic Fiber Market Size, By End-Use Industry, 2017–2024 (USD Million)
Table 113 Rest of MEA: Glass & Specialty Synthetic Fiber Market Size, By End-Use Industry, 2017–2024 (Kiloton)
Table 114 Latin America: Glass & Specialty Synthetic Fiber Market Size, By End-Use Industry, 2017–2024 (USD Million)
Table 115 Latin America: Glass & Specialty Synthetic Fiber Market Size, By End-Use Industry, 2017–2024 (Kiloton)
Table 116 Latin America: Glass & Specialty Synthetic Fiber Market Size, By Country, 2017–2024 (USD Million)
Table 117 Latin America: Glass & Specialty Synthetic Fiber Market Size, By Country, 2017–2024 (Kiloton)
Table 118 Brazil: New Wind Energy Installations, 2010–2018(Mw)
Table 119 Brazil: Glass & Specialty Synthetic Fiber Market Size, By End-Use Industry, 2017–2024 (USD Million)
Table 120 Brazil: Glass & Specialty Synthetic Fiber Market Size, By End-Use Industry, 2017–2024 (Kiloton)
Table 121 Mexico: Glass & Specialty Synthetic Fiber Market Size, By End-Use Industry, 2017–2024 (USD Million)
Table 122 Mexico: Glass & Specialty Synthetic Fiber Market Size, By End-Use Industry, 2017–2024 (Kiloton)
Table 123 Rest of Latin America: Glass & Specialty Synthetic Fiber Market Size, By End-Use Industry, 2017–2024 (USD Million)
Table 124 Rest of Latin America: Glass & Specialty Synthetic Fiber Market Size, By End-Use Industry, 2017–2024 (Kiloton)
Table 125 Agreement, 2014–2019
Table 126 Expansion, 2014-2019
Table 127 New Product/Technology Launch, 2014-2019
Table 128 Partnership, 2014-2019
Table 129 Merger & Acquisition and Collaboration, 2014-2019
Table 130 Joint Venture, 2014-2019
Table 131 Wallet Share of Owens Corning From Business Revenue Mix
Table 132 Major Manufacturing Plants Location
Table 133 Key Customers
List of Figures (45 Figures)
Figure 1 Glass & Specialty Synthetic Fiber Market: Research Design
Figure 2 Market Number Estimation
Figure 3 Glass & Specialty Synthetic Fiber Market Size Calculation Methodology
Figure 4 Glass & Specialty Synthetic Fiber Market: Data Triangulation
Figure 5 Glass Fiber Segment Led the Overall Market in 2018
Figure 6 Composite Segment Accounted for Larger Market Share in 2018
Figure 7 Aerospace & Defense Accounted for the Largest Market Share in 2018
Figure 8 APAC to Be Fastest-Growing Glass & Specialty Synthetic Fiber Market
Figure 9 High Demand From Wind Industry to Drive the Market
Figure 10 APAC Accounted for the Largest Share in 2018
Figure 11 Wind Energy Segment to Register the Highest CAGR
Figure 12 Composite Segment Dominates the Overall Market
Figure 13 China to Register the Highest CAGR During the Forecast Period
Figure 14 Glass & Specialty Synthetic Fiber: Porter’s Five Forces Analysis
Figure 15 Trends and Forecast of GDP, 2019–2024 (USD Billion)
Figure 16 Per Capita GDP vs. Per Capita Demand for Glass & Specialty Synthetic Fibers
Figure 17 Wind Energy Installed CAPACity, Mw (2017–2018)
Figure 18 Trends in New Airplane Deliveries, By Region, 2019–2038
Figure 19 Automotive Production in Key Countries, Million Units (2017 vs. 2018)
Figure 20 Glass & Specialty Synthetic Fiber Market, By Fiber Type
Figure 21 APAC to Be Fastest-Growing Market for Glass Fiber During Forecast Period
Figure 22 Glass & Specialty Synthetic Fiber Market, By Application
Figure 23 Aerospace & Defense Industry to Outpace Other Industries During the Forecast Period
Figure 24 Market Share of Top Wind Turbine Manufacturers
Figure 25 China to Be the Fastest-Growing Market
Figure 26 North America: Glass & Specialty Synthetic Fiber Market Snapshot
Figure 27 Europe: Glass & Specialty Synthetic Fiber Market Snapshot
Figure 28 APAC: Glass & Specialty Synthetic Fiber Market Snapshot
Figure 29 Expansion and Merger & Acquisition are Key Growth Strategies Adopted Between 2014 and 2019
Figure 30 Glass & Speciality Synthetic Fiber Market: Competitive Leadership Mapping, 2018
Figure 31 Owens Corning: Company Snapshot
Figure 32 Owens Corning: SWOT Analysis
Figure 33 Toray Industries, Inc.: Company Snapshot
Figure 34 Toray Industries, Inc.: SWOT Analysis
Figure 35 Teijin Limited: Company Snapshot
Figure 36 Teijin Limited: SWOT Analysis
Figure 37 Mitsubishi Chemical Holdings Corporation: Company Snapshot
Figure 38 Mitsubishi Chemical Holdings Corporation: SWOT Analysis
Figure 39 Hexcel Corporation: Company Snapshot
Figure 40 Figure 31 Hexcel Corporation: SWOT Analysis
Figure 41 SGL Group: Company Snapshot
Figure 42 Nippon Electric Glass Co. Ltd.: Company Snapshot
Figure 43 Honeywell International Inc. Company Snapshot
Figure 44 DSM: Company Snapshot
Figure 45 E. I. Du Pont Nemours & Co.: Company Snapshot
The study involved two major activities in estimating the current size of the glass & specialty synthetic fiber market. Exhaustive secondary research was done to collect information on the market, the peer market, and the parent market. The next step was to validate these findings, assumptions, and sizing with industry experts across the value chain through primary research. Both the top-down and bottom-up approaches were employed to estimate the total market size. After that, market breakdown and data triangulation procedures were used to determine the extent of market segments and sub-segments.
Secondary Research
In the secondary research process, various secondary sources such as Hoovers, Bloomberg BusinessWeek, and Factiva were referred to, to identify and collect information for this study. These secondary sources included annual reports, press releases & investor presentations of companies, white papers, certified publications, articles by recognized authors, gold standard & silver standard websites, regulatory bodies, trade directories, and databases.
Primary Research
The glass & specialty synthetic fiber market comprises several stakeholders, such as raw material suppliers, processors, end-product manufacturers, and regulatory organizations in the supply chain. The demand side of this market is characterized by the development of mainly the transportation, wind energy, aerospace & defense, construction & infrastructure end-use industries. Advancements in technology and diverse applications in various end-use industries describe the supply side. Various primary sources from both the supply and demand sides of the market were interviewed to obtain qualitative and quantitative information.
Following is the breakdown of primary respondents:
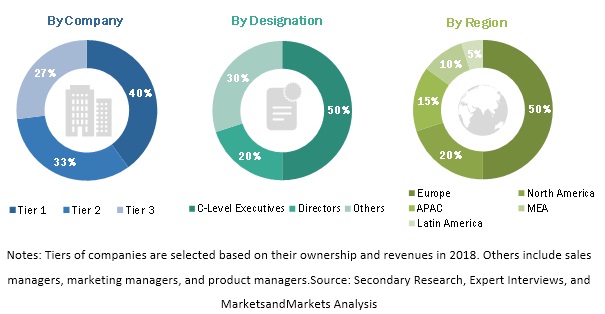
To know about the assumptions considered for the study, download the pdf brochure
Market Size Estimation
Both the top-down and bottom-up approaches were used to estimate and validate the total glass & specialty synthetic fiber market. These methods were also used extensively to determine the size of various sub-segments in the market. The research methodology used to estimate the market size included the following:
- The key players in the industry and markets were identified through extensive secondary research.
- The industry’s supply chain and market size, in terms of value, were determined through primary and secondary research processes.
- All percentage shares, splits, and breakdowns were determined using secondary sources and verified through primary sources.
Data Triangulation
After arriving at the overall glass & specialty synthetic fiber market size using the market size estimation processes as explained above, the market was split into several segments and sub-segments. To complete the whole market engineering process and arrive at the exact statistics of each market segment and subsegment, the data triangulation, and market breakdown procedures were employed, wherever applicable. The data was triangulated by studying various factors and trends from both the demand and supply sides, mainly from the transportation, wind energy, aerospace & defense, construction & infrastructure end-use industries.
Report Objectives
- To define, describe, and forecast the market size of the glass & specialty synthetic fiber market, in terms of value and volume
- To provide detailed information about the key factors (drivers, restraints, opportunities, and challenges) influencing the growth of the market
- To analyze and forecast the market based on fiber type, application, and end-use industry
- To analyze and predict the market based on five regions, namely, Europe, North America, APAC, the MEA, and Latin America
- To strategically analyze micro markets concerning individual growth trends, prospects, and their contribution to the overall market
- To analyze the opportunities in the market for stakeholders and provide a competitive landscape for market leaders
- To strategically profile the key players and comprehensively analyze their market share and core competencies
Available Customizations
With the given market data, MarketsandMarkets offers customizations according to the company’s specific needs.
The following customization options are available for the report:
Product Analysis
- Product matrix, which gives a detailed comparison of the product portfolio of each company
Regional Analysis
- Further breakdown of Rest of APAC glass & specialty synthetic fiber market
- Further breakdown of Rest of Europe glass & specialty synthetic fiber market
- Further breakdown of Rest of North America glass & specialty synthetic fiber market
- Further breakdown of Rest of MEA glass & specialty synthetic fiber market
- Further breakdown of Rest of Latin American glass & specialty synthetic fiber market
Company Information
- Detailed analysis and profiling of additional market players (up to 10)


Growth opportunities and latent adjacency in Glass & Specialty Synthetic Fiber Market
Interested in synthetic fiber market report
Looking for list of suppliers of Glassfiber