The study involved four major activities in estimating the market size of the UHMW PE market. Exhaustive secondary research was done to collect information on the market, the peer market, and the parent market. The next step was to validate these findings, assumptions, and sizing with industry experts across the value chain through primary research. Both top-down and bottom-up approaches were employed to estimate the complete market size. Thereafter, the market breakdown and data triangulation procedures were used to estimate the market size of the segments and subsegments.
Secondary Research
In the secondary research process, various secondary sources have been referred to for identifying and collecting information for this study. These secondary sources include annual reports, press releases, investor presentations of companies, white papers, certified publications, trade directories, certified publications, articles from recognized authors, gold standard and silver standard websites, and databases.
Secondary research has been used to obtain key information about the value chain of the industry, monetary chain of the market, the total pool of key UHMW PE, market classification and segmentation according to industry trends to the bottom-most level, and regional markets. It was also used to obtain information about the key developments from a market-oriented perspective.
Primary Research
The UHMW PE market comprises several stakeholders in the value chain, which include raw material suppliers, manufacturers, and end users. Various primary sources from the supply and demand sides of the UHMW PE market have been interviewed to obtain qualitative and quantitative information. The primary interviewees from the demand side include key opinion leaders in end-use sectors. The primary sources from the supply side include manufacturers, associations, and institutions involved in the UHMW PE industry.
Primary interviews were conducted to gather insights such as market statistics, data of revenue collected from the products and services, market breakdowns, market size estimations, market forecasting, and data triangulation. Primary research also helped in understanding the various trends related to form, application, end-use industry, and region. Stakeholders from the demand side, such as CIOs, CTOs, and CSOs were interviewed to understand the buyer’s perspective on the suppliers, products, component providers, and their current usage of UHMW PE and the future outlook of their business which will affect the overall market.
The breakdown of profiles of the primary interviewees is illustrated in the figure below:

Note: Tier 1, Tier 2, and Tier 3 companies are classified based on their market revenue in 2023 available in the public domain, product portfolios, and geographical presence.
Other designations include sales representatives, production heads, and technicians.
To know about the assumptions considered for the study, download the pdf brochure
Market Size Estimation
The top-down approach was used to estimate and validate the size of various submarkets for UHMW PE for each region. The research methodology used to estimate the market size included the following steps:
-
The key players in the industry have been identified through extensive secondary research.
-
The supply chain of the industry has been determined through primary and secondary research.
-
The global market was then segmented into five major regions and validated by industry experts.
-
All percentage shares, splits, and breakdowns based on application, end-use industry, and region were determined using secondary sources and verified through primary sources.
-
All possible parameters that affect the markets covered in this research study were accounted for, viewed in extensive detail, verified through primary research, and analyzed to get the final quantitative and qualitative data. This data was consolidated and added with detailed inputs and analysis and presented in this report.
UHMW PE Market: Bottum-Up Approach

Source: Secondary Research, Interviews with Experts, and MarketsandMarkets Analysis
To know about the assumptions considered for the study, Request for Free Sample Report
UHMW PE Market: Top-Down Approach

Source: Secondary Research, Interviews with Experts, and MarketsandMarkets Analysis
Data Triangulation
After arriving at the total market size from the estimation process UHMW PE above, the overall market has been split into several segments and sub-segments. To complete the overall market engineering process and arrive at the exact statistics for all the segments and sub-segments, the data triangulation and market breakdown procedures have been employed, wherever applicable. The data has been triangulated by studying various factors and trends from both the demand and supply sides. Along with this, the market size has been validated by using both the top-down and bottom-up approaches and primary interviews. Hence, for every data segment, there have been three sources—top-down approach, bottom-up approach, and expert interviews. The data was assumed correct when the values arrived from the three sources matched.
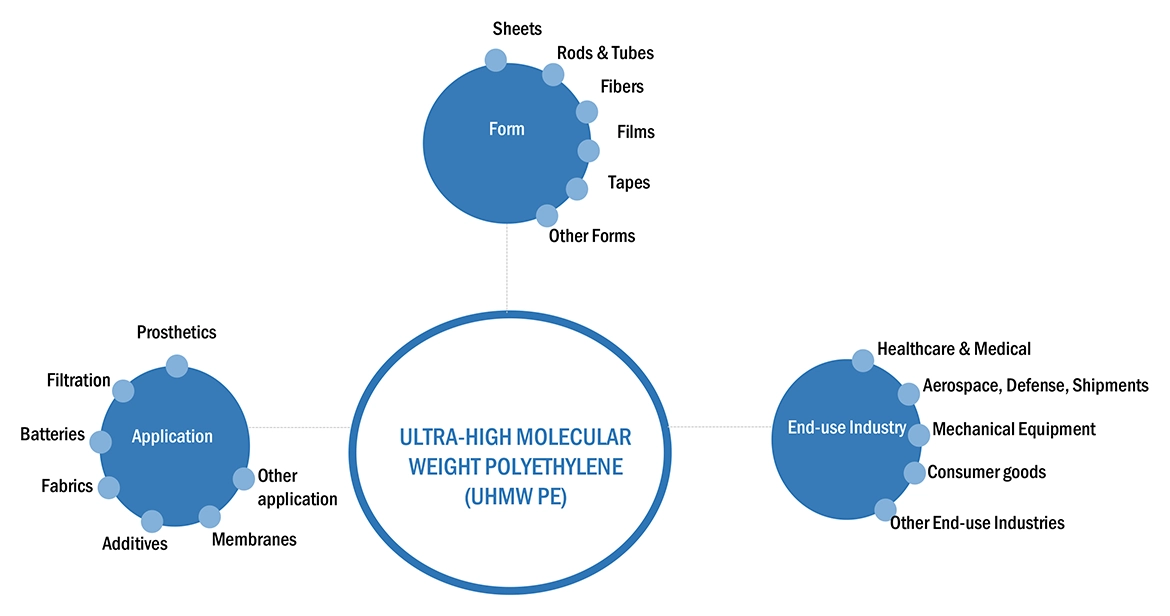
Market Definition
Ultra-high molecular weight polyethylene (UHMW PE) is a thermoplastic with long polyethylene chains and a molecular weight of 2-6 million grams per mole. It is synthesized by attaching the monomers of ethylene. UHMW PE is produced with different molecular weights, bulk densities, average particle size, and particle size distribution. It is a new generation thermoplastic material exhibiting better and improved properties over conventional thermoplastics.
UHMWPE's exceptional mechanical, chemical, and structural properties make it a versatile and indispensable material across multiple industries, particularly in applications requiring high durability and wear resistance. UHMWPE has a very low coefficient of friction, making it self-lubricating, which is beneficial in reducing wear in moving parts. HDPE and LDPE have higher coefficients of friction, which can lead to increased wear in applications involving sliding surfaces.
Key Stakeholders
-
UHMW PE Manufacturers
-
UHMW PE Traders, Distributors, and Suppliers
-
Raw Type Suppliers
-
Government and Private Research Organizations
-
Associations and Industrial Bodies
-
R&D Institutions
-
Environmental Support Agencies
Report Objectives
-
To define, describe, and forecast the ultra-high molecular weight polyethylene (UHMW PE) market size in terms of value and volume
-
To provide detailed information regarding the drivers, restraints, opportunities, and challenges influencing the growth of the UHMW PE market
-
To analyze and forecast the market by form, application, end-use industry, and region
-
To describe and forecast the market with respect to five main regions: North America, Europe, Asia Pacific, South America, and the Middle East & Africa, along with their key countries
-
To analyze opportunities for stakeholders by identifying high-growth segments of the
-
UHMW PE market
-
To strategically analyze the ecosystem, Porter’s Five Forces, technology analysis, tariffs and regulations, patent landscape, trade landscape, key conferences and events, and case studies/use cases pertaining to the market under study
-
To strategically analyze micromarkets with respect to individual growth trends, prospects, and contributions to the overall market
-
To strategically profile the key players and comprehensively analyze their market positions in terms of their ranking and core competencies, along with detailing the competitive landscape for market leaders
-
To analyze competitive developments such as investments & expansions and mergers & acquisitions.
Available Customizations
Along with the given market data, MarketsandMarkets offers customizations according to the company’s specific needs. The following customization options are available for the report:
Regional Analysis
-
Further breakdown of a region with respect to a particular country or additional application
Company Information
-
Detailed analysis and profiles of additional market players
Tariff & Regulations
-
Regulations and impact on the UHMW PE market


Growth opportunities and latent adjacency in UHMW PE Market