Stem Cell Therapy Market

Stem Cell Therapy Market by Type (Allogeneic, Autologous), Cell Source (Adipose Tissue, Bone Marrow, Placenta/Umbilical Cord), Therapeutic Application (Musculoskeletal, Wounds, Surgeries, Inflammatory, Autoimmune, Cardiovascular) & Region - Global Forecast to 2028

Report Code: BT 5049 Dec, 2023, by marketsandmarkets.com

The global stem cell therapy market in terms of revenue was estimated to be worth $286 million in 2023 and is poised to reach $615 million by 2028, growing at a CAGR of 16.5% from 2023 to 2028. The new research study consists of an industry trend analysis of the market. The new research study consists of industry trends, pricing analysis, patent analysis, conference and webinar materials, key stakeholders, and buying behaviour in the market. Market growth is driven mainly by factors such as rise in funding for stem cell research, upsurge in the number of cell therapy production facilities that have GMP certification, and increased in the number of clinical trials associated with stem cell therapies.

Attractive Opportunities in the Stem cell therapy Market.

Stem Cell Therapy Market

To know about the assumptions considered for the study, Request for Free Sample Report

Stem Cell Therapy Market

Stem Cell Therapy Market Dynamics

Driver: Increased funding for stem cell research

Government initiatives and funding mechanisms exert a pivotal influence on the dynamics of the market. Favorable regulatory frameworks and financial support from governmental bodies play a catalytic role in fostering an environment conducive to research and development in stem cell therapies. The need for newer and better therapies for the treatment of autoimmune, neurological, and cardiovascular diseases has resulted in an overall increase in research activities and the availability of funding for cell-based research. In December 2022, Alpha Stem Cell Clinic received an USD 8 million, five-year grant from the California Institute of Regenerative Medicine (CIRM) for the study of the use of self-renewing cells to treat human disease. Furthermore, in November 2019, the Australian government released a 10-year roadmap for stem cell research in Australia—The Stem Cell Therapies Mission. The initiative would provide USD 102 million (AUD 150 million) under the Medical Research Future Fund (MRFF) to support stem cell research to deliver new therapies. The infusion of government funding not only accelerates the pace of clinical trials but also facilitates the translation of research findings into viable therapeutic applications. As a result, the stem cell therapy industry is experiencing a positive ripple effect, with increased investments leading to expanded capabilities, enhanced infrastructure, and ultimately contributing to the overall growth and maturation of the industry.

Restraint: Ethical concerns related to embryonic stem cells

Ethical concerns about embryonic stem cells have been a significant restraining factor for the advancement of stem cell therapy in the market. These concerns primarily revolve around the source of embryonic stem cells, often derived from human embryos, raising ethical dilemmas related to the destruction of potential life. In various regions, regulatory frameworks and public opinion play crucial roles in shaping the environment for stem cell research and therapy. Stringent regulations and ethical considerations can limit the scope and progress of embryonic stem cell-based therapies. This, in turn, impacts the overall growth and acceptance of stem cell therapy within the market.

Opportunity: The emergence of iPSCs as an alternative to ESCs

Induced pluripotent stem cells (iPSCs) are adult stem cells that have been genetically reprogrammed back to an embryonic stem cell-like state. iPSCs function similarly to embryonic stem cells (ESCs), having the ability to differentiate into specialized tissue cells according to the gene expression; this makes iPSCs an effective alternative to ESCs. As ESCs are derived from early-stage embryos, they are associated with socio-ethical issues and laws related to contraception, abortion, and in vitro fertilization. The use of iPSCs bypasses the need for human embryos, thus avoiding socio-ethical objections.

iPSCs can be used for various applications, including the development of regenerative medicine and drug discovery (such as disease modeling and cytotoxicity studies), thus reducing the overall cost of clinical trials. The use of iPSCs for stem cell therapy allows for the generation of pluripotent cells that are identical to the patient’s genetic map. Therefore, owing to such advantages, the use of iPSCs in cell therapy research is increasing and can be beneficial to the overall growth of the market.

Challenge: Technical limitations

Due to technical difficulties faced at various manufacturing stages such as stem cell identification, isolation, storage, and preservation, it becomes difficult for a manufacturer to scale up the production. Limited manufacturing capability for production scale-up is expected to hinder the large-scale manufacturing of stem cells. The scaling-up process is also affected due to the development process adopted during the research phase. Typically, less attention is paid to the scalability of production and the cost associated with it. Different stem cells require different environments for proliferation and differentiation, potentially including mechanical stimuli or flow conditions, variable gas tensions, chemical gradients, 3D frameworks, and supporting-cell paracrine signaling. These factors depend on the source and type of stem cell.

There is a requirement for a basic stem-cell manufacturing solution that supports the production of various stem cells and provides an optimal environment. With current technological advancements, it is possible that a manufacturing solution can be programmed to control some factors; however, it is very difficult to provide a production system that fits all solutions. There are also concerns regarding the possibility of cells adapting to different, more large-scale culture conditions while retaining safety and therapeutic efficacy. These limitations form a key challenge to the growth of the market.

Ecosystem Analysis Stem Cell Therapy Market

Stem Cell Therapy Market Ecosystem

The allogeneic stem cell therapy accounted for the dominant share of the stem cell therapy industry 2022.

The stem cell therapy market is segmented into allogeneic and autologous stem cell therapies based on type. In 2022, the allogeneic stem therapy segment accounted for the largest share of the market. Various factors such as lesser complications associated with the development and manufacturing of stem cells are some of the major factors uplifting the demand for allogenic stem cells.

The adipose tissue-derived stem cell segment dominated the stem cell therapy industry.

Based on cell source, the stem cell therapy market is segmented into adipose tissue-derived MSCs, placental/umbilical cord-derived MSCs, bone marrow-derived MSCs, and other sources. In 2022, the adipose tissue-derived stem cells segment dominated the stem cell therapy with the dominant share, attributed to the growing adoption of these MSCs across different therapeutic indications. Furthermore, increased research and adoption of placental cord-derived stem cells is likely to uplift the market growth in coming years.

In 2022, the musculoskeletal disorders segment has generated highest revenue in the stem cell therapy industry.

Based on therapeutic application, the global stem cell therapy market is segmented into musculoskeletal disorders, cardiovascular diseases, wounds and surgeries, neurological disorders, inflammatory & autoimmune diseases, and other therapeutic applications. The musculoskeletal disorders therapeutic application segment generated highest revenue in 2022. Rise in prevalence of musculoskeletal disorders such as osteoarthritis along with growing demand for regenerative medicine in orthopedic and sports medicine applications are some of the major factors driving the segmental growth.

Asia Pacific region of the stem cell therapy industry is likely to grow at the highest CAGR during the forecast period of 2023-2028.

The stem cell therapy market is segmented into four major regions—North America, Europe, the Asia Pacific and Rest of the World. In 2022, North America accounted for the largest share of the market, and this trend is expected to continue during the forecast period. A robust product pipeline and increased regulatory approvals of stem cell therapy are likely to propel the market growth in the region. Asia Pacific segment is likely to grow at a higher CAGR owing to various factors such as the increasing due to increased adoption of stem cell therapies in the region.

Stem Cell Therapy Market by Region

Source: Expert Interviews, Secondary Research, Whitepapers, Journals, Magazines, and MarketsandMarkets Analysis

To know about the assumptions considered for the study, download the pdf brochure

Key players in the market include Smith+Nephew (UK), MEDIPOST Co., Ltd. (South Korea), Anterogen.Co., Ltd. (South Korea), CORESTEM (South Korea), Pharmicell Inc. (South Korea), NuVasive, Inc. (US), RTI Surgical (US), AlloSource (US), JCR Pharmaceuticals Co., Ltd. (Japan), and Takeda Pharmaceutical Company Limited (Japan), among others

Scope of the Stem Cell Therapy Industry

Report Metric

Details

Market Revenue in 2023

$286 million

Projected Revenue by 2028

$615 million

Revenue Rate

Poised to Grow at a CAGR of 16.5%

Market Driver

Increased funding for stem cell research

Market Opportunity

The emergence of iPSCs as an alternative to ESCs

This report categorizes the stem cell therapy market to forecast revenue and analyze trends in each of the following submarkets:

By Type

  • Allogeneic Stem Cell Therapy
  • Autologous Stem Cell Therapy

By Cell Source

  • Adipose tissue-derived MSCs (mesenchymal stem cells),
  • Bone marrow-derived MSCs,
  • Placental/umbilical cord-derived MSCs
  • Other Cell Sources

By Therapeutic Application

  • Musculoskeletal Disorders
  • Wounds & Surgeries
  • Cardiovascular Diseases
  • Inflammatory & Autoimmune Diseases
  • Neurological Disorders
  • Other Therapeutic Applications

By Region

  • North America
    • US
    • Canada
  • Europe
    • Germany
    • France
    • UK
    • Italy
    • Spain
    • Rest of Europe (RoE)
  • Asia Pacific (APAC)
    • Japan
    • China
    • India
    • South Korea
    • Rest of Asia Pacific (RoAPAC)
  • Rest of World

Recent Developments of Stem Cell Therapy Industry

  • In April 2023, US FDA approved Omisirge (omidubicel-onlv), a substantially modified allogeneic (donor) cord blood-based cell therapy.
  • In July 2022, CORESTEM (South Korea) continued enrolling participants for the Phase 3 clinical trial of NeuroNata-R. This therapy has received conditional approval for treating ALS patients in South Korea
  • In September 2020, Stemedica Cell Technologies received investigational new drug (IND) approval from the US FDA for intravenous allogeneic mesenchymal stem cells (MSCs) to treat moderate to severe COVID-19.

Frequently Asked Questions (FAQ):

To speak to our analyst for a discussion on the above findings, click Speak to Analyst

TABLE OF CONTENTS
 
1 INTRODUCTION (Page No. - 28)
    1.1 STUDY OBJECTIVES 
    1.2 MARKET DEFINITION 
    1.3 INCLUSIONS & EXCLUSIONS 
    1.4 MARKET SCOPE 
           1.4.1 MARKETS COVERED
           1.4.2 YEARS CONSIDERED
    1.5 CURRENCY 
    1.6 RESEARCH LIMITATIONS 
    1.7 STAKEHOLDERS 
    1.8 SUMMARY OF CHANGES 
    1.9 RECESSION IMPACT 
 
2 RESEARCH METHODOLOGY (Page No. - 33)
    2.1 RESEARCH DATA 
          FIGURE 1 RESEARCH DESIGN
           2.1.1 SECONDARY DATA
           2.1.2 PRIMARY DATA
                    FIGURE 2 BREAKDOWN OF PRIMARIES: STEM CELL THERAPY MARKET
    2.2 MARKET SIZE ESTIMATION 
          FIGURE 3 MARKET SIZE ESTIMATION FOR SUPPLY-SIDE ANALYSIS, 2022
          FIGURE 4 MARKET SIZE ESTIMATION: REVENUE SHARE ANALYSIS, 2022
          FIGURE 5 SMITH+NEPHEW: REVENUE SHARE ANALYSIS, 2022
           2.2.1 PRIMARY INSIGHTS
                    FIGURE 6 VALIDATION FROM PRIMARY EXPERTS
           2.2.2 SEGMENT ASSESSMENT METHODOLOGY: STEM CELL THERAPY INDUSTRY
                    FIGURE 7 MARKET SIZE ESTIMATION METHODOLOGY: TOP-DOWN APPROACH
                    FIGURE 8 CAGR PROJECTIONS: MARKET
                    FIGURE 9 GROWTH ANALYSIS OF DRIVERS, RESTRAINTS, CHALLENGES, AND OPPORTUNITIES
    2.3 MARKET BREAKDOWN AND DATA TRIANGULATION 
          FIGURE 10 DATA TRIANGULATION METHODOLOGY
    2.4 STUDY ASSUMPTIONS 
    2.5 RISK ANALYSIS 
    2.6 IMPACT OF RECESSION ON MARKET 
          TABLE 1 GLOBAL INFLATION RATE PROJECTION, 2024–2028 (% GROWTH)
          TABLE 2 US HEALTH EXPENDITURE, 2019–2022 (USD MILLION)
          TABLE 3 US HEALTH EXPENDITURE, 2023–2027 (USD MILLION)
 
3 EXECUTIVE SUMMARY (Page No. - 45)
    FIGURE 11 STEM CELL THERAPY MARKET, BY TYPE, 2023 VS. 2028 (USD MILLION)
    FIGURE 12 MARKET, BY CELL SOURCE, 2023 VS. 2028 (USD MILLION)
    FIGURE 13 MARKET, BY THERAPEUTIC APPLICATION, 2023 VS. 2028 (USD MILLION)
    FIGURE 14 REGIONAL SNAPSHOT OF MARKET
 
4 PREMIUM INSIGHTS (Page No. - 49)
    4.1 MARKET OVERVIEW 
          FIGURE 15 INCREASING INVESTMENTS AND FUNDING FOR STEM CELL RESEARCH TO DRIVE MARKET
    4.2 NORTH AMERICA: MARKET, BY TYPE AND COUNTRY, 2022 
          FIGURE 16 ALLOGENEIC STEM CELL THERAPY ACCOUNTED FOR LARGEST MARKET SHARE IN 2022
    4.3 STEM CELL THERAPY INDUSTRY: GEOGRAPHICAL GROWTH OPPORTUNITIES 
          FIGURE 17 SOUTH KOREA TO REGISTER HIGHEST GROWTH RATE DURING FORECAST PERIOD
 
5 MARKET OVERVIEW (Page No. - 52)
    5.1 INTRODUCTION 
    5.2 MARKET DYNAMICS 
          FIGURE 18 STEM CELL THERAPY MARKET: DRIVERS, RESTRAINTS, OPPORTUNITIES, AND CHALLENGES
           5.2.1 DRIVERS
                    5.2.1.1 Increased funding for stem cell research
                                TABLE 4 FUNDING FOR STEM CELL RESEARCH BY INDIAN COUNCIL OF MEDICAL RESEARCH, 2019–2022 (USD)
                                TABLE 5 FUNDING FOR CELL-BASED RESEARCH BY NATIONAL INSTITUTES OF HEALTH, 2018–2023 (USD MILLION)
                    5.2.1.2 Rising number of collaborations among healthcare institutes
                    5.2.1.3 Increasing number of clinical trials for stem cell-based therapies
                                FIGURE 19 NUMBER OF CLINICAL TRIALS, 2015–2022
           5.2.2 RESTRAINTS
                    5.2.2.1 Ethical concerns related to use of embryonic stem cells
                    5.2.2.2 High cost of cell-based research and stem cell therapy
           5.2.3 OPPORTUNITIES
                    5.2.3.1 Increased availability of alternatives to embryonic stem cells
                    5.2.3.2 Growing demand for cell and gene therapies
           5.2.4 CHALLENGES
                    5.2.4.1 Technological limitations
    5.3 TECHNOLOGY ANALYSIS 
          TABLE 6 COMPARISON BETWEEN STEM CELL THERAPIES AND GENE THERAPIES
    5.4 DISRUPTIONS AND TRENDS IMPACTING CUSTOMER’S BUSINESS 
          FIGURE 20 REVENUE SHIFT AND NEW POCKET FOR KEY PLAYERS IN MARKET
    5.5 VALUE CHAIN ANALYSIS 
          FIGURE 21 STEM CELL THERAPY INDUSTRY: VALUE CHAIN ANALYSIS
    5.6 ECOSYSTEM MARKET MAP 
          FIGURE 22 MARKET: ECOSYSTEM MARKET MAP
    5.7 SUPPLY CHAIN ANALYSIS 
          FIGURE 23 MARKET: SUPPLY CHAIN ANALYSIS
          TABLE 7 SUPPLY CHAIN ANALYSIS: ROLE OF COMMERCIAL-SCALE/KEY MANUFACTURERS
          TABLE 8 SUPPLY CHAIN ANALYSIS: PIPELINE/EMERGING MANUFACTURERS
    5.8 PORTER’S FIVE FORCES ANALYSIS 
           5.8.1 THREAT OF NEW ENTRANTS
           5.8.2 THREAT OF SUBSTITUTES
           5.8.3 BARGAINING POWER OF SUPPLIERS
           5.8.4 BARGAINING POWER OF BUYERS
           5.8.5 INTENSITY OF COMPETITION RIVALRY
    5.9 REGULATORY ANALYSIS 
           5.9.1 REGULATORY LANDSCAPE
                    5.9.1.1 North America
                                TABLE 9 NORTH AMERICA: REGULATORY LANDSCAPE FOR STEM CELL THERAPIES
                    5.9.1.2 Europe
                                TABLE 10 EUROPE: REGULATORY LANDSCAPE FOR STEM CELL THERAPIES
                    5.9.1.3 Asia Pacific
                                TABLE 11 ASIA PACIFIC: REGULATORY LANDSCAPE FOR STEM CELL THERAPIES
                    5.9.1.4 Rest of the World
                                TABLE 12 REST OF THE WORLD: REGULATORY LANDSCAPE FOR STEM CELL THERAPIES
           5.9.2 REGULATORY BODIES, GOVERNMENT AGENCIES, AND OTHER ORGANIZATIONS
                    TABLE 13 NORTH AMERICA: REGULATORY BODIES, GOVERNMENT AGENCIES, AND OTHER ORGANIZATIONS
                    TABLE 14 EUROPE: REGULATORY BODIES, GOVERNMENT AGENCIES, AND OTHER ORGANIZATIONS
                    TABLE 15 ASIA PACIFIC: REGULATORY BODIES, GOVERNMENT AGENCIES, AND OTHER ORGANIZATIONS
                    TABLE 16 REST OF THE WORLD: REGULATORY BODIES, GOVERNMENT AGENCIES, AND OTHER ORGANIZATIONS
    5.10 PRICING ANALYSIS 
           5.10.1 PRICING ANALYSIS
                     TABLE 17 AVERAGE SELLING PRICE OF DRUG THERAPIES OFFERED BY KEY PLAYERS IN MARKET
           5.10.2 AVERAGE SELLING PRICE TREND FOR STEM CELL THERAPIES
    5.11 PATENT ANALYSIS 
           FIGURE 24 STEM CELL THERAPY: PATENT ANALYSIS, 2013–2023
    5.12 KEY CONFERENCES & EVENTS 
           TABLE 18 LIST OF KEY CONFERENCES & EVENTS, 2023–2024
    5.13 PIPELINE ANALYSIS 
    5.14 KEY STAKEHOLDERS & BUYING CRITERIA 
           FIGURE 25 KEY STAKEHOLDERS
           5.14.1 KEY BUYING CRITERIA
                     FIGURE 26 KEY BUYING CRITERIA FOR END USERS
 
6 STEM CELL THERAPY MARKET, BY CELL SOURCE (Page No. - 83)
    6.1 INTRODUCTION 
          TABLE 19 STEM CELL THERAPY INDUSTRY, BY CELL SOURCE, 2021–2028 (USD MILLION)
    6.2 ADIPOSE TISSUE-DERIVED MESENCHYMAL STEM CELLS 
           6.2.1 EASE OF ISOLATION AND HARVESTING TO DRIVE GROWTH
                    TABLE 20 ADIPOSE TISSUE-DERIVED MESENCHYMAL STEM CELLS MARKET, BY REGION, 2021–2028 (USD MILLION)
                    TABLE 21 NORTH AMERICA: ADIPOSE TISSUE-DERIVED MESENCHYMAL STEM CELLS MARKET, BY COUNTRY, 2021–2028 (USD MILLION)
                    TABLE 22 EUROPE: ADIPOSE TISSUE-DERIVED MESENCHYMAL STEM CELLS MARKET, BY COUNTRY, 2021–2028 (USD MILLION)
                    TABLE 23 ASIA PACIFIC: ADIPOSE TISSUE-DERIVED MESENCHYMAL STEM CELLS MARKET, BY COUNTRY, 2021–2028 (USD MILLION)
    6.3 BONE MARROW-DERIVED MESENCHYMAL STEM CELLS 
           6.3.1 HIGH PREVALENCE OF METABOLIC DISORDERS TO SUPPORT MARKET GROWTH
                    TABLE 24 BONE MARROW-DERIVED MESENCHYMAL STEM CELLS MARKET, BY REGION, 2021–2028 (USD MILLION)
                    TABLE 25 NORTH AMERICA: BONE MARROW-DERIVED MESENCHYMAL STEM CELLS MARKET, BY COUNTRY, 2021–2028 (USD MILLION)
                    TABLE 26 EUROPE: BONE MARROW-DERIVED MESENCHYMAL STEM CELLS MARKET, BY COUNTRY, 2021–2028 (USD MILLION)
                    TABLE 27 ASIA PACIFIC: BONE MARROW-DERIVED MESENCHYMAL STEM CELLS MARKET, BY COUNTRY, 2021–2028 (USD MILLION)
    6.4 PLACENTA/UMBILICAL CORD-DERIVED MESENCHYMAL STEM CELLS 
           6.4.1 LOW CHANCES OF REJECTION FROM IMMUNE SYSTEM TO PROPEL GROWTH
                    TABLE 28 PLACENTA/UMBILICAL CORD-DERIVED MESENCHYMAL STEM CELLS MARKET, BY REGION, 2021–2028 (USD MILLION)
                    TABLE 29 NORTH AMERICA: PLACENTA/UMBILICAL CORD-DERIVED MESENCHYMAL STEM CELLS MARKET, BY COUNTRY, 2021–2028 (USD MILLION)
                    TABLE 30 EUROPE: PLACENTA/UMBILICAL CORD-DERIVED MESENCHYMAL STEM CELLS MARKET, BY COUNTRY, 2021–2028 (USD MILLION)
                    TABLE 31 ASIA PACIFIC: PLACENTA/UMBILICAL CORD-DERIVED MESENCHYMAL STEM CELLS MARKET, BY COUNTRY, 2021–2028 (USD MILLION)
    6.5 OTHER CELL SOURCES 
          TABLE 32 MARKET FOR OTHER CELL SOURCES, BY REGION, 2021–2028 (USD MILLION)
          TABLE 33 NORTH AMERICA: MARKET FOR OTHER CELL SOURCES, BY COUNTRY, 2021–2028 (USD MILLION)
          TABLE 34 EUROPE: MARKET FOR OTHER CELL SOURCES, BY COUNTRY, 2021–2028 (USD MILLION)
          TABLE 35 ASIA PACIFIC: MARKET FOR OTHER CELL SOURCES, BY COUNTRY, 2021–2028 (USD MILLION)
 
7 STEM CELL THERAPY MARKET, BY TYPE (Page No. - 93)
    7.1 INTRODUCTION 
          TABLE 36 STEM CELL THERAPY INDUSTRY, BY TYPE, 2021–2028 (USD MILLION)
    7.2 ALLOGENEIC STEM CELL THERAPY 
           7.2.1 ECONOMICALLY VIABLE AND LESS TIME-CONSUMING—KEY FACTORS DRIVING MARKET GROWTH
                    TABLE 37 MARKET, BY REGION, 2021–2028 (USD MILLION)
                    TABLE 38 NORTH AMERICA: MARKET, BY COUNTRY, 2021–2028 (USD MILLION)
                    TABLE 39 EUROPE: MARKET, BY COUNTRY, 2021–2028 (USD MILLION)
                    TABLE 40 ASIA PACIFIC: MARKET, BY COUNTRY, 2021–2028 (USD MILLION)
    7.3 AUTOLOGOUS STEM CELL THERAPY 
           7.3.1 LOW RISK OF POST-TREATMENT COMPLICATIONS TO DRIVE GROWTH
                    TABLE 41 MARKET, BY REGION, 2021–2028 (USD MILLION)
                    TABLE 42 NORTH AMERICA: MARKET, BY COUNTRY, 2021–2028 (USD MILLION)
                    TABLE 43 EUROPE: MARKET, BY COUNTRY, 2021–2028 (USD MILLION)
                    TABLE 44 ASIA PACIFIC: MARKET, BY COUNTRY, 2021–2028 (USD MILLION)
 
8 STEM CELL THERAPY MARKET, BY THERAPEUTIC APPLICATION (Page No. - 99)
    8.1 INTRODUCTION 
          TABLE 45 STEM CELL THERAPY INDUSTRY, BY THERAPEUTIC APPLICATION, 2021–2028 (USD MILLION)
    8.2 MUSCULOSKELETAL DISORDERS 
           8.2.1 INCREASING CASES OF OSTEOARTHRITIS TO DRIVE MARKET
                    TABLE 46 MARKET FOR MUSCULOSKELETAL DISORDERS, BY REGION, 2021–2028 (USD MILLION)
                    TABLE 47 NORTH AMERICA: MARKET FOR MUSCULOSKELETAL DISORDERS, BY COUNTRY, 2021–2028 (USD MILLION)
                    TABLE 48 EUROPE: MARKET FOR MUSCULOSKELETAL DISORDERS, BY COUNTRY, 2021–2028 (USD MILLION)
                    TABLE 49 ASIA PACIFIC: MARKET FOR MUSCULOSKELETAL DISORDERS, BY COUNTRY, 2021–2028 (USD MILLION)
    8.3 WOUNDS & SURGERIES 
           8.3.1 INCREASING BENEFITS OF ALLOGENEIC-BASED THERAPIES TO SUPPORT MARKET GROWTH
                    TABLE 50 MARKET FOR WOUNDS & SURGERIES, BY REGION, 2021–2028 (USD MILLION)
                    TABLE 51 NORTH AMERICA: MARKET FOR WOUNDS & SURGERIES, BY COUNTRY, 2021–2028 (USD MILLION)
                    TABLE 52 EUROPE: MARKET FOR WOUNDS & SURGERIES, BY COUNTRY, 2021–2028 (USD MILLION)
                    TABLE 53 ASIA PACIFIC: MARKET FOR WOUNDS & SURGERIES, BY COUNTRY, 2021–2028 (USD MILLION)
    8.4 INFLAMMATORY & AUTOIMMUNE DISEASES 
           8.4.1 INCREASING CLINICAL TRIALS TO SUPPORT MARKET GROWTH
                    TABLE 54 MARKET FOR INFLAMMATORY & AUTOIMMUNE DISEASES, BY REGION, 2021–2028 (USD MILLION)
                    TABLE 55 NORTH AMERICA: MARKET FOR INFLAMMATORY & AUTOIMMUNE DISEASES, BY COUNTRY, 2021–2028 (USD MILLION)
                    TABLE 56 EUROPE: MARKET FOR INFLAMMATORY & AUTOIMMUNE DISEASES, BY COUNTRY, 2021–2028 (USD MILLION)
                    TABLE 57 ASIA PACIFIC: MARKET FOR INFLAMMATORY & AUTOIMMUNE DISEASES, BY COUNTRY, 2021–2028 (USD MILLION)
    8.5 CARDIOVASCULAR DISEASES 
           8.5.1 INCREASING PUBLIC & PRIVATE FUNDING FOR CVD RESEARCH TO DRIVE MARKET
                    TABLE 58 MARKET FOR CARDIOVASCULAR DISEASES, BY REGION, 2021–2028 (USD MILLION)
                    TABLE 59 NORTH AMERICA: MARKET FOR CARDIOVASCULAR DISEASES, BY COUNTRY, 2021–2028 (USD MILLION)
                    TABLE 60 EUROPE: MARKET FOR CARDIOVASCULAR DISEASES, BY COUNTRY, 2021–2028 (USD MILLION)
                    TABLE 61 ASIA PACIFIC: MARKET FOR CARDIOVASCULAR DISEASES, BY COUNTRY, 2021–2028 (USD MILLION)
    8.6 NEUROLOGICAL DISORDERS 
           8.6.1 RISING PREVALENCE OF NEUROLOGICAL DISORDERS TO PROPEL MARKET
                    TABLE 62 MARKET FOR NEUROLOGICAL DISORDERS, BY REGION, 2021–2028 (USD MILLION)
                    TABLE 63 NORTH AMERICA: MARKET FOR NEUROLOGICAL DISORDERS, BY COUNTRY, 2021–2028 (USD MILLION)
                    TABLE 64 EUROPE: MARKET FOR NEUROLOGICAL DISORDERS, BY COUNTRY, 2021–2028 (USD MILLION)
                    TABLE 65 ASIA PACIFIC: MARKET FOR NEUROLOGICAL DISORDERS, BY COUNTRY, 2021–2028 (USD MILLION)
    8.7 OTHER THERAPEUTIC APPLICATIONS 
          TABLE 66 MARKET FOR OTHER THERAPEUTIC APPLICATIONS, BY REGION, 2021–2028 (USD MILLION)
          TABLE 67 NORTH AMERICA: MARKET FOR OTHER THERAPEUTIC APPLICATIONS, BY COUNTRY, 2021–2028 (USD MILLION)
          TABLE 68 EUROPE: MARKET FOR OTHER THERAPEUTIC APPLICATIONS, BY COUNTRY, 2021–2028 (USD MILLION)
          TABLE 69 ASIA PACIFIC: MARKET FOR OTHER THERAPEUTIC APPLICATIONS, BY COUNTRY, 2021–2028 (USD MILLION)
 
9 STEM CELL THERAPY MARKET, BY REGION (Page No. - 111)
    9.1 INTRODUCTION 
          TABLE 70 STEM CELL THERAPY INDUSTRY, BY REGION, 2021–2028 (USD MILLION)
    9.2 NORTH AMERICA 
          FIGURE 27 NORTH AMERICA: MARKET SNAPSHOT
          TABLE 71 NORTH AMERICA: MARKET, BY COUNTRY, 2021–2028 (USD MILLION)
          TABLE 72 NORTH AMERICA: MARKET, BY CELL SOURCE, 2021–2028 (USD MILLION)
          TABLE 73 NORTH AMERICA: MARKET, BY TYPE, 2021–2028 (USD MILLION)
          TABLE 74 NORTH AMERICA: MARKET, BY THERAPEUTIC APPLICATION, 2021–2028 (USD MILLION)
           9.2.1 US
                    9.2.1.1 Increase in stem cell therapy approvals to drive market
                                TABLE 75 US: STEM CELL THERAPY MARKET, BY CELL SOURCE, 2021–2028 (USD MILLION)
                                TABLE 76 US: MARKET, BY TYPE, 2021–2028 (USD MILLION)
                                TABLE 77 US: MARKET, BY THERAPEUTIC APPLICATION, 2021–2028 (USD MILLION)
           9.2.2 CANADA
                    9.2.2.1 Increase in research activities targeted toward stem cell therapies to propel market
                                TABLE 78 CANADA: MARKET, BY CELL SOURCE, 2021–2028 (USD MILLION)
                                TABLE 79 CANADA: MARKET, BY TYPE, 2021–2028 (USD MILLION)
                                TABLE 80 CANADA: MARKET, BY THERAPEUTIC APPLICATION, 2021–2028 (USD MILLION)
           9.2.3 RECESSION IMPACT ON NORTH AMERICAN MARKET
    9.3 EUROPE 
          TABLE 81 EUROPE: STEM CELL THERAPY MARKET, BY COUNTRY, 2021–2028 (USD MILLION)
          TABLE 82 EUROPE: MARKET, BY CELL SOURCE, 2021–2028 (USD MILLION)
          TABLE 83 EUROPE: MARKET, BY TYPE, 2021–2028 (USD MILLION)
          TABLE 84 EUROPE: MARKET, BY THERAPEUTIC APPLICATION, 2021–2028 (USD MILLION)
           9.3.1 GERMANY
                    9.3.1.1 Increasing incidence of sports-related injuries to drive market
                                TABLE 85 GERMANY: MARKET, BY CELL SOURCE, 2021–2028 (USD MILLION)
                                TABLE 86 GERMANY: MARKET, BY TYPE, 2021–2028 (USD MILLION)
                                TABLE 87 GERMANY: MARKET, BY THERAPEUTIC APPLICATION, 2021–2028 (USD MILLION)
           9.3.2 UK
                    9.3.2.1 Rising adoption of cell-based therapies to propel market
                                TABLE 88 UK: STEM CELL THERAPY MARKET, BY CELL SOURCE, 2021–2028 (USD MILLION)
                                TABLE 89 UK: MARKET, BY TYPE, 2021–2028 (USD MILLION)
                                TABLE 90 UK: MARKET, BY THERAPEUTIC APPLICATION, 2021–2028 (USD MILLION)
           9.3.3 FRANCE
                    9.3.3.1 Rising R&D expenditure for stem cell therapy to support market growth
                                TABLE 91 FRANCE: MARKET, BY CELL SOURCE, 2021–2028 (USD MILLION)
                                TABLE 92 FRANCE: MARKET, BY TYPE, 2021–2028 (USD MILLION)
                                TABLE 93 FRANCE: MARKET, BY THERAPEUTIC APPLICATION, 2021–2028 (USD MILLION)
           9.3.4 ITALY
                    9.3.4.1 Rising prevalence of neurological and cardiovascular disorders to drive market
                                TABLE 94 ITALY: STEM CELL THERAPY MARKET, BY CELL SOURCE, 2021–2028 (USD MILLION)
                                TABLE 95 ITALY: MARKET, BY TYPE, 2021–2028 (USD MILLION)
                                TABLE 96 ITALY: MARKET, BY THERAPEUTIC APPLICATION, 2021–2028 (USD MILLION)
           9.3.5 SPAIN
                    9.3.5.1 Rising prevalence of CVD to propel market
                                TABLE 97 SPAIN: MARKET, BY CELL SOURCE, 2021–2028 (USD MILLION)
                                TABLE 98 SPAIN: MARKET, BY TYPE, 2021–2028 (USD MILLION)
                                TABLE 99 SPAIN: MARKET, BY THERAPEUTIC APPLICATION, 2021–2028 (USD MILLION)
           9.3.6 REST OF EUROPE
                    TABLE 100 REST OF EUROPE: STEM CELL THERAPY MARKET, BY CELL SOURCE, 2021–2028 (USD MILLION)
                    TABLE 101 REST OF EUROPE: MARKET, BY TYPE, 2021–2028 (USD MILLION)
                    TABLE 102 REST OF EUROPE: MARKET, BY THERAPEUTIC APPLICATION, 2021–2028 (USD MILLION)
           9.3.7 RECESSION IMPACT ON EUROPEAN MARKET
    9.4 ASIA PACIFIC 
          FIGURE 28 ASIA PACIFIC: MARKET SNAPSHOT
          TABLE 103 ASIA PACIFIC: MARKET, BY COUNTRY, 2021–2028 (USD MILLION)
          TABLE 104 ASIA PACIFIC: MARKET, BY CELL SOURCE, 2021–2028 (USD MILLION)
          TABLE 105 ASIA PACIFIC: MARKET, BY TYPE, 2021–2028 (USD MILLION)
          TABLE 106 ASIA PACIFIC: MARKET, BY THERAPEUTIC APPLICATION, 2021–2028 (USD MILLION)
           9.4.1 JAPAN
                    9.4.1.1 Growing geriatric population and faster regulatory approval process to augment market growth
                                TABLE 107 JAPAN: STEM CELL THERAPY MARKET, BY CELL SOURCE, 2021–2028 (USD MILLION)
                                TABLE 108 JAPAN: MARKET, BY TYPE, 2021–2028 (USD MILLION)
                                TABLE 109 JAPAN: MARKET, BY THERAPEUTIC APPLICATION, 2021–2028 (USD MILLION)
           9.4.2 SOUTH KOREA
                    9.4.2.1 Presence of major players to support market growth in South Korea
                                TABLE 110 SOUTH KOREA: MARKET, BY CELL SOURCE, 2021–2028 (USD MILLION)
                                TABLE 111 SOUTH KOREA: MARKET, BY TYPE, 2021–2028 (USD MILLION)
                                TABLE 112 SOUTH KOREA: MARKET, BY THERAPEUTIC APPLICATION, 2021–2028 (USD MILLION)
           9.4.3 INDIA
                    9.4.3.1 Rising incidence of neurodegenerative disorders and diabetes to drive market
                                TABLE 113 INDIA: STEM CELL THERAPY MARKET, BY CELL SOURCE, 2021–2028 (USD MILLION)
                                TABLE 114 INDIA: MARKET, BY TYPE, 2021–2028 (USD MILLION)
                                TABLE 115 INDIA: MARKET, BY THERAPEUTIC APPLICATION, 2021–2028 (USD MILLION)
           9.4.4 CHINA
                    9.4.4.1 Increasing investments in stem cell research to drive market
                                TABLE 116 CHINA: MARKET, BY CELL SOURCE, 2021–2028 (USD MILLION)
                                TABLE 117 CHINA: MARKET, BY TYPE, 2021–2028 (USD MILLION)
                                TABLE 118 CHINA: MARKET, BY THERAPEUTIC APPLICATION, 2021–2028 (USD MILLION)
           9.4.5 REST OF ASIA PACIFIC
                    TABLE 119 REST OF ASIA PACIFIC: STEM CELL THERAPY MARKET, BY CELL SOURCE, 2021–2028 (USD MILLION)
                    TABLE 120 REST OF ASIA PACIFIC: MARKET, BY TYPE, 2021–2028 (USD MILLION)
                    TABLE 121 REST OF ASIA PACIFIC: MARKET, BY THERAPEUTIC APPLICATION, 2021–2028 (USD MILLION)
           9.4.6 RECESSION IMPACT ON ASIA PACIFIC MARKET
    9.5 REST OF THE WORLD 
          TABLE 122 REST OF THE WORLD: MARKET, BY CELL SOURCE, 2021–2028 (USD MILLION)
          TABLE 123 REST OF THE WORLD: MARKET, BY TYPE, 2021–2028 (USD MILLION)
          TABLE 124 REST OF THE WORLD: MARKET, BY THERAPEUTIC APPLICATION, 2021–2028 (USD MILLION)
           9.5.1 RECESSION IMPACT ON REST OF THE WORLD MARKET
 
10 COMPETITIVE LANDSCAPE (Page No. - 142)
     10.1 INTRODUCTION 
     10.2 STRATEGIES ADOPTED BY KEY PLAYERS 
             FIGURE 29 STEM CELL THERAPY MARKET: STRATEGIES ADOPTED BY KEY PLAYERS
     10.3 REVENUE SHARE ANALYSIS 
             FIGURE 30 REVENUE ANALYSIS OF TOP PLAYERS, 2020−2022 (USD MILLION)
     10.4 MARKET SHARE ANALYSIS 
             FIGURE 31 STEM CELL THERAPY MARKET: MARKET SHARE ANALYSIS, BY KEY PLAYER, 2022
             TABLE 125 STEM CELL THERAPY INDUSTRY: INTENSITY OF COMPETITIVE RIVALRY
     10.5 COMPANY EVALUATION MATRIX 
             FIGURE 32 STEM CELL THERAPY INDUSTRY: COMPANY EVALUATION MATRIX FOR KEY PLAYERS, 2022
             10.5.1 STARS
             10.5.2 EMERGING LEADERS
             10.5.3 PERVASIVE PLAYERS
             10.5.4 PARTICIPANTS
     10.6 COMPETITIVE BENCHMARKING OF KEY PLAYERS 
             TABLE 126 THERAPEUTIC APPLICATION FOOTPRINT OF COMPANIES
     10.7 REGIONAL FOOTPRINT OF TOP 15 COMPANIES 
             TABLE 127 REGIONAL FOOTPRINT OF COMPANIES
     10.8 STARTUP/SME EVALUATION MATRIX 
             FIGURE 33 STEM CELL THERAPY MARKET: STARTUP/SME EVALUATION MATRIX, 2022
             10.8.1 PROGRESSIVE COMPANIES
             10.8.2 RESPONSIVE COMPANIES
             10.8.3 DYNAMIC COMPANIES
             10.8.4 STARTING BLOCKS
     10.9 COMPETITIVE BENCHMARKING OF STARTUPS/SMES 
             TABLE 128 STEM CELL THERAPY INDUSTRY: PRODUCT FOOTPRINT ANALYSIS OF STARTUPS/SMES
             TABLE 129 STEM CELL THERAPY INDUSTRY: COMPETITIVE BENCHMARKING OF STARTUPS/SMES
     10.10 COMPETITIVE SCENARIOS AND TRENDS 
             10.10.1 PRODUCT APPROVALS
                        TABLE 130 STEM CELL THERAPY MARKET: PRODUCT APPROVALS, JANUARY 2020–OCTOBER 2023
             10.10.2 DEALS
                        TABLE 131 STEM CELL THERAPY MARKET: DEALS, JANUARY 2020–OCTOBER 2023
             10.10.3 OTHER DEVELOPMENTS
                        TABLE 132 STEM CELL THERAPY INDUSTRY: OTHER DEVELOPMENTS, JANUARY 2020–OCTOBER 2023
 
11 COMPANY PROFILES (Page No. - 157)
(Business Overview, Products Offered, Recent Developments, and MnM View (Key strengths/Right to Win, Strategic Choices Made, and Weaknesses and Competitive Threats))*
     11.1 KEY PLAYERS 
             11.1.1 SMITH+NEPHEW
                        TABLE 133 SMITH+NEPHEW: BUSINESS OVERVIEW
                        FIGURE 34 SMITH+NEPHEW: COMPANY SNAPSHOT (2022)
             11.1.2 MEDIPOST
                        TABLE 134 MEDIPOST: BUSINESS OVERVIEW
                        FIGURE 35 MEDIPOST: COMPANY SNAPSHOT (2021)
             11.1.3 JCR PHARMACEUTICALS CO., LTD.
                        TABLE 135 JCR PHARMACEUTICALS CO., LTD.: BUSINESS OVERVIEW
                        FIGURE 36 JCR PHARMACEUTICALS CO., LTD: COMPANY SNAPSHOT (2022)
             11.1.4 TAKEDA PHARMACEUTICAL COMPANY LIMITED
                        TABLE 136 TAKEDA PHARMACEUTICAL COMPANY LIMITED: BUSINESS OVERVIEW
                        FIGURE 37 TAKEDA PHARMACEUTICAL COMPANY LIMITED: COMPANY SNAPSHOT (2022)
             11.1.5 ANTEROGEN CO., LTD.
                        TABLE 137 ANTEROGEN CO., LTD.: BUSINESS OVERVIEW
             11.1.6 CORESTEM, INC.
                        TABLE 138 CORESTEM INC.: BUSINESS OVERVIEW
                        FIGURE 38 CORESTEM INC.: COMPANY SNAPSHOT (2021)
             11.1.7 PHARMICELL CO., LTD
                        TABLE 139 PHARMICELL CO., LTD: BUSINESS OVERVIEW
             11.1.8 NUVASIVE, INC.
                        TABLE 140 NUVASIVE, INC.: BUSINESS OVERVIEW
                        FIGURE 39 NUVASIVE, INC.: COMPANY SNAPSHOT (2022)
             11.1.9 RTI SURGICAL
                        TABLE 141 RTI SURGICAL: BUSINESS OVERVIEW
             11.1.10 ALLOSOURCE
                        TABLE 142 ALLOSOURCE: BUSINESS OVERVIEW
             11.1.11 HOLOSTEM TERAPIE AVANZATE SRL
                        TABLE 143 HOLOSTEM TERAPIE AVANZATE SRL: BUSINESS OVERVIEW
             11.1.12 ORTHOFIX MEDICAL INC.
                        TABLE 144 ORTHOFIX MEDICAL INC.: BUSINESS OVERVIEW
                        FIGURE 40 ORTHOFIX MEDICAL INC.: COMPANY SNAPSHOT (2022)
             11.1.13 STEMPEUTICS RESEARCH PVT LTD.
                        TABLE 145 STEMPEUTICS RESEARCH PVT LTD.: BUSINESS OVERVIEW
             11.1.14 REGROW BIOSCIENCES PVT LTD.
                        TABLE 146 REGROW BIOSCIENCES PVT LTD.: BUSINESS OVERVIEW
     11.2 OTHER PLAYERS 
             11.2.1 ATHERSYS, INC.
                        TABLE 147 ATHERSYS, INC.: BUSINESS OVERVIEW
             11.2.2 MESOBLAST LTD.
                        TABLE 148 MESOBLAST LTD.: BUSINESS OVERVIEW
             11.2.3 BIORESTORATIVE THERAPIES, INC.
                        TABLE 149 BIORESTORATIVE THERAPIES, INC.: BUSINESS OVERVIEW
             11.2.4 PLURISTEM THERAPEUTICS INC.
                        TABLE 150 PLURISTEM THERAPEUTICS INC.: BUSINESS OVERVIEW
             11.2.5 BRAINSTORM CELL LIMITED
                        TABLE 151 BRAINSTORM CELL LIMITED: BUSINESS OVERVIEW
             11.2.6 GAMIDA CELL
                        TABLE 152 GAMIDA CELL: BUSINESS OVERVIEW
             11.2.7 VIACYTE, INC.
                        TABLE 153 VIACYTE, INC.: BUSINESS OVERVIEW
             11.2.8 KANGSTEM BIOTECH CO., LTD.
                        TABLE 154 KANGSTEM BIOTECH CO., LTD.: BUSINESS OVERVIEW
             11.2.9 HOPE BIOSCIENCES
                        TABLE 155 HOPE BIOSCIENCES: BUSINESS OVERVIEW
             11.2.10 CELLULAR BIOMEDICINE GROUP
                        TABLE 156 CELLULAR BIOMEDICINE GROUP: BUSINESS OVERVIEW
             11.2.11 PERSONALIZED STEM CELLS
                        TABLE 157 PERSONALIZED STEM CELLS: BUSINESS OVERVIEW
 
*Details on Business Overview, Products Offered, Recent Developments, and MnM View (Key strengths/Right to Win, Strategic Choices Made, and Weaknesses and Competitive Threats) might not be captured in case of unlisted companies.
 
12 APPENDIX (Page No. - 197)
     12.1 DISCUSSION GUIDE 
     12.2 KNOWLEDGESTORE: MARKETSANDMARKETS’ SUBSCRIPTION PORTAL 
     12.3 CUSTOMIZATION OPTIONS 
     12.4 RELATED REPORTS 
     12.5 AUTHOR DETAILS 

This study involved four major activities in estimating the current size of the stem cell therapy market. Exhaustive secondary research was carried out to collect information on the market, its peer markets, and its parent market. The next step was to validate these findings, assumptions, and sizing with industry experts across the value chain through primary research. Both top-down and bottom-up approaches were employed to estimate the complete market size. After that, market breakdown and data triangulation procedures were used to estimate the market size of segments and subsegments.

Secondary Research

Secondary research was used mainly to identify and collect information for the extensive technical, market-oriented, and commercial study of the stem cell therapy market. The secondary sources used for this study include Some of the key secondary sources referred to for this study include publications from government sources World Health Organization, Organisation for Economic Co-operation and Development, The World Bank, US Census Bureau, International Society for Stem Cell Research (US), National Stem Cell Foundation (US), International Society for Cellular Therapy (ISCT), EuroStemCell, European Society of Gene and Cell Therapy, German Stem Cell Network, Japan Human Cell Society, Chinese Stem Cell Foundation, Brazilian Association of Cell Therapy, Alliance for Regenerative Medicine (ARM)]. These sources were also used to obtain key information about major players, market classification, and segmentation according to industry trends, regional/country-level markets, market developments, and technology perspectives.

Primary Research

In-depth interviews were conducted with various primary respondents, including key industry participants, subject-matter experts (SMEs), C-level executives of key market players, and industry consultants, among other experts, to obtain and verify the critical qualitative and quantitative information as well as assess future prospects of the market. Various primary sources from both the supply and demand sides of the market were interviewed to obtain qualitative and quantitative information. The following is a breakdown of the primary respondents:

Stem Cell Therapy Market Size, and Share

To know about the assumptions considered for the study, download the pdf brochure

Market Size Estimation

The global size of the stem cell therapy market was estimated through multiple approaches. A detailed market estimation approach was followed to estimate and validate the value of the market and other dependent submarkets. These methods were also used extensively to estimate the size of various subsegments in the market. The research methodology used to estimate the market size includes the following:

  • The major players in the industry and market have been identified through extensive primary and secondary research.
  • The revenues generated from the stem cell therapy business of players operating in the market have been determined through secondary research and primary analysis.
  • All percentage shares, splits, and breakdowns have been determined using secondary sources and verified through primary sources.

Market Size Estimation Methodology-Bottom-up approach

Stem Cell Therapy Market Size, and Share

To know about the assumptions considered for the study, Request for Free Sample Report

Top-down Approach-

Stem Cell Therapy Market Size, and Share

Data Triangulation

After estimating the overall market size from the market size estimation process, the total market was split into several segments and subsegments. To complete the overall market engineering process and arrive at the exact statistics for all segments and subsegments, data triangulation and market breakdown procedures were employed, wherever applicable. The data was triangulated by studying various factors and trends from both the demand and supply sides.

Market Definition

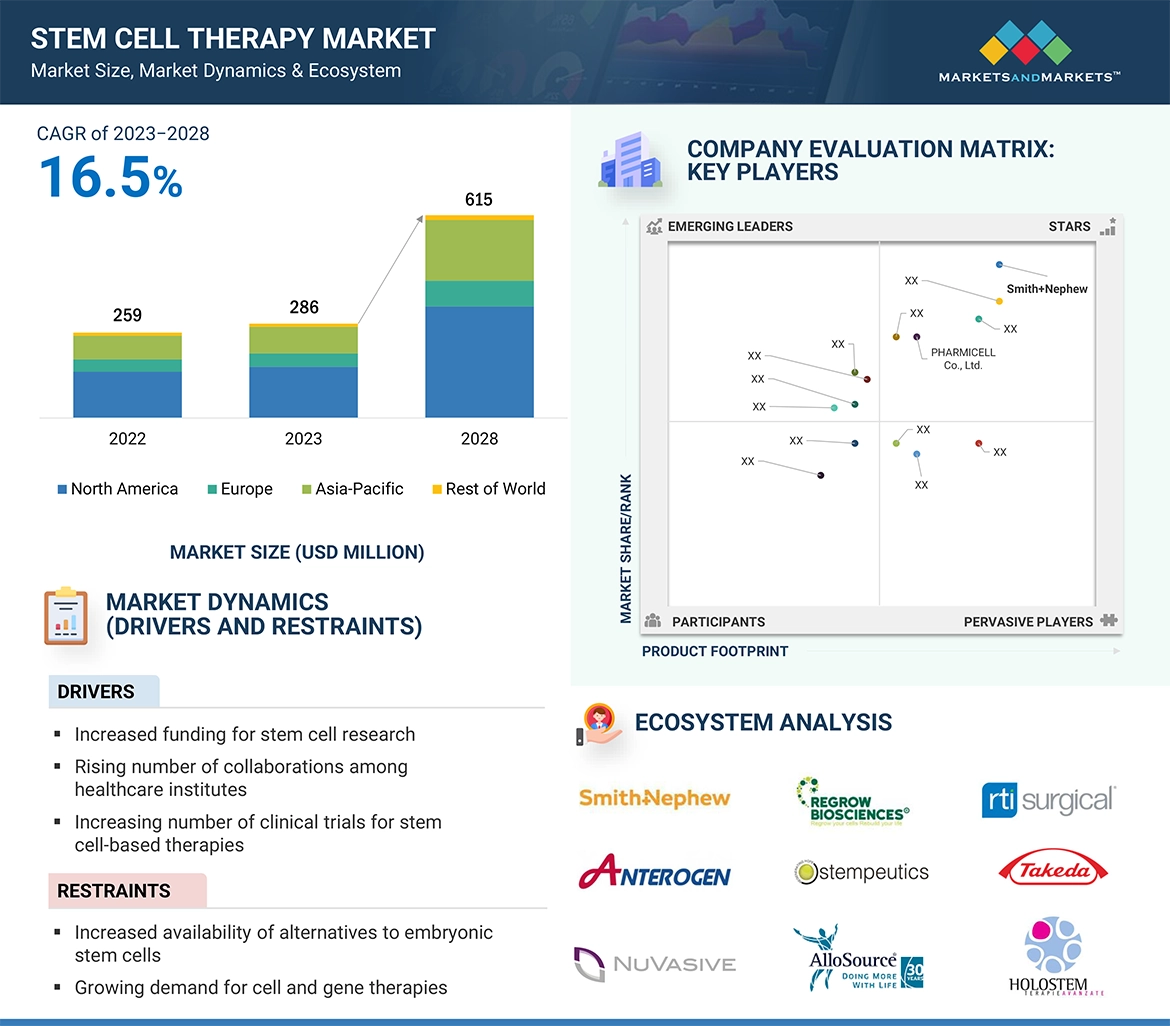
Stem cells, characterized by their undifferentiated nature, possess a distinct capacity to transform into specialized cell types with specific functions. Stem cell therapy, a medical intervention, utilizes these cells to address and mitigate diseases and injuries. These stem cells can be procured from various sources such as umbilical Cord, bone-marrow, embryo, adipose (fat) tissue, blood, and the brain among others. Stem cell therapy is currently being utilized for a diverse range of disease conditions.

Key Stakeholders

  • Stem cell Research Institutes
  • Cancer research institutes
  • Stem cell therapy raw material suppliers
  • Biotechnology & biopharmaceutical companies
  • Drug manufacturers, vendors, and distributors
  • Academic & government research institutes
  • Venture capitalists & investors
  • Government organizations
  • Private research firms
  • Academic & Research Institutes
  • Research & development (R&D) companies
  • Hospitals and Speciality Clinics

The main objectives of this study are as follows:

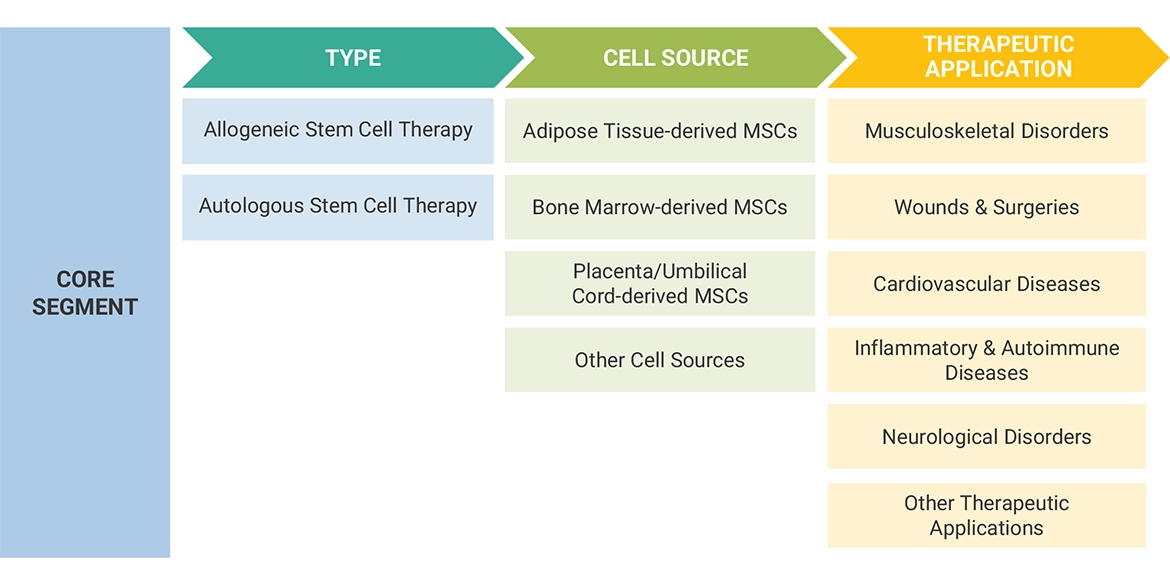
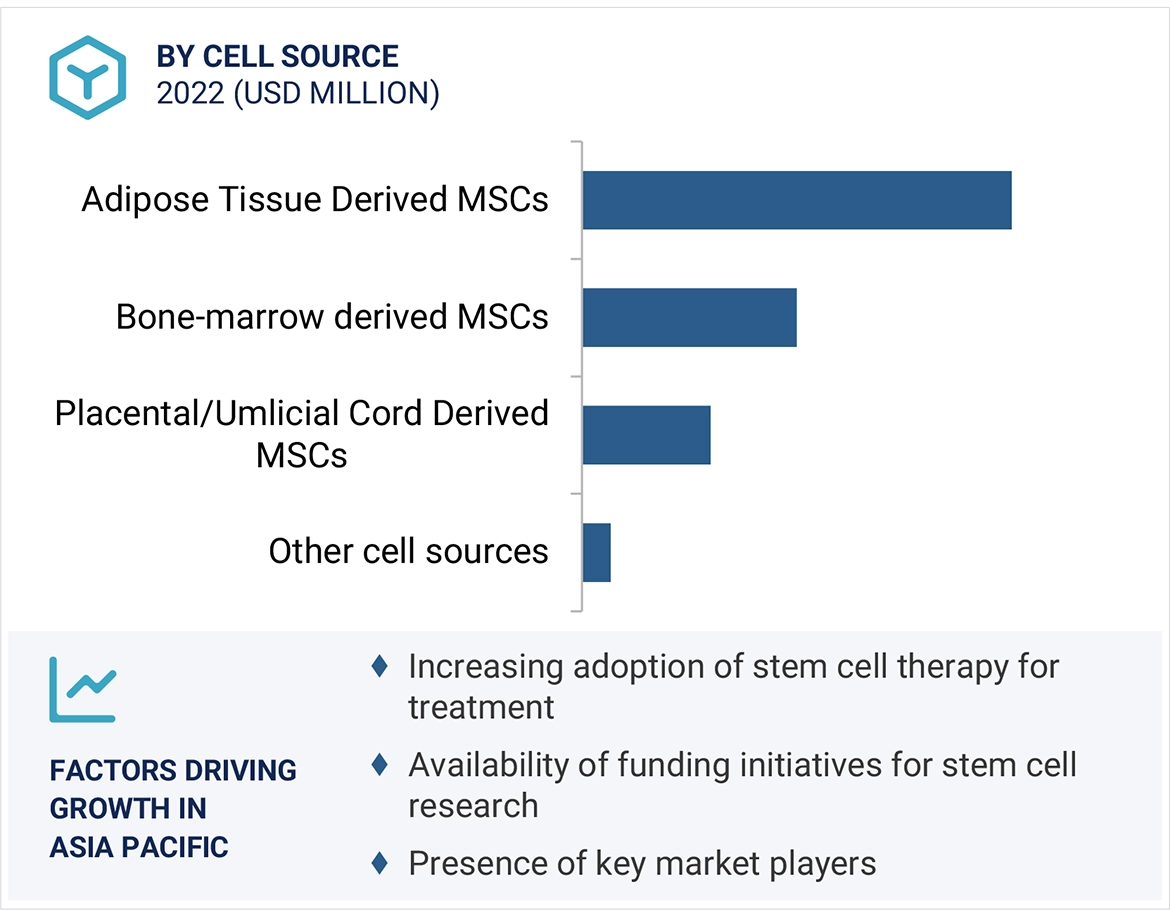
  • To define, describe, and forecast the stem cell therapy market based on type, cell source, therapeutic application and region
  • To provide detailed information regarding the major factors influencing the growth of the market (such as drivers, restraints, challenges, opportunities and trends)
  • To strategically analyze micromarkets with respect to individual growth trends, future prospects, and contributions to the overall stem cell therapy market
  • To analyze opportunities in the market for stakeholders and provide details of the competitive landscape for market leaders
  • To forecast the size of the market segments with respect to five main regions, namely, North America, Europe, Asia Pacific, Rest of the World
  • To strategically profile the key players and comprehensively analyze their product portfolios, market positions, and core competencies
  • To track and analyze competitive developments such as acquisitions, product launches, expansions, agreements, partnerships, and R&D activities in the stem cell therapy market.

Available Customizations

With the given market data, MarketsandMarkets offers customizations as per the company’s specific needs. The following customization options are available for this report:

  • Country-wise Information: Analysis for additional countries (up to five)
  • Company Information: Detailed analysis and profiling of additional market players (up to five)
Custom Market Research Services

We will customize the research for you, in case the report listed above does not meet with your exact requirements. Our custom research will comprehensively cover the business information you require to help you arrive at strategic and profitable business decisions.

Request Customization

Instant Answers with GPT - Ask Now!

Ask real questions. Get complete answers !
Report Code
BT 5049
Published ON
Dec, 2023
Choose License Type
BUY NOW
  • SHARE
X
Request Customization
Speak to Analyst
Speak to Analyst
OR FACE-TO-FACE MEETING
PERSONALIZE THIS RESEARCH
  • Triangulate with your Own Data
  • Get Data as per your Format and Definition
  • Gain a Deeper Dive on a Specific Application, Geography, Customer or Competitor
  • Any level of Personalization
REQUEST A FREE CUSTOMIZATION
LET US HELP YOU!
  • What are the Known and Unknown Adjacencies Impacting the Stem Cell Therapy Market
  • What will your New Revenue Sources be?
  • Who will be your Top Customer; what will make them switch?
  • Defend your Market Share or Win Competitors
  • Get a Scorecard for Target Partners
CUSTOMIZED WORKSHOP REQUEST
+1-888-600-6441
  • Call Us
  • +1-888-600-6441 (Corporate office hours)
  • +1-888-600-6441 (US/Can toll free)
  • +44-800-368-9399 (UK office hours)
CONNECT WITH US
ABOUT TRUST ONLINE
©2024 MarketsandMarkets Research Private Ltd. All rights reserved
DMCA.com Protection Status Website Feedback