In this research, the use of primary as well as secondary sources was executed. This comprised finding the factors impacting the industry to ascertain the segmentation types, key players, competitive landscape, market dynamics, and strategies adopted by prominent players.
Secondary Research
Directories, databases like D&B Hoovers, Factiva, white papers, Bloomberg Businessweek, annual reports, SEC filings, business filings, investor presentations, and the compilation of an industry leaders database are some of the methods used in the secondary research. This would aid in providing fundamental details about important companies and market segmentation according to industry trends at different levels, significant market advancements, and technological viewpoints relevant to the sports medicine market.
Primary Research
The report's primary research involved conducting interviews with a diverse range of sources from both the supply and demand sides in order to produce both quantitative and qualitative data. CEOs, area sales managers, territory sales managers, regional sales managers and other important officials from top businesses and organizations represented the industries as primary sources on the supply side. Physiotherapists, physicians, surgeons, department heads, and staff members from physiotherapy centers, hospitals and ambulatory surgical centers were among the primary sources on the demand side. The purpose of this primary study was to confirm market segmentation, pinpoint important market participants, and provide a summary of the important market dynamics and trends.
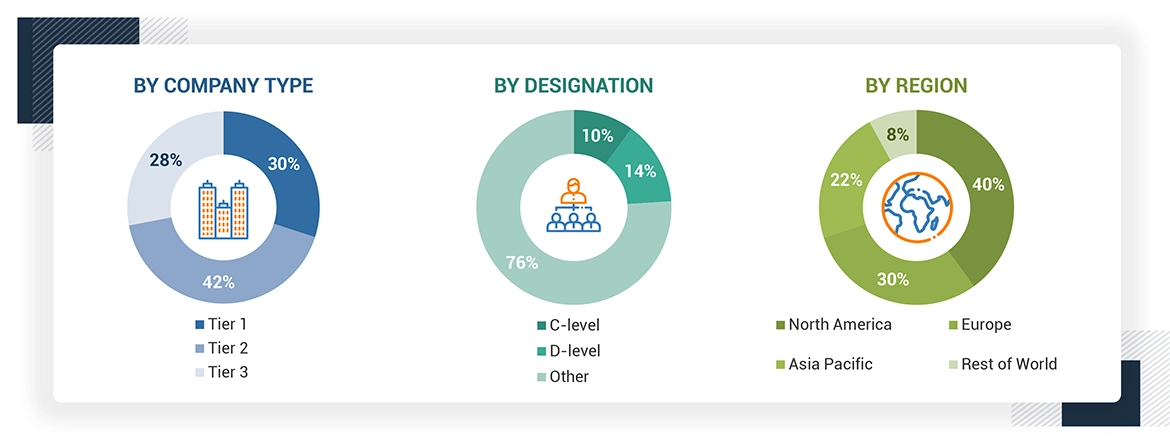
A breakdown of the primary respondents is provided below:
To know about the assumptions considered for the study, download the pdf brochure
*Others include sales managers, marketing managers, business development managers, product managers, distributors, and suppliers.
Note: Companies are classified into tiers based on their total revenue. As of 2023, Tier 1 = >USD 1 billion, Tier 2 = < USD 500 million, and Tier 3 = < USD 100 million.
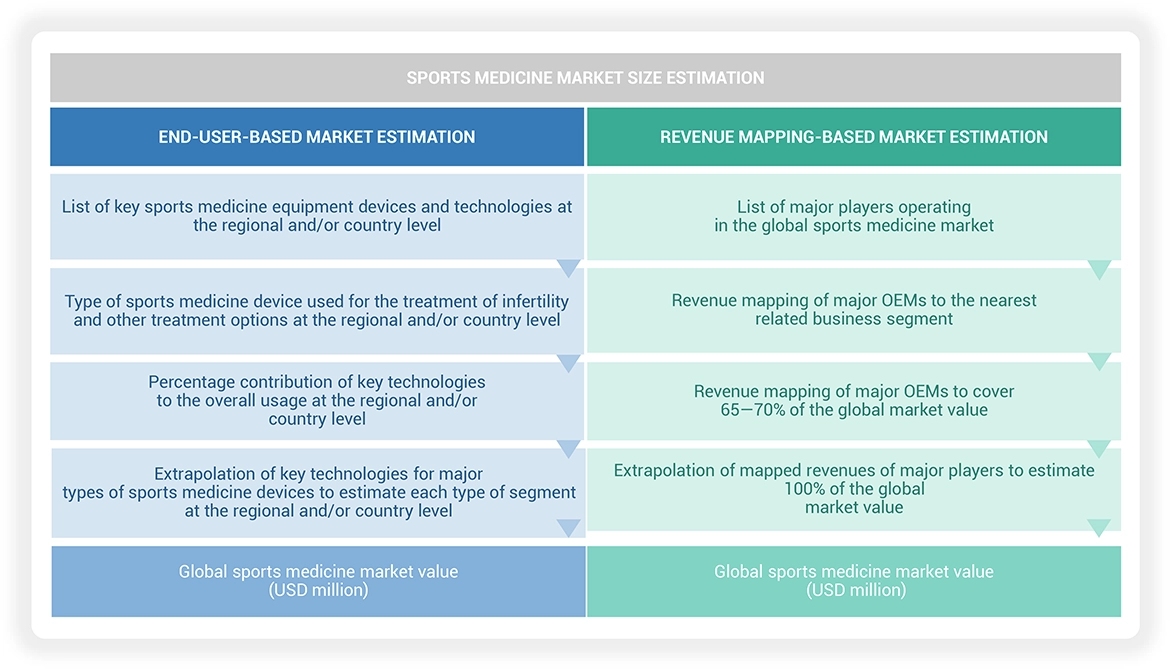
Market Size Estimation
The revenue share analysis of the major players for the size of the sports medicine market is also presented in this study. Primary and secondary research are used to identify important market players in the sports medicine area and provide insights into their revenue streams. The primary research approach comprises extremely in-depth interviews with CEOs, directors, and senior marketing executives, while the secondary research procedure mostly relied on the annual and financial reports of major players. Segment-based technique was used to determine the global market value. The revenue information of significant solution and service suppliers was then used to source these segmented revenues.
Data Triangulation
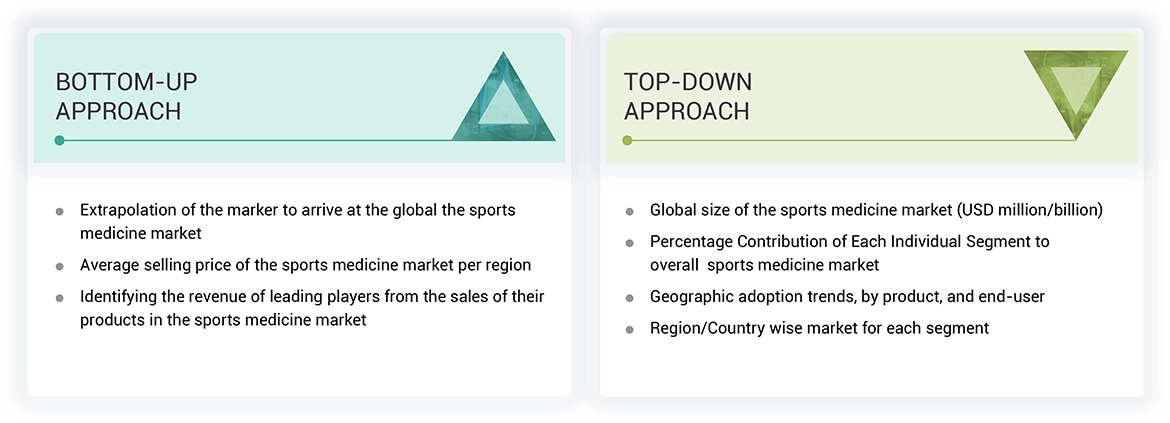
The Sports medicine market was segmented under various categories and subcategories using the above-mentioned methodology. Thereafter, proper data triangulation and the market segmentation process are carried out to further increase the accuracy of the data for each segment. Factors and trends from both the demand and supply sides were studied. Rigorous employment of both top-down and bottom-up approaches provided the result of the analysis of the sports medicine market.
Market Definition
The sports medicine market covers an exclusive range of products and technologies that are developed to avoid, diagnose and manage sports related injuries. It is a market that constitutes hospitals, physiotherapy centers and ambulatory surgical centers and even research institutions that offer sports medicine associated therapies and related services, including implants, braces and supports, arthroscopy, surgicals, prosthetics, orthobiologics, physiotherapy equipment and compression clothing. It also comprises the accessories such as tapes, wraps and pads that are helpful in offering support and preventing injury. Sports medicine market has been applied as a broad word describing the portfolio of wide range of products and technologies that provide relief to the athletes from sports injury.
Stakeholders
-
Manufacturers of Sports Medicine Devices
-
Clinical Research Laboratories
-
Healthcare Service Providers (Hospitals, Physiotherapy centers and Ambulatory surgical centers)
-
Market Share and Consulting Firms
-
Medical Device Suppliers, Distributors, Channel Partners, and Third-party Suppliers
-
Academic Medical Centers and Universities
-
Business Research and Consulting Service Providers
-
Venture Capitalists and Other Government Funding Organizations
Report Objectives
-
To define, describe, and forecast the global in sports medicine market by product, by application, end-user, and region
-
To provide detailed information regarding the major factors influencing the market growth (such as drivers, restraints, opportunities, and challenges)
-
To strategically analyze the micromarkets1 with respect to individual growth trends, prospects, and contributions to the total market
-
To analyze the opportunities in the market for stakeholders and provide details of the competitive landscape for market leaders
-
To profile the key market players and comprehensively analyze their market shares and core competencies
-
To track and analyze competitive developments, such as product launches & approvals, agreements, partnerships, acquisitions, and collaborations, in the sports medicine market


 HIGHEST CAGR MARKET IN 2023


Growth opportunities and latent adjacency in Sports Medicine Market