Sugar Decorations & Inclusions Market by Type (Jimmies, Quins, Dragees, Nonpareils, Single Pieces, Caramel Inclusions, and Sanding & Coarse Sugar), Colorant (Natural and Artificial), Application, End User, and Region - Global Forecast to 2025


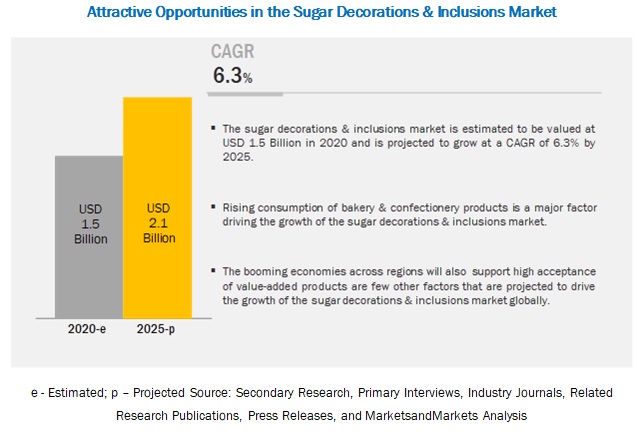
[215 Pages Report] The global sugar decorations & inclusions market size is projected to reach USD 2.1 billion by 2025, recording a compound annual growth rate (CAGR) of 6.3% during the forecast period. The increasing demand for bakery and confectionery products across regions, along with a high demand for value-added products, are some of the major factors that are projected to drive the growth of the sugar decorations & inclusions market during the forecast period. Furthermore, the shift in consumer trends, such as an increase in the preference for appealing, textured, and flavored food products are projected to encourage the market growth.
The jimmies segment is estimated to be the largest and fastest-growing segment, on the basis of type, in the sugar decorations & inclusions market.
Jimmies are widely used for decorations in bakery products, ice-creams, and frozen desserts. The growing bakery sector across regions has led to an increase in demand for jimmies, which are also readily available in grocery stores across regions.
On the basis of colorant, the natural colorant segment is projected to be the fastest-growing during the forecast period.
By colorant, the natural segment is projected to be the fastest-growing segment. The changing preferences and rising awareness about the overall health of individuals have led to an increase in the number of people opting for natural colorants over the synthetic ones. The increasing use of plant-extracts will also drive the demand for natural colorants in sugar decorations and inclusions. The trend of using clean-label will further encourage the use of natural colors in the sugar decorations & inclusions market.
The cakes & pastries segment, on the basis of application, is projected to dominate the market during the forecast period.
Sugar decorations and inclusions are widely used in the bakery industry. They are used for cake decoration supplies and as add-ins for bakery products, such as cakes and pastries. The major use of sugar sprinkles and sugar inclusions in cakes & pastries is projected to drive the growth of this segment during the forecast period.
On the basis of end user, the foodservice industry segment is projected to hold the largest market share during the forecast period.
On the basis of end user, the foodservice industry segment is projected to hold the largest market share due to the increasing number of restaurants, cafes, and hotels across regions. The growing consumption of confectioneries and desserts in foodservice outlets and a high preference for flavored, textured, and appealing products by consumers is projected to contribute to the growth of this segment.
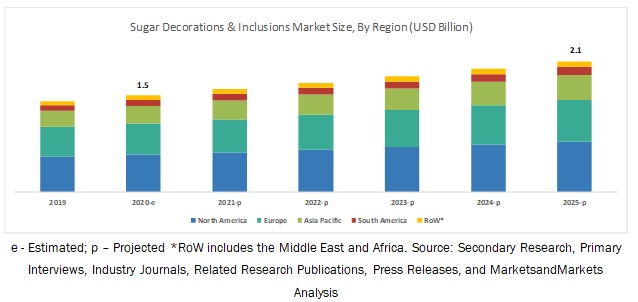
Asia Pacific is projected to account for the fastest growth in the sugar decorations & inclusions market during the forecast period.
The Asia Pacific region is projected to be the fastest-growing market during the forecast period. The growth of the market in this region is majorly driven by the rising consumption of convenience bakery products, such as cakes & pastries. Consumers in Asian countries are increasingly accepting international cuisines and flavors, which is encouraging established brands and new bakeries to invest in sugar sprinkles. In addition, the increase in demand for value-added products in the region, supported by the growing economy, is further projected to drive the growth of the market.
Key Market Players
Key players in the global sugar decorations & inclusions market include Dr. Oetker (Germany), Kerrry Inc. (Ireland), Barry Callebaut (Switzerland), The Kraft Heinz Company (US), Pecan Deluxe Candy Company (US), Signature Brands LLC (US), Hanns G. Werner GmBH + Co.KG (Germany), Carroll Industries NZ Ltd. (New Zealand), Cape Foods (South Africa), and Paulaur Corporation (US). These players have broad industry coverage and high operational and financial strength.
Scope of the Report
|
Report Metric |
Details |
|
Market size available for years |
2018–2025 |
|
Base year considered |
2019 |
|
Forecast period |
2020–2025 |
|
Forecast units |
Value (USD Million), Volume (KT and Ton) |
|
Segments covered |
Application, Type, Colorant, End User, and Region |
|
Geographies covered |
North America, Europe, Asia Pacific, South America, and RoW |
|
Companies covered (20 companies) |
Dr. Oetker (Germany), Kerrry Inc. (Ireland), Barry Callebaut (Switzerland), The Kraft Heinz Company (US), Pecan Deluxe Candy Company (US), Signature Brands LLC (US), Hanns G. Werner GmBH + Co.KG (Germany), Carroll Industries NZ Ltd. (New Zealand), Cape Foods (South Africa), Paulaur Corporation (US), The American Sprinkle Company (US), The Baker’s Kitchen (US), Xiamen Yasin Industry & Trade Co, Ltd. (China), Girrbach Subwarendekor GMH (Germany), Twinkle sprinkles (Australia), Nimbus Foods Ltd. (UK), Cacau Foods (Brazil), Gunthart (Germany), Britannia Superfine (UK), and Shantou Hehe Technology Co, Ltd. (China). |
This research report categorizes the sugar decorations & inclusions market based on type, application, colorant, end user, and region.
Based on type, the sugar decorations & inclusions market has been segmented as follows:
- Jimmies
- Quins
- Dragees
- Nonpareils
- Caramel inclusions
- Sanding & course sugar
- Single pieces
Based on application, the market for sugar decorations & inclusions has been segmented as follows:
- Cereals & snack bars
- Ice-creams & frozen desserts
- Chocolates & confectionery products
- Cakes & pastries
- Other bakery applications
Based on colorant, the market for sugar decorations & inclusions has been segmented as follows:
- Artificial
- Natural
Based on end user, the sugar decorations & inclusions market has been segmented as follows:
-
Food manufacturers
- Cakes & pastries
- Ice-cream
- Chocolates & confectionery products
- Cereals & snack bars
-
Foodservice industry
- Hotel, restaurants, and cafes
- Ice-cream parlors
- Cakes & pastry shops
- Home bakers
Based on region, the sugar decorations & inclusions market has been segmented as follows:
- North America
- Europe
- Asia Pacific
- South America
- RoW (the Middle East and Africa)
Recent Developments:
- In October 2018, Paulaur Corporation (US) introduced non-GMO verified dessert toppings after witnessing a growing consumer demand for clean-labeled and natural products.
- In October 2018, European inclusions pioneer, Pecan Deluxe Candy Company (US), launched its newly upgraded and extended manufacturing facilities for its confectionery operations in its UK headquarters in Yorkshire.
Key questions addressed by the report:
- Who are the major market players in the sugar decorations & inclusions market?
- What are the regional growth trends and the largest revenue-generating regions for the sugar decorations & inclusions market?
- What are the major applications of sugar decorations and inclusions that are projected to account for a major revenue share during the forecast period?
- What are the major end-user segments that witness increased usage of sugar decorations & inclusions, and which segment is projected to dominate during the forecast period?
- What are the major types of sugar decorations & inclusions in the industry, and which type is projected to account for the largest share during the forecast period?
To speak to our analyst for a discussion on the above findings, click Speak to Analyst
 Exclusive indicates content/data unique to MarketsandMarkets and not available with any competitors.
TABLE OF CONTENTS
1 INTRODUCTION (Page No. - 23)
1.1 OBJECTIVES OF THE STUDY
1.2 MARKET DEFINITION
1.3 STUDY SCOPE
1.4 REGIONS COVERED
1.5 PERIODIZATION CONSIDERED
1.6 CURRENCY CONSIDERED
1.7 STAKEHOLDERS
2 RESEARCH METHODOLOGY (Page No. - 28)
2.1 RESEARCH DATA
2.1.1 SECONDARY DATA
2.1.1.1 Key Data from Secondary Sources
2.1.2 PRIMARY DATA
2.1.2.1 Key Data from Primary Sources
2.1.2.2 Breakdown of Primaries
2.2 MARKET SIZE ESTIMATION
2.2.1 APPROACH ONE (BASED ON APPLICATION, BY REGION)
2.2.2 APPROACH TWO (BASED ON THE GLOBAL MARKET)
2.3 DATA TRIANGULATION
2.4 ASSUMPTIONS FOR THE STUDY
2.5 LIMITATIONS OF THE STUDY
3 EXECUTIVE SUMMARY (Page No. - 37)
4 PREMIUM INSIGHTS (Page No. - 43)
4.1 ATTRACTIVE OPPORTUNITIES IN THE SUGAR DECORATIONS & INCLUSIONS MARKET
4.2 SUGAR DECORATIONS & INCLUSIONS MARKET, BY TYPE
4.3 MARKET, BY APPLICATION
4.4 MARKET, BY COLORANT
4.5 MARKET, BY END USER
4.6 NORTH AMERICA: MARKET, BY TYPE AND COUNTRY
4.7 SUGAR DECORATIONS & INCLUSIONS MARKET, BY COUNTRY
5 MARKET OVERVIEW (Page No. - 48)
5.1 INTRODUCTION
5.2 MARKET DYNAMICS
5.2.1 DRIVERS
5.2.1.1 Rise in the consumption of confectionaries & bakery products across regions
5.2.1.2 Increase in demand for value-added food products
5.2.2 RESTRAINTS
5.2.2.1 Fluctuations in the raw material pricing
5.2.2.2 Adverse side-effects of synthetic additives used in sugar sprinkles
5.2.2.3 Sluggish growth rate due to the rise in the number of health-conscious people avoiding sugar
5.2.3 OPPORTUNITIES
5.2.3.1 Development of low-calorie and healthy sugar decorations and inclusions
5.2.3.2 Rising demand for sugar decorations and inclusions from emerging markets, such as China, India, Brazil, and the Middle East
5.2.4 CHALLENGES
5.2.4.1 Threat of substitute products
5.3 SUPPLY CHAIN ANALYSIS
5.4 YC YCC SHIFT
6 SUGAR DECORATIONS & INCLUSIONS MARKET, BY TYPE (Page No. - 56)
6.1 INTRODUCTION
6.2 JIMMIES
6.2.1 EASY AVAILABILITY OF JIMMIES IN GROCERY STORES TO DRIVE THE MARKET GROWTH
6.3 QUINS
6.3.1 AVAILABILITY OF NUT-FREE, GM-FREE, GLUTEN-FREE, AND LACTOSE-FREE QUINS TO DRIVE THE DEMAND
6.4 DRAGEES
6.4.1 DRAGEES ENHANCE THE APPEARANCE OF CONFECTIONERY AND BAKERY PRODUCTS
6.5 NONPAREILS
6.5.1 NONPAREILS ARE USEFUL FOR ENHANCING THE APPEARANCE OF WEDDING CAKES
6.6 CARAMEL INCLUSIONS
6.6.1 CARAMEL INCLUSIONS HELP IN ENRICHING THE TASTE OF FOOD PRODUCTS
6.7 SANDING & COURSE SUGAR
6.7.1 SANDING & COURSE SUGAR IMPROVE THE TASTE AND APPEARANCE OF PRODUCTS
6.8 SINGLE PIECES
6.8.1 SINGLE PIECES MAKE THE APPEARANCE OF PRODUCTS MORE APPEALING
7 SUGAR DECORATIONS & INCLUSIONS MARKET, BY COLORANT (Page No. - 67)
7.1 INTRODUCTION
7.2 NATURAL
7.2.1 NATURAL COLORANTS ARE USED IN MANUFACTURING SPRINKLES DUE TO THE INCREASING DEMAND FOR CLEAN-LABEL INGREDIENTS
7.3 ARTIFICIAL
7.3.1 SYNTHETIC FOOD COLORS DOMINATE THE EMERGING MARKETS AND ARE LESS EXPENSIVE
8 SUGAR DECORATIONS & INCLUSIONS MARKET, BY APPLICATION (Page No. - 73)
8.1 INTRODUCTION
8.2 CEREALS & SNACK BARS
8.2.1 INCLUSIONS ARE MAJORLY USED IN CEREALS & SNACK BARS TO ENHANCE THEIR TEXTURE
8.3 ICE-CREAM & FROZEN DESSERTS
8.3.1 SPRINKLES ARE MAJORLY USED DECORATIONS ON ICE-CREAMS & FROZEN DESSERTS TO INCREASE THEIR APPEAL
8.4 CHOCOLATE & CONFECTIONERY PRODUCTS
8.4.1 SPRINKLES WITNESS A HIGH DEMAND IN CHOCOLATE AND CONFECTIONERY PRODUCTS FOR IMPROVED AESTHETIC VALUE
8.5 CAKES & PASTRIES
8.5.1 CAKES & PASTRIES ARE THE KEY PRODUCTS THAT WITNESS SIGNIFICANT APPLICATION OF SUGAR DECORATIONS AND INCLUSIONS
8.6 OTHER BAKERY APPLICATIONS
9 SUGAR DECORATIONS & INCLUSIONS MARKET, BY END USER (Page No. - 82)
9.1 INTRODUCTION
9.2 FOOD MANUFACTURERS
9.2.1 CEREALS & SNACK BARS
9.2.1.1 Inclusions are increasingly used in cereals and snack bars for enhancing the texture
9.2.2 CAKES & PASTRIES
9.2.2.1 Sugar sprinkles and inclusions enhance the appearance of cakes & pastries
9.2.3 CHOCOLATE & CONFECTIONERY
9.2.3.1 Sugar decorations and inclusions improve the taste and texture of chocolate and confectionery products
9.2.4 ICE-CREAMS
9.2.4.1 The development in the ice-cream and other dairy product industries is projected to drive the market growth
9.3 FOODSERVICE INDUSTRY
9.3.1 HOTEL, RESTAURANTS, AND CAFES
9.3.1.1 Increasing number of hotels, restaurants, and cafes serving desserts to drive the growth
9.3.2 BAKERY & PASTRY SHOPS
9.3.2.1 Rising consumption of bakery and confectionery products to drive the demand
9.3.3 ICE-CREAM PARLORS
9.3.3.1 Decorations and inclusions enhance the texture and appearance of ice creams
9.4 HOME BAKERS
9.4.1 INCREASING NUMBER OF HOME BAKERS AND THE EXPANSION OF E-COMMERCE PLATFORMS TO DRIVE THE MARKET GROWTH
10 SUGAR DECORATIONS & INCLUSIONS MARKET, BY REGION (Page No. - 94)
10.1 INTRODUCTION
10.2 NORTH AMERICA
10.2.1 US
10.2.1.1 Presence of a large number of bakeries and restaurants to drive the growth of the snacks market in the US
10.2.2 CANADA
10.2.2.1 Increase in the disposable income of Canadians create lucrative opportunities for manufacturers in the sugar decorations & inclusions market
10.2.3 MEXICO
10.2.3.1 Increase in the number of grocery stores in Mexico is projected to drive the growth of the sugar decorations & inclusions market
10.3 EUROPE
10.3.1 GERMANY
10.3.1.1 The high economic growth of Germany is projected to drive the market growth of bakery ingredients
10.3.2 FRANCE
10.3.2.1 France to be a major consumer of sugar decorations and inclusions due to the increasing consumption of bakery products
10.3.3 ITALY
10.3.3.1 Established ice-cream and bakery industries in Italy to drive the growth of the sugar decorations & inclusions market
10.3.4 UK
10.3.4.1 Increasing use of sugar decorations in the bakery industry to drive the demand in the UK
10.3.5 SPAIN
10.3.5.1 Increase in the number of artisanal bakers in Spain to drive the growth of the sprinkle market
10.3.6 NETHERLANDS
10.3.6.1 Growing consumption of dairy products and bakery products have led to high growth potential for manufacturers in the Netherlands
10.3.7 REST OF EUROPE
10.4 ASIA PACIFIC
10.4.1 CHINA
10.4.1.1 Increasing consumption of premium quality products to drive the market growth
10.4.2 JAPAN
10.4.2.1 Changing consumer lifestyles and food preferences to drive the demand for sugar decorations
10.4.3 INDIA
10.4.3.1 Increasing inclination of consumers toward western diets and the willingness to try innovative product offerings to drive the market growth
10.4.4 AUSTRALIA & NEW ZEALAND
10.4.4.1 Increasing willingness of consumers to opt for innovative products is driving the market growth
10.4.5 REST OF ASIA PACIFIC
10.5 SOUTH AMERICA
10.5.1 BRAZIL
10.5.1.1 Busy lifestyle of consumers to drive the demand for confectioneries and ready-to-eat food products
10.5.2 ARGENTINA
10.5.2.1 Increasing demand for specialty foods and consumer willingness to try innovative flavors is driving the market growth
10.5.3 REST OF SOUTH AMERICA
10.6 REST OF THE WORLD
10.6.1 MIDDLE EAST
10.6.1.1 Adoption of western culture and diets due to globalization is projected to drive the sugar decoration & inclusions market in the Middle East
10.6.2 AFRICA
10.6.2.1 Growing consumption for sweet baked products to encourage the demand for sugar sprinkles in the country
11 COMPETITIVE LANDSCAPE (Page No. - 174)
11.1 OVERVIEW
11.2 COMPETITIVE LEADERSHIP MAPPING, 2018
11.2.1 VISIONARY LEADERS
11.2.2 INNOVATORS
11.2.3 DYNAMIC DIFFERENTIATORS
11.2.4 EMERGING COMPANIES
11.3 COMPETITIVE SCENARIO
11.3.1 MARKET EVALUATION FRAMEWORK, 2017–2019
12 COMPANY PROFILES (Page No. - 178)
12.1 DR. OETKER
12.2 KERRY INC.
12.3 BARRY CALLEBAUT
12.4 THE KRAFT HEINZ COMPANY
12.5 PECAN DELUXE CANDY COMPANY
12.6 SIGNATURE BRANDS, LLC
12.7 HANNS G. WERNER GMBH + CO. KG
12.8 CARROLL INDUSTRIES NZ LTD
12.9 CAPE FOODS
12.10 PAULAUR CORPORATION
12.11 THE AMERICAN SPRINKLE COMPANY
12.12 THE BAKER’S KITCHEN
12.13 XIAMEN YASIN INDUSTRY & TRADE CO, LTD
12.14 GIRRBACH-SÜßWARENDEKOR GMH
12.15 TWINKLE SPRINKLES
12.16 NIMBUS FOODS LTD
12.17 CACAU FOODS
12.18 GUNTHART
12.19 BRITANNIA SUPERFINE
12.20 SHANTOU HEHE TECHNOLOGY CO, LTD
13 APPENDIX (Page No. - 207)
13.1 KNOWLEDGE STORE: MARKETSANDMARKETS’ SUBSCRIPTION PORTAL
13.2 AVAILABLE CUSTOMIZATIONS
13.3 RELATED REPORTS
13.4 AUTHOR DETAILS
LIST OF TABLES (237 Tables)
TABLE 1 USD EXCHANGE RATES CONSIDERED, 2017–2019
TABLE 2 SUGAR DECORATIONS & INCLUSIONS MARKET SNAPSHOT, 2020 VS. 2025
TABLE 3 SUGAR DECORATIONS & INCLUSIONS MARKET SIZE, BY TYPE, 2018–2025 (USD MILLION)
TABLE 4 SUGAR DECORATIONS & INCLUSIONS MARKET SIZE, BY TYPE, 2018–2025 (KT)
TABLE 5 JIMMIES MARKET SIZE, BY REGION, 2018–2025 (USD MILLION)
TABLE 6 JIMMIES MARKET SIZE, BY REGION, 2018–2025 (TON)
TABLE 7 QUINS MARKET SIZE, BY REGION, 2018–2025 (USD MILLION)
TABLE 8 QUINS MARKET SIZE, BY REGION, 2018–2025 (TON)
TABLE 9 DRAGEES MARKET SIZE, BY REGION, 2018–2025 (USD MILLION)
TABLE 10 DRAGEES MARKET SIZE, BY REGION, 2018–2025 (TON)
TABLE 11 NONPAREILS MARKET SIZE, BY REGION, 2018–2025 (USD MILLION)
TABLE 12 NONPAREILS MARKET SIZE, BY REGION, 2018–2025 (TON)
TABLE 13 CARAMEL INCLUSIONS MARKET SIZE, BY REGION, 2018–2025 (USD MILLION)
TABLE 14 CARAMEL INCLUSIONS MARKET SIZE, BY REGION, 2018–2025 (TON)
TABLE 15 SANDING & COURSE SUGAR MARKET SIZE, BY REGION, 2018–2025 (USD MILLION)
TABLE 16 SANDING & COURSE SUGAR MARKET SIZE, BY REGION, 2018–2025 (TON)
TABLE 17 SINGLE PIECES MARKET SIZE, BY REGION, 2018–2025 (USD MILLION)
TABLE 18 SINGLE PIECES MARKET SIZE, BY REGION, 2018–2025 (TON)
TABLE 19 SUGAR DECORATIONS & INCLUSIONS MARKET SIZE, BY COLORANT, 2018–2025 (USD MILLION)
TABLE 20 SUGAR DECORATIONS & INCLUSIONS MARKET SIZE, BY COLORANT, 2018–2025 (KT)
TABLE 21 SUGAR DECORATION & INCLUSIONS MARKET SIZE FOR NATURAL COLORANTS, BY REGION, 2018–2025 (USD MILLION)
TABLE 22 SUGAR DECORATION & INCLUSIONS MARKET SIZE FOR NATURAL COLORANTS, BY REGION, 2018–2025 (TON)
TABLE 23 SUGAR DECORATIONS & INCLUSION MARKET SIZE FOR ARTIFICIAL COLORANTS, BY REGION, 2018–2025 (USD MILLION)
TABLE 24 SUGAR DECORATIONS & INCLUSION MARKET SIZE FOR ARTIFICIAL COLORANTS, BY REGION, 2018–2025 (TON)
TABLE 25 MARKET SIZE, BY APPLICATION, 2018–2025 (USD MILLION)
TABLE 26 MARKET SIZE, BY APPLICATION, 2018–2025 (KT)
TABLE 27 CEREALS & SNACKS BARS MARKET SIZE, BY REGION, 2018–2025 (USD MILLION)
TABLE 28 CEREALS & SNACKS BARS MARKET SIZE, BY REGION, 2018–2025 (TON)
TABLE 29 ICE CREAM & FROZEN DESSERTS MARKET SIZE, BY REGION, 2018–2025 (USD MILLION)
TABLE 30 ICE CREAM & FROZEN DESSERTS MARKET SIZE, BY REGION, 2018–2025 (TON)
TABLE 31 CHOCOLATE & CONFECTIONERY PRODUCTS MARKET SIZE, BY REGION, 2018–2025 (USD MILLION)
TABLE 32 CHOCOLATE & CONFECTIONERY PRODUCTS MARKET SIZE, BY REGION, 2018–2025 (TON)
TABLE 33 CAKES & PASTRIES MARKET SIZE, BY REGION, 2018–2025 (USD MILLION)
TABLE 34 CAKES & PASTRIES MARKET SIZE, BY REGION, 2018–2025 (TON)
TABLE 35 OTHER BAKERY APPLICATIONS MARKET SIZE, BY REGION, 2018–2025 (USD MILLION)
TABLE 36 OTHER BAKERY APPLICATIONS MARKET SIZE, BY REGION, 2018–2025 (TON)
TABLE 37 SUGAR DECORATIONS & INCLUSIONS MARKET SIZE, BY END USER, 2018–2025 (USD MILLION)
TABLE 38 SUGAR DECORATIONS & INCLUSIONS MARKET SIZE, BY END USER, 2018–2025 (KT)
TABLE 39 MARKET SIZE, FOOD MANUFACTURERS, 2018–2025 (USD MILLION)
TABLE 40 MARKET SIZE FOR FOOD MANUFACTURERS, BY REGION 2018–2025 (USD MILLION)
TABLE 41 MARKET SIZE FOR FOOD MANUFACTURERS, BY REGION, 2018–2025 (TON)
TABLE 42 MARKET SIZE FOR CEREAL & SNACKS BARS, BY REGION, 2018–2025 (USD MILLION)
TABLE 43 MARKET SIZE FOR CAKES & PASTRIES, BY REGION, 2018–2025 (USD MILLION)
TABLE 44 MARKET SIZE FOR CHOCOLATE & CONFECTIONERY, BY REGION, 2018–2025 (USD MILLION)
TABLE 45 MARKET SIZE FOR ICE CREAMS, BY REGION, 2018–2025 (USD MILLION)
TABLE 46 MARKET SIZE, BY FOODSERVICE INDUSTRY, 2018–2025 (USD MILLION)
TABLE 47 MARKET SIZE FOR FOODSERVICE INDUSTRY, BY REGION 2018–2025 (USD MILLION)
TABLE 48 MARKET SIZE FOR FOODSERVICE INDUSTRY, BY REGION 2018–2025 (TON)
TABLE 49 MARKET SIZE FOR HOTEL, RESTAURANTS & CAFES, BY REGION, 2018–2025 (USD MILLION)
TABLE 50 MARKET SIZE FOR BAKERY & PASTRY SHOPS, BY REGION, 2018–2025 (USD MILLION)
TABLE 51 MARKET SIZE FOR ICE-CREAM PARLORS, BY REGION, 2018–2025 (USD MILLION)
TABLE 52 MARKET SIZE FOR HOME BAKERS, BY REGION, 2018–2025 (USD MILLION)
TABLE 53 SUGAR DECORATIONS & INCLUSIONS MARKET SIZE FOR HOME BAKERS, BY REGION, 2018–2025 (TON)
TABLE 54 SUGAR DECORATIONS & INCLUSIONS MARKET SIZE, BY REGION, 2018–2025 (USD MILLION)
TABLE 55 SUGAR DECORATIONS & INCLUSIONS MARKET SIZE, BY REGION, 2018–2025 (KT)
TABLE 56 NORTH AMERICA: MARKET SIZE, BY TYPE, 2018–2025 (USD MILLION)
TABLE 57 NORTH AMERICA: MARKET SIZE, BY TYPE, 2018–2025 (TON)
TABLE 58 NORTH AMERICA: MARKET SIZE, BY APPLICATION, 2018–2025 (USD MILLION)
TABLE 59 NORTH AMERICA: SUGAR DECORATIONS & INCLUSIONS MARKET SIZE, BY APPLICATION, 2018–2025 (TON)
TABLE 60 NORTH AMERICA: MARKET SIZE, BY COLORANT, 2018–2025 (USD MILLION)
TABLE 61 NORTH AMERICA: MARKET SIZE, BY COLORANT, 2018–2025 (TON)
TABLE 62 NORTH AMERICA: MARKET SIZE, BY END USER, 2018–2025 (USD MILLION)
TABLE 63 NORTH AMERICA: MARKET SIZE, BY END USER, 2018–2025 (TON)
TABLE 64 NORTH AMERICA: MARKET SIZE, BY FOOD MANUFACTURERS, 2018–2025 (USD MILLION)
TABLE 65 NORTH AMERICA: MARKET SIZE, BY FOODSERVICE INDUSTRY, 2018–2025 (USD MILLION)
TABLE 66 NORTH AMERICA: MARKET SIZE, BY COUNTRY, 2018–2025 (USD MILLION)
TABLE 67 NORTH AMERICA: MARKET SIZE, BY COUNTRY, 2018–2025 (TON)
TABLE 68 US: MARKET SIZE, BY APPLICATION, 2018–2025 (USD MILLION)
TABLE 69 US: MARKET SIZE, BY APPLICATION, 2018–2025 (TON)
TABLE 70 US: MARKET SIZE, BY COLORANT, 2018–2025 (USD MILLION)
TABLE 71 US: MARKET SIZE, BY COLORANT, 2018–2025 (TON)
TABLE 72 US: MARKET SIZE, BY TYPE, 2018–2025 (USD MILLION)
TABLE 73 US: MARKET SIZE, BY END USER, 2018–2025 (USD MILLION)
TABLE 74 CANADA: SUGAR DECORATIONS & INCLUSIONS MARKET SIZE, BY APPLICATION, 2018–2025 (USD MILLION)
TABLE 75 CANADA: MARKET SIZE, BY APPLICATION, 2018–2025 (TON)
TABLE 76 CANADA: MARKET SIZE, BY COLORANT, 2018–2025 (USD MILLION)
TABLE 77 CANADA: MARKET SIZE, BY COLORANT, 2018–2025 (TON)
TABLE 78 CANADA: MARKET SIZE, BY TYPE, 2018–2025 (USD MILLION)
TABLE 79 CANADA: MARKET SIZE, BY END USER, 2018–2025 (USD MILLION)
TABLE 80 MEXICO: MARKET SIZE, BY APPLICATION, 2018–2025 (USD MILLION)
TABLE 81 MEXICO: MARKET SIZE, BY APPLICATION, 2018–2025 (TON)
TABLE 82 MEXICO: MARKET SIZE, BY COLORANT, 2018–2025 (USD MILLION)
TABLE 83 MEXICO: MARKET SIZE, BY COLORANT, 2018–2025 (TON)
TABLE 84 MEXICO: MARKET SIZE, BY TYPE, 2018–2025 (USD MILLION)
TABLE 85 MEXICO: MARKET SIZE, BY END USER, 2018–2025 (USD MILLION)
TABLE 86 EUROPE: MARKET SIZE, BY TYPE, 2018–2025 (USD MILLION)
TABLE 87 EUROPE: MARKET SIZE, BY TYPE, 2018–2025 (TON)
TABLE 88 EUROPE: MARKET SIZE, BY APPLICATION, 2018–2025 (USD MILLION)
TABLE 89 EUROPE: MARKET SIZE, BY APPLICATION, 2018–2025 (TON)
TABLE 90 EUROPE: MARKET SIZE, BY COLORANT, 2018–2025 (USD MILLION)
TABLE 91 EUROPE: MARKET SIZE, BY COLORANT, 2018–2025 (TON)
TABLE 92 EUROPE: MARKET SIZE, BY END USER, 2018–2025 (USD MILLION)
TABLE 93 EUROPE: SUGAR DECORATIONS & INCLUSIONS MARKET SIZE, BY END USER, 2018–2025 (TON)
TABLE 94 EUROPE: MARKET SIZE, BY FOOD MANUFACTURERS, 2018–2025 (USD MILLION)
TABLE 95 EUROPE: MARKET SIZE, BY FOODSERVICE INDUSTRY, 2018–2025 (USD MILLION)
TABLE 96 EUROPE: MARKET SIZE, BY COUNTRY, 2018–2025 (USD MILLION)
TABLE 97 EUROPE MARKET SIZE, BY COUNTRY, 2018–2025 (TON)
TABLE 98 GERMANY: MARKET SIZE, BY APPLICATION, 2018–2025 (USD MILLION)
TABLE 99 GERMANY: MARKET SIZE, BY APPLICATION, 2018–2025 (TON)
TABLE 100 GERMANY: MARKET SIZE, BY COLORANT, 2018–2025 (USD MILLION)
TABLE 101 GERMANY: MARKET SIZE, BY COLORANT, 2018–2025 (TON)
TABLE 102 GERMANY: MARKET SIZE, BY TYPE, 2018–2025 (USD MILLION)
TABLE 103 GERMANY: MARKET SIZE, BY END USER, 2018–2025 (USD MILLION)
TABLE 104 FRANCE: MARKET SIZE, BY APPLICATION, 2018–2025 (USD MILLION)
TABLE 105 FRANCE: MARKET SIZE, BY APPLICATION, 2018–2025 (TON)
TABLE 106 FRANCE: MARKET SIZE, BY COLORANT, 2018–2025 (USD MILLION)
TABLE 107 FRANCE: MARKET SIZE, BY COLORANT, 2018–2025 (TON)
TABLE 108 FRANCE: MARKET SIZE, BY TYPE, 2018–2025 (USD MILLION)
TABLE 109 FRANCE: MARKET SIZE, BY END USER, 2018–2025 (USD MILLION)
TABLE 110 ITALY: MARKET SIZE, BY APPLICATION, 2018–2025 (USD MILLION)
TABLE 111 ITALY: MARKET SIZE, BY APPLICATION, 2018–2025 (TON)
TABLE 112 ITALY: MARKET SIZE, BY COLORANT, 2018–2025 (USD MILLION)
TABLE 113 ITALY: MARKET SIZE, BY COLORANT, 2018–2025 (TON)
TABLE 114 ITALY: MARKET SIZE, BY TYPE, 2018–2025 (USD MILLION)
TABLE 115 ITALY: SUGAR DECORATIONS & INCLUSIONS MARKET SIZE, BY END USER, 2018–2025 (USD MILLION)
TABLE 116 UK: MARKET SIZE, BY APPLICATION, 2018–2025 (USD MILLION)
TABLE 117 UK: MARKET SIZE, BY APPLICATION, 2018–2025 (TON)
TABLE 118 UK: MARKET SIZE, BY COLORANT, 2018–2025 (USD MILLION)
TABLE 119 UK: MARKET SIZE, BY COLORANT, 2018–2025 (TON)
TABLE 120 UK: MARKET SIZE, BY TYPE, 2018–2025 (USD MILLION)
TABLE 121 UK: MARKET SIZE, BY END USER, 2018–2025 (USD MILLION)
TABLE 122 SPAIN: MARKET SIZE, BY APPLICATION, 2018–2025 (USD MILLION)
TABLE 123 SPAIN: MARKET SIZE, BY APPLICATION, 2018–2025 (TON)
TABLE 124 SPAIN: MARKET SIZE, BY COLORANT, 2018–2025 (USD MILLION)
TABLE 125 SPAIN: MARKET SIZE, BY COLORANT, 2018–2025 (TON)
TABLE 126 SPAIN: MARKET SIZE, BY TYPE, 2018–2025 (USD MILLION)
TABLE 127 SPAIN: MARKET SIZE, BY END USER, 2018–2025 (USD MILLION)
TABLE 128 NETHERLANDS: MARKET SIZE, BY APPLICATION, 2018–2025 (USD MILLION)
TABLE 129 NETHERLANDS: MARKET SIZE, BY APPLICATION, 2018–2025 (TON)
TABLE 130 NETHERLANDS: MARKET SIZE, BY COLORANT, 2018–2025 (USD MILLION)
TABLE 131 NETHERLANDS: MARKET SIZE, BY COLORANT, 2018–2025 (TON)
TABLE 132 NETHERLANDS: MARKET SIZE, BY TYPE, 2018–2025 (USD MILLION)
TABLE 133 NETHERLANDS: MARKET SIZE, BY END USER, 2018–2025 (USD MILLION)
TABLE 134 REST OF EUROPE: MARKET SIZE, BY APPLICATION, 2018–2025 (USD MILLION)
TABLE 135 REST OF EUROPE: SUGAR DECORATIONS & INCLUSIONS MARKET SIZE, BY APPLICATION, 2018–2025 (TON)
TABLE 136 REST OF EUROPE: MARKET SIZE, BY COLORANT, 2018–2025 (USD MILLION)
TABLE 137 REST OF EUROPE: MARKET SIZE, BY COLORANT, 2018–2025 (TON)
TABLE 138 REST OF EUROPE: MARKET SIZE, BY TYPE, 2018–2025 (USD MILLION)
TABLE 139 REST OF EUROPE: MARKET SIZE, BY END USER, 2018–2025 (USD MILLION)
TABLE 140 ASIA PACIFIC MARKET SIZE, BY TYPE, 2018–2025 (USD MILLION)
TABLE 141 ASIA PACIFIC MARKET SIZE, BY TYPE, 2018–2025 (TON)
TABLE 142 ASIA PACIFIC: MARKET SIZE, BY APPLICATION, 2018–2025 (USD MILLION)
TABLE 143 ASIA PACIFIC: MARKET SIZE, BY APPLICATION, 2018–2025 (TON)
TABLE 144 ASIA PACIFIC: MARKET SIZE, BY COLORANT, 2018–2025 (USD MILLION)
TABLE 145 ASIA PACIFIC: MARKET SIZE, BY COLORANT, 2018–2025 (TON)
TABLE 146 ASIA PACIFIC: MARKET SIZE, BY END USER, 2018–2025 (USD MILLION)
TABLE 147 ASIA PACIFIC: MARKET SIZE, BY END USER, 2018–2025 (TON)
TABLE 148 ASIA PACIFIC: MARKET SIZE, BY FOOD MANUFACTURERS, 2018–2025 (USD MILLION)
TABLE 149 ASIA PACIFIC: MARKET SIZE, BY FOODSERVICE INDUSTRY, 2018–2025 (USD MILLION)
TABLE 150 ASIA PACIFIC: MARKET SIZE, BY COUNTRY, 2018–2025 (USD MILLION)
TABLE 151 ASIA PACIFIC: SUGAR DECORATIONS & INCLUSIONS MARKET SIZE, BY COUNTRY, 2018–2025 (TON)
TABLE 152 CHINA: MARKET SIZE, BY APPLICATION, 2018–2025 (USD MILLION)
TABLE 153 CHINA: MARKET SIZE, BY APPLICATION, 2018–2025 (TON)
TABLE 154 CHINA: MARKET SIZE, BY COLORANT, 2018–2025 (USD MILLION)
TABLE 155 CHINA: MARKET SIZE, BY COLORANT, 2018–2025 (TON)
TABLE 156 CHINA: MARKET SIZE, BY TYPE, 2018–2025 (USD MILLION)
TABLE 157 CHINA: MARKET SIZE, BY END USER, 2018–2025 (USD MILLION)
TABLE 158 JAPAN: MARKET SIZE, BY APPLICATION, 2018–2025 (USD MILLION)
TABLE 159 JAPAN: MARKET SIZE, BY APPLICATION, 2018–2025 (TON)
TABLE 160 JAPAN: MARKET SIZE, BY COLORANT, 2018–2025 (USD MILLION)
TABLE 161 JAPAN: MARKET SIZE, BY COLORANT, 2018–2025 (TON)
TABLE 162 JAPAN: MARKET SIZE, BY TYPE, 2018–2025 (USD MILLION)
TABLE 163 JAPAN: SUGAR DECORATIONS & INCLUSIONS MARKET SIZE, BY END USER, 2018–2025 (USD MILLION)
TABLE 164 INDIA: MARKET SIZE, BY APPLICATION, 2018–2025 (USD MILLION)
TABLE 165 INDIA: MARKET SIZE, BY APPLICATION, 2018–2025 (TON)
TABLE 166 INDIA: MARKET SIZE, BY COLORANT, 2018–2025 (USD MILLION)
TABLE 167 INDIA: MARKET SIZE, BY COLORANT, 2018–2025 (TON)
TABLE 168 INDIA: MARKET SIZE, BY TYPE, 2018–2025 (USD MILLION)
TABLE 169 INDIA: MARKET SIZE, BY END USER, 2018–2025 (USD MILLION)
TABLE 170 AUSTRALIA & NEW ZEALAND: MARKET SIZE, BY APPLICATION, 2018–2025 (USD MILLION)
TABLE 171 AUSTRALIA & NEW ZEALAND: MARKET SIZE, BY APPLICATION, 2018–2025 (TON)
TABLE 172 AUSTRALIA & NEW ZEALAND: MARKET SIZE, BY COLORANT, 2018–2025 (USD MILLION)
TABLE 173 AUSTRALIA & NEW ZEALAND: MARKET SIZE, BY COLORANT, 2018–2025 (TON)
TABLE 174 AUSTRALIA & NEW ZEALAND: MARKET SIZE, BY TYPE, 2018–2025 (USD MILLION)
TABLE 175 AUSTRALIA & NEW ZEALAND: MARKET SIZE, BY END USER, 2018–2025 (USD MILLION)
TABLE 176 REST OF ASIA PACIFIC: MARKET SIZE, BY APPLICATION, 2018–2025 (USD MILLION)
TABLE 177 REST OF ASIA PACIFIC: MARKET SIZE, BY APPLICATION, 2018–2025 (TON)
TABLE 178 REST OF ASIA PACIFIC: MARKET SIZE, BY COLORANT, 2018–2025 (USD MILLION)
TABLE 179 REST OF ASIA PACIFIC: MARKET SIZE, BY COLORANT, 2018–2025 (TON)
TABLE 180 REST OF ASIA PACIFIC: MARKET SIZE, BY TYPE, 2018–2025 (USD MILLION)
TABLE 181 REST OF ASIA PACIFIC: MARKET SIZE, BY END USER, 2018–2025 (USD MILLION)
TABLE 182 SOUTH AMERICA: MARKET SIZE, BY TYPE, 2018–2025 (USD MILLION)
TABLE 183 SOUTH AMERICA: MARKET SIZE, BY TYPE, 2018–2025 (TON)
TABLE 184 SOUTH AMERICA: MARKET SIZE, BY APPLICATION, 2018–2025 (USD MILLION)
TABLE 185 SOUTH AMERICA: MARKET SIZE, BY APPLICATION, 2018–2025 (TON)
TABLE 186 SOUTH AMERICA: MARKET SIZE, BY COLORANT, 2018–2025 (USD MILLION)
TABLE 187 SOUTH AMERICA: MARKET SIZE, BY COLORANT, 2018–2025 (TON)
TABLE 188 SOUTH AMERICA: MARKET SIZE, BY END USER, 2018–2025 (USD MILLION)
TABLE 189 SOUTH AMERICA: SUGAR DECORATIONS & INCLUSIONS MARKET SIZE, BY END USER, 2018–2025 (TON)
TABLE 190 SOUTH AMERICA: MARKET SIZE, BY FOOD MANUFACTURERS, 2018–2025 (USD MILLION)
TABLE 191 SOUTH AMERICA: MARKET SIZE, BY FOODSERVICE INDUSTRY, 2018–2025 (USD MILLION)
TABLE 192 SOUTH AMERICA: MARKET SIZE, BY COUNTRY, 2018–2025 (USD MILLION)
TABLE 193 SOUTH AMERICA: MARKET SIZE, BY COUNTRY, 2018–2025 (TON)
TABLE 194 BRAZIL: MARKET SIZE, BY APPLICATION, 2018–2025 (USD MILLION)
TABLE 195 BRAZIL: MARKET SIZE, BY APPLICATION, 2018–2025 (TON)
TABLE 196 BRAZIL: MARKET SIZE, BY COLORANT, 2018–2025 (USD MILLION)
TABLE 197 BRAZIL: MARKET SIZE, BY COLORANT, 2018–2025 (TON)
TABLE 198 BRAZIL: MARKET SIZE, BY TYPE, 2018–2025 (USD MILLION)
TABLE 199 BRAZIL: MARKET SIZE, BY END USER, 2018–2025 (USD MILLION)
TABLE 200 ARGENTINA: MARKET SIZE, BY APPLICATION, 2018–2025 (USD MILLION)
TABLE 201 ARGENTINA: SUGAR DECORATIONS & INCLUSIONS MARKET SIZE, BY APPLICATION, 2018–2025 (TON)
TABLE 202 ARGENTINA: MARKET SIZE, BY COLORANT, 2018–2025 (USD MILLION)
TABLE 203 ARGENTINA: MARKET SIZE, BY COLORANT, 2018–2025 (TON)
TABLE 204 ARGENTINA: MARKET SIZE, BY TYPE, 2018–2025 (USD MILLION)
TABLE 205 ARGENTINA: MARKET SIZE, BY END USER, 2018–2025 (USD MILLION)
TABLE 206 REST OF SOUTH AMERICA: MARKET SIZE, BY APPLICATION, 2018–2025 (USD MILLION)
TABLE 207 REST OF SOUTH AMERICA: MARKET SIZE, BY APPLICATION, 2018–2025 (TON)
TABLE 208 REST OF SOUTH AMERICA: MARKET SIZE, BY COLORANT, 2018–2025 (USD MILLION)
TABLE 209 REST OF SOUTH AMERICA: MARKET SIZE, BY COLORANT, 2018–2025 (TON)
TABLE 210 REST OF SOUTH AMERICA: MARKET SIZE, BY TYPE, 2018–2025 (USD MILLION)
TABLE 211 REST OF SOUTH AMERICA: MARKET SIZE, BY END USER, 2018–2025 (USD MILLION)
TABLE 212 REST OF THE WORLD: MARKET SIZE, BY TYPE, 2018–2025 (USD MILLION)
TABLE 213 REST OF THE WORLD: MARKET SIZE, BY TYPE, 2018–2025 (TON)
TABLE 214 REST OF THE WORLD: MARKET SIZE, BY APPLICATION, 2018–2025 (USD MILLION)
TABLE 215 REST OF THE WORLD: MARKET SIZE, BY APPLICATION, 2018–2025 (TON)
TABLE 216 REST OF THE WORLD: MARKET SIZE, BY COLORANT, 2018–2025 (USD MILLION)
TABLE 217 REST OF THE WORLD: MARKET SIZE, BY COLORANT, 2018–2025 (TON)
TABLE 218 REST OF THE WORLD: MARKET SIZE, BY END USER, 2018–2025 (USD MILLION)
TABLE 219 REST OF THE WORLD: SUGAR DECORATIONS & INCLUSIONS MARKET SIZE, BY END USER, 2018–2025 (TON)
TABLE 220 REST OF THE WORLD: MARKET SIZE, BY FOOD MANUFACTURERS, 2018–2025 (USD MILLION)
TABLE 221 REST OF THE WORLD: MARKET SIZE, BY FOODSERVICE INDUSTRY, 2018–2025 (USD MILLION)
TABLE 222 REST OF THE WORLD: MARKET SIZE, BY COUNTRY, 2018–2025 (USD MILLION)
TABLE 223 REST OF THE WORLD: MARKET SIZE, BY COUNTRY, 2018–2025 (TON)
TABLE 224 MIDDLE EAST: MARKET SIZE, BY APPLICATION, 2018–2025 (USD MILLION)
TABLE 225 MIDDLE EAST: MARKET SIZE, BY APPLICATION, 2018–2025 (TON)
TABLE 226 MIDDLE EAST: MARKET SIZE, BY COLORANT, 2018–2025 (USD MILLION)
TABLE 227 MIDDLE EAST: MARKET SIZE, BY COLORANT, 2018–2025 (TON)
TABLE 228 MIDDLE EAST: MARKET SIZE, BY TYPE, 2018–2025 (USD MILLION)
TABLE 229 MIDDLE EAST: MARKET SIZE, BY END USER, 2018–2025 (USD MILLION)
TABLE 230 AFRICA: MARKET SIZE, BY APPLICATION, 2018–2025 (USD MILLION)
TABLE 231 AFRICA: MARKET SIZE, BY APPLICATION, 2018–2025 (TON)
TABLE 232 AFRICA: MARKET SIZE, BY COLORANT, 2018–2025 (USD MILLION)
TABLE 233 AFRICA: MARKET SIZE, BY COLORANT, 2018–2025 (TON)
TABLE 234 AFRICA: MARKET SIZE, BY TYPE, 2018–2025 (USD MILLION)
TABLE 235 AFRICA: SUGAR DECORATIONS & INCLUSIONS MARKET SIZE, BY END USER, 2018–2025 (USD MILLION)
TABLE 236 NEW PRODUCT LAUNCHES
TABLE 237 EXPANSIONS
LIST OF FIGURES (30 Figures)
FIGURE 1 MARKET SEGMENTATION
FIGURE 1 SUGAR DECORATIONS & INCLUSIONS MARKET: RESEARCH DESIGN
FIGURE 2 DATA TRIANGULATION METHODOLOGY
FIGURE 3 SUGAR DECORATIONS & INCLUSIONS MARKET SIZE, BY TYPE, 2020 VS. 2025 (USD MILLION)
FIGURE 4 MARKET SIZE, BY COLORANT, 2020 VS. 2025 (USD MILLION)
FIGURE 5 MARKET SIZE, BY APPLICATION, 2020 VS. 2025 (USD MILLION)
FIGURE 6 MARKET SIZE, BY END USE, 2020 VS. 2025 (USD MILLION)
FIGURE 7 MARKET SHARE & GROWTH (VALUE), BY REGION
FIGURE 8 SUGAR DECORATIONS & INCLUSIONS: AN EMERGING MARKET WITH STEADY GROWTH POTENTIAL
FIGURE 9 JIMMIES TO GROW AT THE HIGHEST RATE IN THE MARKET FROM 2020 TO 2025
FIGURE 10 CAKES & PASTRIES SEGMENT DOMINATED THE SUGAR DECORATIONS & INCLUSIONS MARKET IN 2020
FIGURE 11 ARTIFICIAL SEGMENT IS ESTIMATED TO DOMINATE THE MARKET IN 2020
FIGURE 12 FOODSERVICE INDUSTRY IS PROJECTED TO DOMINATE THE MARKET FROM 2020 TO 2025
FIGURE 13 JIMMIES, ON THE BASIS OF TYPE, ACCOUNTED FOR THE LARGEST SHARE IN THE NORTH AMERICAN SUGAR DECORATIONS & INCLUSIONS MARKET IN 2020
FIGURE 14 ASIA PACIFIC COUNTRIES ARE PROJECTED TO GROW AT THE FASTEST RATE GLOBALLY IN THE MARKET
FIGURE 15 SUGAR SPRINKLE MANUFACTURING PROCESS
FIGURE 16 CARAMEL INCLUSION MANUFACTURING PROCESS
FIGURE 17 MARKET DYNAMICS: SUGAR DECORATIONS & INCLUSIONS MARKET
FIGURE 18 MARKET, BY TYPE, 2020 VS. 2025 (USD MILLION)
FIGURE 19 MARKET, BY COLORANT, 2020 VS. 2025 (USD MILLION)
FIGURE 20 MARKET, BY APPLICATION, 2020 VS. 2025 (USD MILLION)
FIGURE 21 MARKET, BY END USER, 2020 VS. 2025 (USD MILLION)
FIGURE 22 ASIA PACIFIC TO BE THE FASTEST-GROWING MARKET FROM 2020 TO 2025
FIGURE 23 NORTH AMERICA: SUGAR DECORATIONS & INCLUSIONS MARKET SNAPSHOT
FIGURE 24 EUROPE: SUGAR DECORATIONS & INCLUSIONS MARKET SNAPSHOT
FIGURE 25 ASIA PACIFIC: MARKET SNAPSHOT
FIGURE 26 GLOBAL SUGAR DECORATIONS & INCLUSIONS MARKET: COMPETITIVE LEADERSHIP MAPPING, 2018
FIGURE 27 DR. OETKER: COMPANY SNAPSHOT
FIGURE 28 KERRY INC.: COMPANY SNAPSHOT
FIGURE 29 BARRY CALLEBAUT: COMPANY SNAPSHOT
FIGURE 30 THE KRAFT HEINZ COMPANY: COMPANY SNAPSHOT
The study involved four major steps in estimating the size of the sugar decoration & inclusions market. Exhaustive secondary research was done to collect information on the market, as well as the parent market. The next step was to validate these findings, assumptions, and sizing with industry experts across the value chain through primary research. Both the top-down and bottom-up approaches were employed to estimate the complete market size. After that, market breakdown and data triangulation were used to estimate the market size of segments and subsegments.
Secondary Research
In the secondary research process, various sources were referred to, to identify and collect information for this study. These secondary sources included reports from the Food and Agriculture Organization (FAO), United States Department of Agriculture (USDA), Organisation for Economic Co-operation and Development (OECD), and European Food Safety Authority (EFSA). The secondary sources also included annual reports, press releases, investor presentations of companies, white papers, certified publications, articles by recognized authors and regulatory bodies, trade directories, and databases.
Secondary research was mainly conducted to obtain key information about the industry’s supply chain, the total pool of key players, market classification & segmentation according to the industry trends to the bottom-most level and geographical markets. It was also used to obtain information about the key developments from a market-oriented perspective.
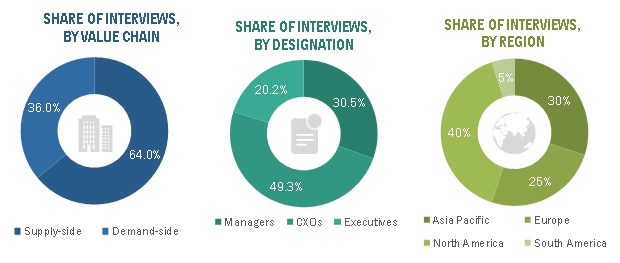
Primary Research
The overall sugar decorations & inclusions market comprises several stakeholders in the supply chain, which include global and regional product manufacturers, suppliers, and retailers. Primary sources from both the supply and demand sides of the market were interviewed to obtain qualitative and quantitative information, which include primary interviews of major product manufacturers. Products offered in the market include quins, jimmies, dragees, nonpareils, and caramel inclusions.
To know about the assumptions considered for the study, download the pdf brochure
Market Size Estimation
Both the top-down and bottom-up approaches were used to estimate and validate the total size of the sugar decorations & inclusions market. These approaches were also used extensively to estimate the size of various subsegments in the market. The research methodology used to estimate the market size includes the following details:
- The key players were identified through extensive secondary research.
- The market size, in terms of value, was determined through primary and secondary research.
- All percentage share splits and breakdowns were determined using secondary sources and verified through primary sources.
- All the possible parameters that affect the market covered in this research study were accounted for, viewed in extensive detail, verified through primary research, and analyzed to obtain the final quantitative and qualitative data.
Data Triangulation
After arriving at the overall market size from the estimation process explained above, the total market was split into several segments and subsegments. The data triangulation and market breakdown procedures were employed to estimate the global sugar decorations & inclusions market and arrive at the exact statistics for all segments and subsegments, wherever applicable. The data was triangulated by studying various factors and trends from the demand and supply sides. Along with this, the market size was validated using both the top-down and bottom-up approaches.
Report Objectives
- Determining and projecting the size of the market for sugar decorations & inclusions , with respect to application, type, colorant, end user, and regional markets, over a five-year period, ranging from 2020 to 2025
- Identifying the attractive opportunities in the market by determining the largest and fastest-growing segments across regions
- Providing detailed information about the key factors influencing the growth of the market (drivers, restraints, opportunities, and industry-specific challenges)
- Analyzing the micromarkets, with respect to individual growth trends, prospects, and their contribution to the total market
- Identifying and profiling the key players in the sugar decorations & inclusions market
-
Providing a comparative analysis of market leaders on the basis of the following:
- Product offerings
- Business strategies
- Strengths and weaknesses
- Key financials
- Understanding the competitive landscape and identifying the major growth strategies adopted by players across the key regions
- Analyzing the value chain and products offered across key regions and their impact on the growth of prominent market players
- Providing insights on key product innovations and investments in the sugar decorations & inclusions market
Available Customizations
Geographic Analysis
- Further breakdown of the Rest of Asia Pacific market into Indonesia, Malaysia, and South Korea
- Further breakdown of the Rest of Europe market into Poland, Denmark, Belgium, and Russia
- Further breakdown of the South America sugar decorations & inclusions market into Colombia, Chile, and Peru
Company Information
- Detailed analysis and profiling of additional market players (up to five)


Growth opportunities and latent adjacency in Sugar Decorations & Inclusions Market