Sustainable Packaging Market by Material (Paper & Paperboard, Plastic, Metal, Glass), Process (Recycled, Reusable, Degradable), Function (Active, Molded Pulp, Alternate Fiber), Application (Food & Beverage, Healthcare, Others) & Layer - Global Forecast to 2020


[252 Pages Report] Stringent regulations regarding sustainability, coupled with changing preferences towards more sustainable packaging materials are some of the major factors for growth of the sustainable packaging industry. The sustainable packaging market was valued at USD 201.60 billion in 2014, and is projected to grow at a CAGR of 7.17% from 2015 to 2020. Degradable packaging is the fastest-growing process in the sustainable packaging market. In the material segment, paper & paperboard packaging is projected to grow at the highest rate. In terms of application, the food & beverage packaging segment is the fastest-growing segment, followed by the personal care packaging segment.
This report provides a full analysis of key companies and competitive analysis of developments recorded in the industry during the past five years. Also, market drivers, restraints, opportunities, and challenges have been discussed in detail. Leading players of the market, which include Amcor Limited (Australia), Bemis Company, Inc. (U.S.), Tetra Laval International S.A. (Switzerland), Mondi plc (South Africa), WestRock Company (U.S.), BASF SE (Germany), Sonoco Products Company (U.S.), Smurfit Kappa Group PLC (U.S.), Sealed Air Corporation (U.S.), and Huhtamaki OYJ (Finland) have been profiled to provide an insight of the competitive scenario in the market.
Please visit 360Quadrants to see the vendor listing of Top 21 Sustainable Packaging Companies, Worldwide 2023
To know about the assumptions considered for the study, download the pdf brochure
Scope of the Report
This research categorizes the sustainable packaging market based on function, layer, process, material, application, and region.
On the basis of material, the sustainable packaging market has been segmented as follows:
- Paper & Paperboard
- Plastic
- Metal
- Glass
On the basis of function, the sustainable packaging market has been segmented as follows:
- Active packaging
- Molded pulp packaging
- Alternate fiber packaging
On the basis of process, the sustainable packaging market has been segmented as follows:
- Recycled content packaging
- Reusable packaging
- Degradable packaging
On the basis of layer, the sustainable packaging market has been segmented as follows:
- Primary
- Secondary
- Tertiary
On the basis of application, the sustainable packaging market has been segmented as follows:
- Food & Beverage packaging
- Healthcare packaging
- Personal care packaging
- Others (electronic appliances and home care packaging)
On the basis of region, the sustainable packaging market has been segmented as follows:
- Asia-Pacific
- Europe
- North America
- Rest of the World (RoW)
Value Addition for the Buyer:
- This report provides five year market forecasts with important statistical and analytical information on the device, technology, and application.
- This report provides a list of regulations relevant to sustainable packaging at the regional level.
- This report illustrates industry structure, driving parameters, major players, market shares, industry dynamics, and international developments relevant to sustainable packaging markets.
- This report provides detailing of each segment on country basis for a holistic view.
- This report provides a competitive landscape, which is a presentation of the companies’ products and services.
The sustainable packaging market is estimated to reach USD 303.60 Billion by 2020, with a projected CAGR of 7.17% from 2015 to 2020. Factors such as government initiatives towards reuse and recycling of packaging products, downsizing of packaging, and breakthrough in new technologies are driving the market. Application of sustainable packaging in the food & beverage segment dominated the market in 2014. In terms of function, the active packaging segment, which consists of barrier packaging, anti-microbial packaging, and modified atmosphere packaging (MAP), held the largest share in 2014. This domination is mainly due to growing packaged food and beverage industry, particularly in emerging markets such as China, Brazil, and India.
The sustainable packaging market is highly fragmented with several packaging manufacturers offering sustainable packaging solutions The market is dominated by key players such as Amcor Limited (Australia), Bemis Company, Inc. (U.S.), Tetra Laval International S.A. (Switzerland), Mondi plc (South Africa), WestRock Company (U.S.), BASF SE (Germany), Sonoco Products Company (U.S.), Smurfit Kappa Group PLC (U.S.), Sealed Air Corporation (U.S.), and Huhtamaki OYJ (Finland). The market in this report is segmented on the basis of material, process, function, layer, application, and region.
On the basis of Material, the sustainable packaging market has been segmented as follows:
- Paper & Paperboard
- Plastic
- Metal
- Glass
On the basis of Function, the sustainable packaging market has been segmented as follows:
- Active packaging
- Molded pulp packaging
- Alternate fiber packaging
On the basis of Process, the sustainable packaging market has been segmented as follows:
- Recycled content packaging
- Reusable packaging
- Degradable packaging
On the basis of Layer, the sustainable packaging market has been segmented as follows:
- Primary
- Secondary
- Tertiary
On the basis of Application, the sustainable packaging market has been segmented as follows:
- Food & Beverage packaging
- Healthcare packaging
- Personal care packaging
- Others (home care packaging and electronical appliances)
On the basis of Region, the sustainable packaging market has been segmented as follows:
- Asia-Pacific
- Europe
- North America
- Rest of the World (RoW)
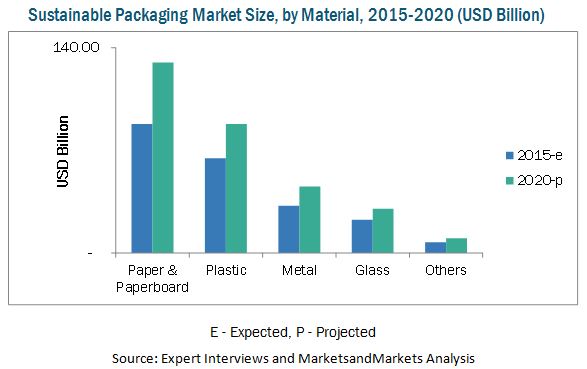
Paper & paperboard was the most widely used material for sustainable packaging in 2014. It is also projected to grow at the highest CAGR of 8.08% from 2015 to 2020.
The key players of the sustainable packaging market implement different strategies such as expansions, agreements, contracts, joint ventures, and partnerships to gain a larger share in the market.
Major companies have regional and local distributors to increase their shares in several countries. One of the major developments observed in the sustainable packaging market is mergers and acquisitions. Companies are adopting organic growth strategies such as new product developments to cope with the increasing demand for sustainable packaging solutions in emerging markets. These strategies have aided major companies create a huge customer and partner base in these markets.
To speak to our analyst for a discussion on the above findings, click Speak to Analyst
 Exclusive indicates content/data unique to MarketsandMarkets and not available with any competitors.
Table of Contents
1 Introduction (Page No. - 28)
1.1 Objectives of the Study
1.2 Market Definition
1.3 Study Scope
1.3.1 Periodization Considered for This Study
1.4 Currency Considered for This Study
1.5 Unit Considered for This Study
1.6 Stakeholders
2 Research Methodology (Page No. - 31)
2.1 Research Data
2.1.1 Secondary Data
2.1.1.1 Key Data From Secondary Sources
2.1.2 Primary Data
2.1.2.1 Key Data From Primary Sources
2.2 Market Size Estimation
2.3 Market Breakdown & Data Triangulation
2.4 Research Assumptions & Limitations
2.4.1 Assumptions Made for This Study
2.4.2 Limitations of the Research Study
3 Executive Summary (Page No. - 38)
3.1 Stringent Regulations Regarding Sustainability are Driving the Sustainable Packaging Market
3.2 Sustainable Packaging Market Driving Factors
3.3 Paper & Paperboard Segment Projected to Occupy Largest Share Among All Materials, By 2020
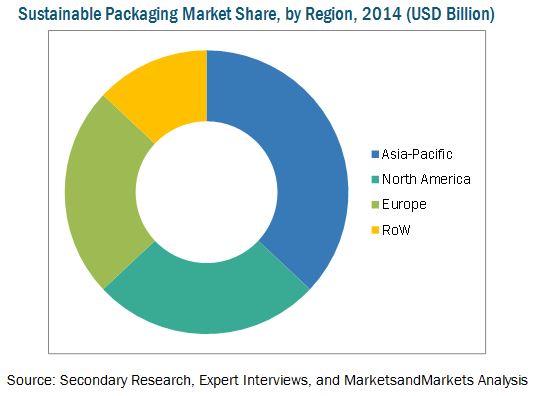
3.4 Asia-Pacific is Projected to Dominate the Global Sustainable Packaging Market By 2020
3.5 India is Projected to Have the Highest CAGR Between 2015 & 2020
3.6 Leading Market Players Adopted Mergers & Acquisitions as the Key Strategy From 2011 to 2015
4 Premium Insights (Page No. - 43)
4.1 Attractive Market Opportunities in the Sustainable Packaging Market
4.2 Active Packaging Occupies the Largest Share Among All Functions of Sustainable Packaging
4.3 Sustainable Packaging Market in the Asia-Pacific Region
4.4 India is Projected to Have the Highest CAGR From 2015 to 2020
4.5 Asia-Pacific Occupied the Largest Market Share Among All Regions in 2014
4.6 Emerging Markets are Estimated to Grow at A Faster Rate Than Developed Markets
4.7 Food & Beverage Packaging Had the Largest Share in 2014 Among Applications of Sustainable Packaging
4.8 Sustainable Packaging Market Life Cycle Analysis, By Region (2014)
5 Market Overview (Page No. - 50)
5.1 Introduction
5.2 Evolution
5.3 Sustainable Packaging Market Segmentation
5.4 Market Dynamics
5.4.1 Drivers
5.4.1.1 Government Initiatives Towards Sustainable Packaging
5.4.1.2 Shift in Consumer Preferences Towards Recyclable and Eco-Friendly Materials
5.4.1.3 Downsizing of Packaging
5.4.1.4 Breakthrough in New Technologies
5.4.2 Restraints
5.4.2.1 Poor Infrastructure Facilities for Recycling
5.4.2.2 Lack of Awareness About the Importance of Sustainability in Some Emerging Economies
5.4.2.3 High Cost of Recycling
5.4.3 Opportunities
5.4.3.1 Growth of the E-Commerce Industry
5.4.4 Challenges
5.4.4.1 Fluctuations in Raw Material Prices
6 Industry Trends (Page No. - 58)
6.1 Introduction
6.2 Value Chain Analysis
6.3 Regulations in the Sustainable Packaging Market, By Region
6.4 Average Price Analysis
6.4.1 Sustainable Packaging Market, Average Price Analysis, By Region
6.4.2 Sustainable Packaging Market, Average Price Analysis, By Material
6.4.3 Sustainable Packaging Market, Average Price Analysis, By Application
7 Sustainable Packaging Market, By Material (Page No. - 63)
7.1 Introduction
7.1.1 Sustainable Packaging Market, By Material
7.1.1.1 Paper & Paperboard Packaging Dominated the Global Sustainable Packaging Market in 2014
7.2 Paper & Paperboard
7.2.1 By Grade
7.2.1.1 Solid Bleach Sulfate (SBS)
7.2.1.2 Coated Unbleached Kraft (CUK)
7.2.1.3 Recycled (Coated and Uncoated)
7.2.1.4 Others
7.2.1.4.1 Sustainable Paper & Paperboard Packaging Market, By Grade
7.2.1.4.1.1 Solid Bleached Sulfate Held the Largest Share in the Paper & Paperboard Packaging Segment, By Grade, in 2014
7.2.2 By Packaging Type
7.2.2.1 Corrugated Box
7.2.2.2 Boxboard
7.2.2.2.1 Rigid Boxes
7.2.2.2.2 Folding Boxes
7.2.2.2.3 Trays
7.2.2.3 Flexible Paper Packaging
7.2.2.3.1 Paper Bags
7.2.2.3.2 Shipping Sacks
7.2.2.3.3 Sachets/Pouches
7.2.2.3.3.1 Sustainable Paper & Paperboard Packaging Market, By Packaging Type
7.2.2.3.3.1.1 Corrugated Boxes Dominated the Paper & Paperboard Packaging Market in 2014
7.3 Plastic
7.3.1 By Type
7.3.1.1 Bio-Based Plastic
7.3.1.2 Biodegradable Plastic
7.3.1.3 Others
7.3.1.3.1 Sustainable Plastic Packaging Market, By Type
7.3.1.3.1.1 Biodegradable Packaging Projected to Have the Highest CAGR in the Plastic Packaging Market By 2020
7.3.2 By Packaging Type
7.3.2.1 Bottles and Cans
7.3.2.2 Bags & Pouches
7.3.2.3 Others
7.3.2.3.1 Sustainable Plastic Packaging Market, By Packaging Type
7.3.2.3.1.1 Bottles Accounted for the Largest Market Share in 2014
7.4 Metal
7.4.1 By Type
7.4.1.1 Steel
7.4.1.2 Aluminum
7.4.1.3 Others
7.4.1.3.1 Sustainable Metal Packaging Market, By Type
7.4.1.3.1.1 Steel Packaging to Grow at the Second-Highest CAGR By 2020
7.4.2 By Packaging Type
7.4.2.1 Cans
7.4.2.2 Barrels & Drums
7.4.2.3 Caps & Closures
7.4.2.4 Others (Aerosol, Tube, and Lid)
7.4.2.4.1 Aerosols
7.4.2.4.2 Tubes
7.4.2.4.3 Lids
7.4.2.4.3.1 Sustainable Metal Packaging Market, By Packaging Type
7.4.2.4.3.1.1 Metal Cans and Caps & Closures to Grow at the Highest CAGR By 2020
7.5 Glass
7.5.1 By Type
7.5.1.1 Sand
7.5.1.2 Soda Ash
7.5.1.3 Limestone
7.5.1.3.1 Sustainable Glass Packaging Market, By Type
7.5.1.3.1.1 Sand Packaging to Grow at the Highest Rate By 2020
7.5.2 By Packaging Type
7.5.2.1 Jars
7.5.2.2 Bottles
7.5.2.3 Others
7.5.2.3.1 Sustainable Glass Packaging Market, By Packaging Type
7.5.2.3.1.1 Jars Packaging to Grow at the Second-Highest Rate By 2020
7.6 Others
8 Sustainable Packaging Market, By Layer (Page No. - 80)
8.1 Introduction
8.1.1 Sustainable Packaging Market Size, By Layer
8.1.1.1 Primary Packaging Dominated the Sustainable Packaging Market, By Layer, in 2014
8.2 Primary Packaging
8.2.1 Primary Sustainable Packaging Market Size, By Material
8.2.1.1 Paper & Paperboard Dominated the Primary Sustainable Packaging Market in 2014
8.3 Secondary Packaging
8.3.1 Secondary Sustainable Packaging Market Size, By Material
8.3.1.1 Paper & Paperboard Accounted for the Largest Market Share in 2014
8.4 Tertiary Packaging
8.4.1 Tertiary Sustainable Packaging Market Size, By Material
8.4.1.1 Metal Packaging to Grow at the Highest CAGR By 2020
9 Sustainable Packaging Market, By Process (Page No. - 88)
9.1 Introduction
9.1.1 Sustainable Packaging Market, By Process
9.1.1.1 Recycled Content Packaging Dominated the Global Sustainable Packaging Market in 2014
9.2 Recycled Content Packaging
9.2.1 Recycled Content Packaging Market, By Material
9.2.1.1 Paper & Paperboard Dominated the Recycled Content Packaging Market in 2014
9.3 Reusable Packaging
9.3.1 Reusable Packaging Market, By Material
9.3.1.1 Plastic Accounted for the Largest Market Share in 2014
9.4 Degradable Packaging
9.4.1 Degradable Packaging Market, By Material
9.4.1.1 Paper & Paperboard to Grow at the Highest CAGR By 2020
10 Sustainable Packaging Market, By Function (Page No. - 95)
10.1 Introduction
10.1.1 Sustainable Packaging Market Size, By Function
10.1.1.1 Active Packaging Dominated the Global Sustainable Packaging Market in 2014
10.2 Active Packaging
10.2.1 Barrier Packaging
10.2.2 Modified Atmosphere Packaging (Map)
10.2.3 Antimicrobial Packaging
10.2.3.1 Active Packaging Market Size, By Type
10.2.3.1.1 Modified Atmosphere Packaging Dominated the Sustainable Packaging Market in 2014
10.3 Molded Packaging
10.3.1 Thick Wall Pulp Packaging
10.3.2 Transfer Molded Pulp Packaging
10.3.3 Thermoformed Pulp Packaging
10.3.4 Processed Pulp Packaging
10.3.4.1 Molded Packaging Market Size, By Type
10.3.4.1.1 Transfer Molded Packaging Accounted for the Largest Market Share in 2014
10.4 Alternate Fiber Packaging
10.4.1 Bamboo Fiber
10.4.2 Mushroom Packaging
10.4.3 Other Fiber Packaging
10.4.3.1 Alternate Fiber Packaging Market Size, By Type
10.4.3.1.1 Bamboo Fiber Packaging to Grow at the Highest CAGR By 2020
10.5 Others
11 Sustainable Packaging Market, By Application (Page No. - 104)
11.1 Introduction
11.1.1 Sustainable Packaging Market Size, By Application
11.1.1.1 Food & Beverage Packaging Dominated the Global Sustainable Packaging Market in 2014
11.2 Food & Beverage Packaging
11.2.1 Food & Beverage Packaging Market Size, By Process
11.2.1.1 Recycled Content Packaging Held the Largest Share in the Food & Beverage Packaging Segment, By Process, in 2014
11.2.2 Food & Beverage Packaging Market Size, By Material
11.2.2.1 Paper & Paperboard Dominated the Food & Beverage Packaging Market, By Material, in 2014
11.2.3 Food & Beverage Packaging Market Size, By Function
11.2.3.1 Molded Pulp Packaging Projected to Grow at the Highest Rate in the Food & Beverage Packaging Segment, From 2015 to 2020
11.3 Healthcare Packaging
11.3.1 Healthcare Packaging Market Size, By Process
11.3.1.1 Degradable Packaging Projected to Have the Highest CAGR in the Healthcare Packaging Market, By Process, From 2015 to 2020
11.3.2 Healthcare Packaging Market Size, By Material
11.3.2.1 Plastic Accounted for the Largest Market Share in 2014
11.3.3 Healthcare Packaging Market Size, By Function
11.3.3.1 Active Packaging Accounted for the Largest Market Share in 2014
11.4 Personal Care Packaging
11.4.1 Personal Care Packaging Market Size, By Process
11.4.1.1 Reusable Packaging to Grow at the Second-Highest CAGR By 2020
11.4.2 Personal Care Packaging Market Size, By Material
11.4.2.1 Paper & Paperboard Packaging to Grow at the Fastest CAGR By 2020
11.4.3 Personal Care Packaging Market Size, By Function
11.4.3.1 Active Packaging to Grow at the Fastest CAGR By 2020
11.5 Other Applications
11.5.1 Other Applications Packaging Market Size, By Process
11.5.1.1 Degradable Packaging to Grow at the Highest Rate By 2020
11.5.2 Other Applications Packaging Market Size, By Material
11.5.2.1 Metal Packaging to Grow at the Second-Highest Rate By 2020
11.5.3 Other Applications: Packaging Market Size, By Function
11.5.3.1 Active Packaging to Grow at the Highest Rate By 2020
12 Sustainable Packaging Market, By Region (Page No. - 119)
12.1 Introduction
12.1.1 Sustainable Packaging Market Size, By Region
12.1.1.1 Asia-Pacific Dominated the Global Sustainable Packaging Market in 2014
12.2 Asia-Pacific
12.2.1 Asia-Pacific: Sustainable Packaging Market Size, By Country
12.2.1.1 China Dominated the Asia-Pacific Sustainable Packaging Market in 2014
12.2.2 Asia-Pacific: Sustainable Packaging Market Size, By Material
12.2.2.1 Paper & Paperboard Accounted for the Largest Market Share in 2014
12.2.3 Asia-Pacific: Sustainable Packaging Market Size, By Process
12.2.3.1 Degradable Packaging to Grow at the Highest CAGR By 2020
12.2.4 Asia-Pacific: Sustainable Packaging Market Size, By Function
12.2.4.1 Molded Pulp Packaging to Grow at the Second-Highest Rate By 2020
12.2.5 Asia-Pacific: Sustainable Packaging Market Size, By Layer
12.2.5.1 Secondary Packaging Was the Second-Largest Market in 2014
12.2.6 Asia-Pacific: Sustainable Packaging Market Size, By Application
12.2.6.1 Food & Beverage Packaging Accounted for the Largest Market Share in 2014
12.2.7 China
12.2.7.1 China: Sustainable Packaging Market Size, By Material
12.2.7.1.1 Increasing Awareness About Eco-Friendly Packaging Products is Driving the Paper & Paperboard Packaging Market in China
12.2.7.2 China: Sustainable Packaging Market Size, By Process
12.2.7.2.1 Recycled Content Packaging Dominated the Chinese Sustainable Packaging Market
12.2.7.3 China: Sustainable Packaging Market Size, By Application
12.2.7.3.1 Growing Food & Beverage Industry Drives the Sustainable Packaging Market in China
12.2.8 Japan
12.2.8.1 Japan: Sustainable Packaging Market Size, By Material
12.2.8.1.1 Paper & Paperboard Packaging to Grow at the Highest CAGR By 2020
12.2.8.2 Japan: Sustainable Packaging Market Size, By Process
12.2.8.2.1 Stringent Environmental Regulations are Driving the Market for Recycled Content Packaging in Japan
12.2.8.3 Japan: Sustainable Packaging Market Size, By Application
12.2.8.3.1 Application of Sustainable Packaging in the Personal Care Packaging Industry Was the Largest in 2014
12.2.9 Australia
12.2.9.1 Australia: Sustainable Packaging Market Size, By Material
12.2.9.1.1 Plastic Packaging to Grow at the Second-Highest CAGR By 2020
12.2.9.2 Australia: Sustainable Packaging Market Size, By Process
12.2.9.2.1 Recycled Content Packaging Accounted for the Largest Market Share in 2014
12.2.9.3 Australia: Sustainable Packaging Market Size, By Application
12.2.9.3.1 Application of Sustainable Packaging in the Food & Beverage Industry Was the Largest in 2014
12.2.10 India
12.2.10.1 India: Sustainable Packaging Market Size, By Material
12.2.10.1.1 Metal Packaging to Grow at the Highest Rate in the Indian Sustainable Packaging Market
12.2.10.2 India: Sustainable Packaging Market Size, By Process
12.2.10.2.1 Reusable Packaging Projected to Grow at the Second-Highest CAGR By 2020
12.2.10.3 India: Sustainable Packaging Market Size, By Application
12.2.10.3.1 Packaging Industry in India is Largely Driven By Growth in the Income of Middle-Class Population
12.2.11 Rest of Asia-Pacific
12.2.11.1 Rest of Asia-Pacific: Sustainable Packaging Market Size, By Material
12.2.11.1.1 Plastic Packaging Held Second-Largest Share in the Rest of Apac Sustainable Packaging Market
12.2.11.2 Rest of Asia-Pacific: Sustainable Packaging Market Size, By Process
12.2.11.2.1 Degradable Packaging Was the Second-Largest Market in 2014
12.2.11.3 Rest of Asia-Pacific: Sustainable Packaging Market Size, By Application
12.2.11.3.1 Personal Care Packaging Was the Second-Largest Application for Sustainable Packaging in 2014
12.3 North America
12.3.1 North America: Sustainable Packaging Market Size, By Country
12.3.1.1 Mexico is Projected to Be the Fastest-Growing Market By 2020
12.3.2 North America: Sustainable Packaging Market Size, By Material
12.3.2.1 North American Sustainable Packaging Market is Driven By Retail Along With Food & Beverage Industries
12.3.3 North America: Sustainable Packaging Market Size, By Process
12.3.3.1 Reusable Packaging to Grow at the Second-Highest Rate By 2020
12.3.4 North America: Sustainable Packaging Market Size, By Function
12.3.4.1 Active Packaging Accounted for the Largest Share Owing to Its Growing Application in the Food & Beverage Industry
12.3.5 North America: Market Size, By Layer
12.3.5.1 Increasing Consumption of Cardboard and Boxes is Driving the Secondary Packaging Market in North America
12.3.6 North America: Market Size, By Application
12.3.6.1 Food & Beverage Packaging Accounted for the Largest Market Share in 2014
12.3.7 U.S.
12.3.7.1 U.S.: Market Size, By Material
12.3.7.1.1 Legislative Ban on Polystyrene Foam in the Food & Beverage Industry is Driving the Market for Paper & Paperboard Packaging in the U.S.
12.3.7.2 U.S.: Market Size, By Process
12.3.7.2.1 Rising Demand for Recyclable Goods is Driving the Demand for Recycled Content Packaging in the U.S.
12.3.7.3 U.S.: Market Size, By Application
12.3.7.3.1 the U.S. Sustainable Packaging Market is Dominated By Food & Beverage Application
12.3.8 Canada
12.3.8.1 Canada: Market Size, By Material
12.3.8.1.1 Plastic Packaging Was the Second-Largest Market in 2014
12.3.8.2 Canada: Market Size, By Process
12.3.8.2.1 Degradable Packaging to Grow at the Highest CAGR in the Canadian Sustainable Packaging Market
12.3.8.3 Canada: Sustainable Packaging Market Size, By Application
12.3.8.3.1 Food & Beverage Packaging Application Dominated the Sustainable Packaging Market in 2014
12.3.9 Mexico
12.3.9.1 Mexico: Sustainable Packaging Market Size, By Material
12.3.9.1.1 Mexican Sustainable Packaging Market, By Material, Was Dominated By Paper & Paperboard Packaging in 2014
12.3.9.2 Mexico: Sustainable Packaging Market Size, By Process
12.3.9.2.1 Mexican Association of Packaging (AMEE) Oversees the Sustainability and Recycling Processes of Packaging Products in Mexico
12.3.9.3 Mexico: Sustainable Packaging Market Size, By Application
12.3.9.3.1 Growth in the Food & Beverage Industry Drives the Sustainable Packaging Industry in Mexico
12.4 Europe
12.4.1 Europe: Sustainable Packaging Market Size, By Country
12.4.1.1 Germany Held the Largest Share in the European Sustainable Packaging Market
12.4.2 Europe: Sustainable Packaging Market Size, By Material
12.4.2.1 Paper & Paperboard Packaging to Grow at the Highest CAGR By 2020
12.4.3 Europe: Sustainable Packaging Market Size, By Process
12.4.3.1 Rising Recycling Efforts Undertaken By the Government is Projected to Drive the Recycled Content Packaging Market in Europe
12.4.4 Europe: Sustainable Packaging Market Size, By Function
12.4.4.1 Rising Demand for Protective Packaging to Drive the Demand for Molded Pulp Packaging in Europe
12.4.5 Europe: Sustainable Packaging Market Size, By Layer
12.4.5.1 Growth in the E-Commerce Industry to Drive the Demand for Tertiary Packaging in Europe
12.4.6 Europe: Sustainable Packaging Market Size, By Application
12.4.6.1 Growing Health Care and Personal Care Sectors Have Contributed to the Growth of the Sustainable Packaging Market in Europe
12.4.7 Germany
12.4.7.1 Germany: Sustainable Packaging Market Size, By Material
12.4.7.1.1 Plastic Packaging Accounted for the Largest Market Share in 2014
12.4.7.2 Germany: Sustainable Packaging Market Size, By Process
12.4.7.2.1 Plastic Packaging Accounted for the Largest Market Share in 2014
12.4.7.3 Germany: Sustainable Packaging Market Size, By Application
12.4.7.3.1 Personal Care Packaging Was the Second-Largest Market in 2014 in Germany
12.4.8 U.K.
12.4.8.1 U.K.: Sustainable Packaging Market Size, By Material
12.4.8.1.1 Metal Packaging Market is Projected to Grow at the Second-Highest Rate in the U.K. Sustainable Packaging Market
12.4.8.2 U.K.: Sustainable Packaging Market Size, By Process
12.4.8.2.1 Recycling of Packaging Waste has Driven the Sustainable Packaging Market in the U.K.
12.4.8.3 U.K.: Sustainable Packaging Market Size, By Application
12.4.8.3.1 Food & Beverage Packaging Dominated the U.K. Market for Sustainable Packaging
12.4.9 France
12.4.9.1 France: Sustainable Packaging Market Size, By Material
12.4.9.1.1 Growth in the Food & Beverage Industry is Projected to Drive the Paper & Paperboard Packaging Market
12.4.9.2 France: Sustainable Packaging Market Size, By Process
12.4.9.2.1 Degradable Packaging is Projected to Grow at the Highest Rate By 2020
12.4.9.3 France: Sustainable Packaging Market Size, By Application
12.4.9.3.1 Rising Health Concerns Projected to Drive the Sustainable Packaging Demand in the Food & Beverage Industry
12.4.10 Russia
12.4.10.1 Russia: Sustainable Packaging Market Size, By Material
12.4.10.1.1 Increasing Number of Integrated Packaging Manufacturers is Driving the Demand for Sustainable Packaging in Russia
12.4.10.2 Russia: Sustainable Packaging Market Size, By Process
12.4.10.2.1 Degradable Packaging Was the Second-Largest Market in Russia in 2014
12.4.10.3 Russia: Sustainable Packaging Market Size, By Application
12.4.10.3.1 Food & Beverage Application Accounted for the Largest Share in the Russian Sustainable Packaging Market
12.4.11 Rest of Europe
12.4.11.1 Rest of Europe: Sustainable Packaging Market Size, By Material
12.4.11.1.1 Paper & Paperboard Packaging to Grow at the Highest CAGR By 2020
12.4.11.2 Rest of Europe: Sustainable Packaging Market Size, By Process
12.4.11.2.1 Reusable Packaging to Grow at the Second-Highest Rate By 2020
12.4.11.3 Rest of Europe: Sustainable Packaging Market Size, By Application
12.4.11.3.1 Food & Beverage Packaging Accounted for the Largest Share in 2014 and is Also Projected to Grow at the Highest CAGR By 2020
12.5 Rest of the World (RoW)
12.5.1 RoW: Sustainable Packaging Market Size, By Country
12.5.1.1 South Africa Dominated the RoW Sustainable Packaging Market in 2014
12.5.2 RoW: Sustainable Packaging Market Size, By Material
12.5.2.1 Plastic Packaging Held Second-Largest Share in the RoW Sustainable Packaging Market in 2014
12.5.3 RoW: Sustainable Packaging Market Size, By Process
12.5.3.1 Reusable Packaging is Projected to Have Potential Growth By 2020
12.5.4 RoW: Sustainable Packaging Market Size, By Function
12.5.4.1 Changing Lifestyles Among Consumers Have Driven the Active Packaging Market in RoW
12.5.5 RoW: Sustainable Packaging Market Size, By Layer
12.5.5.1 Growth in the Retail Industry is Expected to Boost the Tertiary Packaging Market By 2020
12.5.6 RoW: Sustainable Packaging Market Size, By Application
12.5.6.1 Personal Care Packaging is Projected to Have Potential Growth Opportunities By 2020
12.5.7 Brazil
12.5.7.1 Brazil: Sustainable Packaging Market Size, By Material
12.5.7.1.1 Sustainable Packaging Market in Brazil Was Dominated By Paper & Paperboard Packaging in 2014
12.5.7.2 Brazil: Sustainable Packaging Market Size, By Process
12.5.7.2.1 Degradable Packaging Process is Projected to Grow at the Highest CAGR By 2020
12.5.7.3 Brazil: Sustainable Packaging Market Size, By Application
12.5.7.3.1 Food & Beverage Packaging Dominated the Brazilian Market for Sustainable Packaging
12.5.8 South Africa
12.5.8.1 South Africa: Sustainable Packaging Market Size, By Material
12.5.8.1.1 Paper & Paperboard Packaging is Estimated to Have Highest Demand for Sustainable Packaging in South Africa
12.5.8.2 South Africa: Sustainable Packaging Market Size, By Process
12.5.8.2.1 Recycled Content Packaging Led the South African Sustainable Packaging Market in 2014
12.5.8.3 South Africa: Sustainable Packaging Market Size, By Application
12.5.8.3.1 Personal Care Packaging is Estimated to Have Potential Growth Opportunities By 2020
12.5.9 Other Countries in RoW
12.5.9.1 Other Countries in RoW: Sustainable Packaging Market Size, By Material
12.5.9.1.1 Paper & Paperboard Packaging Projected to Be the Fastest-Growing Market for Sustainable Packaging in Other Countries in RoW
12.5.9.2 Other Countries in RoW: Sustainable Packaging Market Size, By Process
12.5.9.2.1 Recycled Content Packaging Accounted for the Largest Market Share in 2014
12.5.9.3 Other Countries in RoW: Sustainable Packaging Market Size, By Application
12.5.9.3.1 Personal Care Packaging is Projected to Grow at the Second-Highest CAGR By 2020
13 Competitive Landscape (Page No. - 208)
13.1 Overview
13.2 Competitive Situations & Trends
13.3 Key Growth Strategies, 2011–2015
13.3.1 Mergers & Acquisitions
13.3.2 New Product Developments
13.3.3 Investments & Expansions
13.3.4 Partnerships, Agreements & Joint Ventures
14 Company Profiles (Page No. - 213)
(Company at A Glance, Recent Financials, Products & Services, Strategies & Insights, & Recent Developments)*
14.1 Introduction
14.2 Amcor Limited
14.3 Bemis Company, Inc.
14.4 Tetra Laval International S.A.
14.5 Mondi PLC
14.6 Westrock Company
14.7 BASF SE
14.8 Sonoco Products Company
14.9 Smurfit Kappa Group PLC
14.10 Sealed Air Corporation
14.11 Huhtamaki OYJ
*Details on Company at A Glance, Recent Financials, Products & Services, Strategies & Insights, & Recent Developments Might Not Be Captured in Case of Unlisted Companies.
15 Appendix (Page No. - 244)
15.1 Insights of Industry Experts
15.2 Discussion Guide
15.3 Company Developments
15.3.1 Mergers & Acquisitions
15.3.2 New Product Development
15.4 Introducing RT: Real-Time Market Intelligence
15.5 Available Customizations
15.6 Related Reports
List of Tables (218 Tables)
Table 1 Sustainable Packaging Market Size, By Material, 2013–2020 (USD Billion)
Table 2 Sustainable Packaging Market Size, By Material, 2013–2020 (MMT)
Table 3 Sustainable Paper & Paperboard Packaging Market Size, By Grade,2013–2020 (USD Billion)
Table 4 Sustainable Paper & Paperboard Packaging Market Size, By Grade,2013–2020 (MMT)
Table 5 Sustainable Paper & Paperboard Packaging Market Size, By Packaging Type, 2013–2020 (USD Billion)
Table 6 Sustainable Paper & Paperboard Packaging Market Size, By Packaging Type, 2013–2020 (MMT)
Table 7 Sustainable Plastic Packaging Market Size, By Type,2013–2020 (USD Billion)
Table 8 Sustainable Plastic Market Packaging Size, By Type, 2013–2020 (MMT)
Table 9 Sustainable Plastic Packaging Market Size, By Packaging Type,2013–2020 (USD Billion)
Table 10 Sustainable Plastic Packaging Market Size, By Packaging Type,2013–2020 (MMT)
Table 11 Sustainable Metal Packaging Market Size, By Type,2013–2020 (USD Billion)
Table 12 Sustainable Metal Packaging Market Size, By Type, 2013–2020 (MMT)
Table 13 Sustainable Metal Packaging Market Size, By Packaging Type,2013–2020 (USD Billion)
Table 14 Sustainable Metal Packaging Market Size, By Packaging Type,2013–2020 (MMT)
Table 15 Sustainable Glass Packaging Market Size, By Type,2013–2020 (USD Billion)
Table 16 Sustainable Glass Packaging Market Size, By Type, 2013–2020 (MMT)
Table 17 Sustainable Glass Packaging Market Size, By Packaging Type,2013–2020 (USD Billion)
Table 18 Sustainable Glass Packaging Market Size, By Packaging Type,2013–2020 (MMT)
Table 19 Sustainable Packaging Market Size, By Layer, 2013–2020 (USD Billion)
Table 20 Sustainable Packaging Market Size, By Layer, 2013–2020 (MMT)
Table 21 Primary Sustainable Packaging Market Size, By Material,2013–2020 (USD Billion)
Table 22 Primary Sustainable Packaging Market Size, By Material,2013–2020 (MMT)
Table 23 Secondary Sustainable Packaging Market Size, By Material,2013–2020 (USD Billion)
Table 24 Secondary Sustainable Packaging Market Size, By Material,2013–2020 (MMT)
Table 25 Tertiary Sustainable Packaging Market Size, By Material,2013–2020 (USD Billion)
Table 26 Tertiary Sustainable Packaging Market Size, By Material,2013–2020 (MMT)
Table 27 Sustainable Packaging Market Size, By Process, 2013–2020 (USD Billion)
Table 28 Sustainable Packaging Market Size, By Process, 2013–2020 (MMT)
Table 29 Recycled Content Packaging Market Size, By Material,2013–2020 (USD Billion)
Table 30 Recycled Content Packaging Market Size, By Material, 2013–2020 (MMT)
Table 31 Reusable Packaging Market Size, By Material, 2013–2020 (USD Billion)
Table 32 Reusable Packaging Market Size, By Material, 2013–2020 (MMT)
Table 33 Degradable Packaging Market Size, By Material, 2013–2020 (USD Billion)
Table 34 Degradable Packaging Market Size, By Material, 2013–2020 (MMT)
Table 35 Sustainable Packaging Market Size, By Function, 2013–2020 (USD Billion)
Table 36 Sustainable Packaging Market Size, By Function, 2013–2020 (MMT)
Table 37 Active Packaging Market Size, By Type, 2013–2020 (USD Billion)
Table 38 Active Packaging Market Size, By Type, 2013–2020 (MMT)
Table 39 Molded Packaging Market Size, By Type, 2013–2020 (USD Billion)
Table 40 Molded Packaging Market Size, By Type, 2013–2020 (MMT)
Table 41 Alternate Fiber Packaging Market Size, By Type, 2013–2020 (USD Billion)
Table 42 Alternate Fiber Packaging Market Size, By Type, 2013–2020 (MMT)
Table 43 Sustainable Packaging Market Size, By Application,2013–2020 (USD Billion)
Table 44 Sustainable Packaging Market Size, By Application, 2013–2020 (MMT)
Table 45 Food & Beverage Packaging Market Size, By Process,2013–2020 (USD Billion)
Table 46 Food & Beverage Packaging Market Size, By Process, 2013–2020 (MMT)
Table 47 Food & Beverage Packaging Market Size, By Material,2013–2020 (USD Billion)
Table 48 Food & Beverage Packaging Market Size, By Material, 2013–2020 (MMT)
Table 49 Food & Beverage Packaging Market Size, By Function,2013–2020 (USD Billion)
Table 50 Food & Beverage Packaging Market Size, By Function, 2013–2020 (MMT)
Table 51 Healthcare Packaging Market Size, By Process, 2013–2020 (USD Billion)
Table 52 Healthcare Packaging Market Size, By Process, 2013–2020 (MMT)
Table 53 Healthcare Packaging Market Size, By Material, 2013–2020 (USD Billion)
Table 54 Healthcare Packaging Market Size, By Material, 2013–2020 (MMT)
Table 55 Healthcare Packaging Market Size, By Function, 2013–2020 (USD Billion)
Table 56 Healthcare Packaging Market Size, By Function, 2013–2020 (MMT)
Table 57 Personal Care Packaging Market Size, By Process,2013–2020 (USD Billion)
Table 58 Personal Care Packaging Market Size, By Process, 2013–2020 (MMT)
Table 59 Personal Care Packaging Market Size, By Material,2013–2020 (USD Billion)
Table 60 Personal Care Packaging Market Size, By Material, 2013–2020 (MMT)
Table 61 Personal Care Packaging Market Size, By Function,2013–2020 (USD Billion)
Table 62 Personal Care Packaging Market Size, By Function, 2013–2020 (MMT)
Table 63 Other Applications Packaging Market Size, By Process,2013–2020 (USD Billion)
Table 64 Other Applications Packaging Market Size, By Process, 2013–2020 (MMT)
Table 65 Other Applications Packaging Market Size, By Material,2013–2020 (USD Billion)
Table 66 Other Applications Packaging Market Size, By Material, 2013–2020 (MMT)
Table 67 Other Applications Packaging Market Size, By Function,2013–2020 (USD Billion)
Table 68 Other Applications Packaging Market Size, By Function, 2013–2020 (MMT)
Table 69 Sustainable Packaging Market Size, By Region, 2013–2020 (USD Billion)
Table 70 Sustainable Packaging Market Size, By Region, 2013–2020 (MMT)
Table 71 Asia-Pacific: Sustainable Packaging Market Size, By Country,2013–2020 (USD Billion)
Table 72 Asia-Pacific: Sustainable Packaging Market Size, By Country,2013–2020 (MMT)
Table 73 Asia-Pacific: Sustainable Packaging Market Size, By Material,2013–2020 (USD Billion)
Table 74 Asia-Pacific: Sustainable Packaging Market Size, By Material,2013–2020 (MMT)
Table 75 Asia-Pacific: Market Size, By Process,2013–2020 (USD Billion)
Table 76 Asia-Pacific: Sustainable Packaging Market Size, By Process,2013–2020 (MMT)
Table 77 Asia-Pacific: Sustainable Packaging Market Size, By Function,2013–2020 (USD Billion)
Table 78 Asia-Pacific: Market Size, By Function,2013–2020 (MMT)
Table 79 Asia-Pacific: Sustainable Packaging Market Size, By Layer,2013–2020 (USD Billion)
Table 80 Asia-Pacific: Sustainable Packaging Market Size, By Layer,2013–2020 (MMT)
Table 81 Asia-Pacific: Market Size, By Application,2013–2020 (USD Billion)
Table 82 Asia-Pacific: Sustainable Packaging Market Size, By Application,2013–2020 (MMT)
Table 83 China: Sustainable Packaging Market Size, By Material,2013–2020 (USD Billion)
Table 84 China: Market Size, By Material, 2013–2020 (MMT)
Table 85 China: Sustainable Packaging Market Size, By Process,2013–2020 (USD Billion)
Table 86 China: Sustainable Packaging Market Size, By Process, 2013–2020 (MMT)
Table 87 China: Market Size, By Application,2013–2020 (USD Billion)
Table 88 China: Market Size, By Application,2013–2020 (MMT)
Table 89 Japan: Sustainable Packaging Market Size, By Material,2013–2020 (USD Billion)
Table 90 Japan: Market Size, By Material, 2013–2020 (MMT)
Table 91 Japan: Sustainable Packaging Market Size, By Process,2013–2020 (USD Billion)
Table 92 Japan: Sustainable Packaging Market Size, By Process, 2013–2020 (MMT)
Table 93 Japan: Sustainable Packaging Market Size, By Application,2013–2020 (USD Billion)
Table 94 Japan: Market Size, By Application,2013–2020 (MMT)
Table 95 Australia: Sustainable Packaging Market Size, By Material,2013–2020 (USD Billion)
Table 96 Australia: Market Size, By Material,2013–2020 (MMT)
Table 97 Australia: Market Size, By Process,2013–2020 (USD Billion)
Table 98 Australia: Market Size, By Process,2013–2020 (MMT)
Table 99 Australia: Market Size, By Application,2013–2020 (USD Billion)
Table 100 Australia:Market Size, By Application,2013–2020 (MMT)
Table 101 India: Sustainable Packaging Market Size, By Material,2013–2020 (USD Billion)
Table 102 India: Market Size, By Material, 2013–2020 (MMT)
Table 103 India: Sustainable Packaging Market Size, By Process,2013–2020 (USD Billion)
Table 104 India: Sustainable Packaging Market Size, By Process, 2013–2020 (MMT)
Table 105 India: Sustainable Packaging Market Size, By Application,2013–2020 (USD Billion)
Table 106 India: Market Size, By Application,2013–2020 (MMT)
Table 107 Rest of Asia-Pacific: Sustainable Packaging Market Size, By Material, 2013–2020 (USD Billion)
Table 108 Rest of Asia-Pacific: Market Size, By Material, 2013–2020 (MMT)
Table 109 Rest of Asia-Pacific: Market Size, By Process, 2013–2020 (USD Billion)
Table 110 Rest of Asia-Pacific: Market Size, By Process, 2013–2020 (MMT)
Table 111 Rest of Asia-Pacific: Market Size, By Application, 2013–2020 (USD Billion)
Table 112 Rest of Asia-Pacific: Market Size, By Application, 2013–2020 (MMT)
Table 113 North America: Sustainable Packaging Market Size, By Country,2013–2020 (USD Billion)
Table 114 North America: Market Size, By Country,2013–2020 (MMT)
Table 115 North America: Sustainable Packaging Market Size, By Material,2013–2020 (USD Billion)
Table 116 North America: Sustainable Packaging Market Size, By Material,2013–2020 (MMT)
Table 117 North America: Market Size, By Process,2013–2020 (USD Billion)
Table 118 North America: Market Size, By Process,2013–2020 (MMT)
Table 119 North America: Sustainable Packaging Market Size, By Function,2013–2020 (USD Billion)
Table 120 North America: Sustainable Packaging Market Size, By Function,2013–2020 (MMT)
Table 121 North America: Market Size, By Layer,2013–2020 (USD Billion)
Table 122 North America: Market Size, By Layer,2013–2020 (MMT)
Table 123 North America: Market Size, By Application,2013–2020 (USD Billion)
Table 124 North America: Market Size, By Application,2013–2020 (MMT)
Table 125 U.S.: Sustainable Packaging Market Size, By Material,2013–2020 (USD Billion)
Table 126 U.S.: Market Size, By Material, 2013–2020 (MMT)
Table 127 U.S.: Sustainable Packaging Market Size, By Process,2013–2020 (USD Billion)
Table 128 U.S.: Sustainable Packaging Market Size, By Process, 2013–2020 (MMT)
Table 129 U.S.: Market Size, By Application,2013–2020 (USD Billion)
Table 130 U.S.: Market Size, By Application, 2013–2020 (MMT)
Table 131 Canada: Sustainable Packaging Market Size, By Material,2013–2020 (USD Billion)
Table 132 Canada: Sustainable Packaging Market Size, By Material,2013–2020 (MMT)
Table 133 Canada: Sustainable Packaging Market Size, By Process,2013–2020 (USD Billion)
Table 134 Canada: Sustainable Packaging Market Size, By Process,2013–2020 (MMT)
Table 135 Canada: Sustainable Packaging Market Size, By Application,2013–2020 (USD Billion)
Table 136 Canada: Sustainable Packaging Market Size, By Application,2013–2020 (MMT)
Table 137 Mexico: Sustainable Packaging Market Size, By Material,2013–2020 (USD Billion)
Table 138 Mexico: Sustainable Packaging Market Size, By Material,2013–2020 (MMT)
Table 139 Mexico: Sustainable Packaging Market Size, By Process,2013–2020 (USD Billion)
Table 140 Mexico: Sustainable Packaging Market Size, By Process, 2013–2020 (MMT)
Table 141 Mexico: Sustainable Packaging Market Size, By Application,2013–2020 (USD Billion)
Table 142 Mexico: Sustainable Packaging Market Size, By Application,2013–2020 (MMT)
Table 143 Europe: Sustainable Packaging Market Size, By Country,2013–2020 (USD Billion)
Table 144 Europe: Sustainable Packaging Market Size, By Country,2013–2020 (MMT)
Table 145 Europe: Sustainable Packaging Market Size, By Material,2013–2020 (USD Billion)
Table 146 Europe: Sustainable Packaging Market Size, By Material,2013–2020 (MMT)
Table 147 Europe: Sustainable Packaging Market Size, By Process,2013–2020 (USD Billion)
Table 148 Europe: Sustainable Packaging Market Size, By Process,2013–2020 (MMT)
Table 149 Europe: Sustainable Packaging Market Size, By Function,2013–2020 (USD Billion)
Table 150 Europe: Sustainable Packaging Market Size, By Function,2013–2020 (MMT)
Table 151 Europe: Sustainable Packaging Market Size, By Layer,2013–2020 (USD Billion)
Table 152 Europe: Sustainable Packaging Market Size, By Layer, 2013–2020 (MMT)
Table 153 Europe: Sustainable Packaging Market Size, By Application,2013–2020 (USD Billion)
Table 154 Europe: Sustainable Packaging Market Size, By Application,2013–2020 (MMT)
Table 155 Germany: Sustainable Packaging Market Size, By Material,2013–2020 (USD Billion)
Table 156 Germany: Sustainable Packaging Market Size, By Material,2013–2020 (MMT)
Table 157 Germany: Sustainable Packaging Market Size, By Process,2013–2020 (USD Billion)
Table 158 Germany: Sustainable Packaging Market Size, By Process,2013–2020 (MMT)
Table 159 Germany: Sustainable Packaging Market Size, By Application,2013–2020 (USD Billion)
Table 160 Germany: Sustainable Packaging Market Size, By Application,2013–2020 (MMT)
Table 161 U.K.: Sustainable Packaging Market Size, By Material,2013–2020 (USD Billion)
Table 162 U.K.: Sustainable Packaging Market Size, By Material, 2013–2020 (MMT)
Table 163 U.K.: Sustainable Packaging Market Size, By Process,2013–2020 (USD Billion)
Table 164 U.K.: Sustainable Packaging Market Size, By Process, 2013–2020 (MMT)
Table 165 U.K.: Sustainable Packaging Market Size, By Application,2013–2020 (USD Billion)
Table 166 U.K.: Sustainable Packaging Market Size, By Application, 2013–2020 (MMT)
Table 167 France: Sustainable Packaging Market Size, By Material,2013–2020 (USD Billion)
Table 168 France: Sustainable Packaging Market Size, By Material,2013–2020 (MMT)
Table 169 France: Sustainable Packaging Market Size, By Process,2013–2020 (USD Billion)
Table 170 France: Sustainable Packaging Market Size, By Process, 2013–2020 (MMT)
Table 171 France: Sustainable Packaging Market Size, By Application,2013–2020 (USD Billion)
Table 172 France: Sustainable Packaging Market Size, By Application,2013–2020 (MMT)
Table 173 Russia: Sustainable Packaging Market Size, By Material,2013–2020 (USD Billion)
Table 174 Russia: Sustainable Packaging Market Size, By Material, 2013–2020 (MMT)
Table 175 Russia: Sustainable Packaging Market Size, By Process,2013–2020 (USD Billion)
Table 176 Russia: Sustainable Packaging Market Size, By Process, 2013–2020 (MMT)
Table 177 Russia: Sustainable Packaging Market Size, By Application,2013–2020 (USD Billion)
Table 178 Russia: Sustainable Packaging Market Size, By Application,2013–2020 (MMT)
Table 179 Rest of Europe: Sustainable Packaging Market Size, By Material,2013–2020 (USD Billion)
Table 180 Rest of Europe: Sustainable Packaging Market Size, By Material,2013–2020 (MMT)
Table 181 Rest of Europe: Sustainable Packaging Market Size, By Process,2013–2020 (USD Billion)
Table 182 Rest of Europe: Sustainable Packaging Market Size, By Process,2013–2020 (MMT)
Table 183 Rest of Europe: Sustainable Packaging Market Size, By Application, 2013–2020 (USD Billion)
Table 184 Rest of Europe: Sustainable Packaging Market Size, By Application, 2013–2020 (MMT)
Table 185 RoW: Sustainable Packaging Market Size, By Country,2013–2020 (USD Billion)
Table 186 RoW: Sustainable Packaging Market Size, By Country, 2013–2020 (MMT)
Table 187 RoW: Sustainable Packaging Market Size, By Material,2013–2020 (USD Billion)
Table 188 RoW: Sustainable Packaging Market Size, By Material, 2013–2020 (MMT)
Table 189 RoW: Sustainable Packaging Market Size, By Process,2013–2020 (USD Billion)
Table 190 RoW: Sustainable Packaging Market Size, By Process, 2013–2020 (MMT)
Table 191 RoW: Sustainable Packaging Market Size, By Function,2013–2020 (USD Billion)
Table 192 RoW: Sustainable Packaging Market Size, By Function, 2013–2020 (MMT)
Table 193 RoW: Sustainable Packaging Market Size, By Layer,2013–2020 (USD Billion)
Table 194 RoW: Sustainable Packaging Market Size, By Layer, 2013–2020 (MMT)
Table 195 RoW: Sustainable Packaging Market Size, By Application,2013–2020 (USD Billion)
Table 196 RoW: Sustainable Packaging Market Size, By Application,2013–2020 (MMT)
Table 197 Brazil: Sustainable Packaging Market Size, By Material,2013–2020 (USD Billion)
Table 198 Brazil: Sustainable Packaging Market Size, By Material, 2013–2020 (MMT)
Table 199 Brazil: Sustainable Packaging Market Size, By Process,2013–2020 (USD Billion)
Table 200 Brazil: Sustainable Packaging Market Size, By Process, 2013–2020 (MMT)
Table 201 Brazil: Sustainable Packaging Market Size, By Application,2013–2020 (USD Billion)
Table 202 Brazil: Sustainable Packaging Market Size, By Application,2013–2020 (MMT)
Table 203 South Africa: Sustainable Packaging Market Size, By Material,2013–2020 (USD Billion)
Table 204 South Africa: Sustainable Packaging Market Size, By Material,2013–2020 (MMT)
Table 205 South Africa: Sustainable Packaging Market Size, By Process,2013–2020 (USD Billion)
Table 206 South Africa: Sustainable Packaging Market Size, By Process,2013–2020 (MMT)
Table 207 South Africa: Sustainable Packaging Market Size, By Application,2013–2020 (USD Billion)
Table 208 South Africa: Sustainable Packaging Market Size, By Application,2013–2020 (MMT)
Table 209 Other Countries in RoW: Sustainable Packaging Market Size, By Material, 2013–2020 (USD Billion)
Table 210 Other Countries in RoW: Sustainable Packaging Market Size, By Material, 2013–2020 (MMT)
Table 211 Other Countries in RoW: Sustainable Packaging Market Size, By Process, 2013–2020 (USD Billion)
Table 212 Other Countries in RoW: Sustainable Packaging Market Size, By Process, 2013–2020 (MMT)
Table 213 Other Countries in RoW: Sustainable Packaging Market Size, By Application, 2013–2020 (USD Billion)
Table 214 Other Countries in RoW: Sustainable Packaging Market Size, By Application, 2013–2020 (MMT)
Table 215 Mergers & Acquisitions, 2011–2015
Table 216 New Product Developments, 2011–2015
Table 217 Investments & Expansions, 2011–2015
Table 218 Partnerships, Agreements & Joint Ventures, 2011–2015
List of Figures (53 Figures)
Figure 1 Research Design
Figure 2 Breakdown of Primaries, By Company Type, Designation & Region
Figure 3 Market Size Estimation Methodology: Top-Down Approach
Figure 4 Sustainable Packaging Market Size, By Material,2015 vs. 2020 (USD Billion)
Figure 5 Sustainable Packaging Market Size, By Region, 2015 vs. 2020 (USD Billion)
Figure 6 India is Projected to Be the Fastest-Growing Market for Sustainable Packaging From 2015 to 2020
Figure 7 Leading Market Players Adopted Mergers & Acquisitions as the Key Strategy From 2011 to 2015
Figure 8 Emerging Economies Offer Attractive Opportunities in the Sustainable Packaging Market
Figure 9 Active Packaging Segment Occupies the Largest Share Among All Functions of Sustainable Packaging
Figure 10 Recycled Content Packaging Captured the Largest Share in the Emerging Asia-Pacific Market in 2014
Figure 11 India Projected to Be the Fastest-Growing Country for Sustainable Packaging, 2015-2020
Figure 12 Asia-Pacific is Projected to Be the Fastest Growing Market From2015 to 2020
Figure 13 Emerging Markets to Grow Faster Than Developed Markets (2015-2020)
Figure 14 Food & Beverage Packaging Had the Largest Size in 2014
Figure 15 The Sustainable Packaging Market in Asia-Pacific Region is Experiencing High Growth
Figure 16 Evolution of the Sustainable Packaging Market
Figure 17 Sustainable Packaging Market Segmentation
Figure 18 Shift in Consumer Preference Towards Eco-Friendly Materials is the Main Factor Driving the Sustainable Packaging Market
Figure 19 Global E-Commerce Industry Market Size, 2013-2015
Figure 20 Fluctuations in Price of Natural Gas From 2008-2015
Figure 21 Sustainable Packaging Value Chain
Figure 22 Sustainable Packaging Market, Average Price Analysis, By Region
Figure 23 Sustainable Packaging Market, Average Price Analysis, By Material
Figure 24 Sustainable Packaging Market, Average Price Analysis, By Application
Figure 25 Primary Packaging Held the Largest Share in the Sustainable Packaging Market, By Layer (2014)
Figure 26 Active Packaging Dominated the Sustainable Packaging Market in 2015
Figure 27 Food & Beverage Packaging Projected to Dominate the Application Segment of Sustainable Packaging Between 2015 & 2020
Figure 28 Geographical Snapshot: Sustainable Packaging Market Growth Rate, (2015-2020)
Figure 29 India Poised to Grow at the Highest CAGR By 2020
Figure 30 Asia-Pacific: Market Snapshot
Figure 31 North America: Market Snapshot
Figure 32 Europe: Market Snapshot
Figure 33 RoW: Market Snapshot
Figure 34 Companies Adopted Acquisitions as Their Key Growth Strategy During the Studied Period (2011–2015)
Figure 35 Westrock Company Grew at the Highest Rate, 2011–2014
Figure 36 2012 & 2014 Saw the Most Number of Developments During the Studied Period
Figure 37 Geographic Revenue Mix of Top 3 Players
Figure 38 Key Financial Ratios
Figure 39 Amcor Limited: Company Snapshot
Figure 40 Amcor Limited: SWOT Analysis
Figure 41 Bemis Company, Inc.: Company Snapshot
Figure 42 Bemis Company, Inc.:SWOT Analysis
Figure 43 Tetra Laval International S.A.: Company Snapshot
Figure 44 Tetra Laval International S.A.:SWOT Analysis
Figure 45 Mondi PLC: Company Snapshot
Figure 46 Mondi PLC: SWOT Analysis
Figure 47 Westrock Company: Company Snapshot
Figure 48 Westrock Company :SWOT Analysis
Figure 49 BASF SE: Company Snapshot
Figure 50 Sonoco Products Company: Company Snapshot
Figure 51 Smurfit Kappa Group PLC: Company Snapshot
Figure 52 Sealed Air Corporation: Company Snapshot
Figure 53 Huhtamaki OYJ: Company Snapshot


Growth opportunities and latent adjacency in Sustainable Packaging Market