Telecom Cloud Billing Market by Type of Billing (Convergent, Prepaid, Postpaid, Interconnect), Cloud Platform, Deployment, End User, Service, Rate of Charging Mode, and Region - Global Forecast to 2021


[160 Pages Report] The telecom cloud billing market size is expected to grow from USD 2.49 Billion in 2016 to USD 8.22 Billion by 2021, at a Compound Annual Growth Rate (CAGR) of 27.0% from 2016 to 2021.
The telecom billing solutions include a wide array of activities ranging from the process of usage tracking for voice and data, aggregating, levying charges upon respective tariffs, generating invoices to the customers, enabling the customer relationship management through the various cloud based solutions on public, private, or hybrid cloud by the vendor (Operations Support Systems/Business Support System (OSS/BSS) provider) for various Mobile Network Operators (MNOs) all enabled by multi-tenancy.
The objectives of the report are to define, describe, and forecast the telecom cloud billing market on the basis of billing, application, cloud platform, deployment, services, end user, rate of charging mode, and region; to provide detailed information regarding the key factors influencing market growth (drivers, restraints, opportunities, and challenges); to track and analyze the market scenario on the basis of technological developments, product launches, and mergers & acquisitions; and to forecast the market size of market segments with respect to five main regions, namely, North America, Europe, Asia-Pacific (APAC), Middle East and Africa (MEA), and Latin America. The base year considered for the study is 2015 and the forecast period has been determined from 2016 to 2021.
This research study involves extensive usage of secondary sources, directories, and databases (such as Hoovers, Bloomberg Businessweek, Factiva, and OneSource) to identify and collect information useful for this technical, market-oriented, and commercial aspects of the telecom cloud billing market. The below points explain the research methodology:
- Analysis of the telecom cloud billing market begins with capturing data on key vendor revenues through secondary research sources such as ITU, TM Forum, World Bank, global billing associations, next generation mobile networks, and GSM Association.
- Market coverage includes telecom cloud billing vendors such as Amdocs, Ericsson, Netcracker Technology, Oracle, and CGI Group, Inc., a few of them changing their offerings to meet new customer expectations.
- Insights through in-depth interviews with the top management and thought leaders of the organization are taken into account.
- The vendor offerings are also taken into consideration to determine the market segmentation.
- The bottom-up procedure was employed to arrive at the overall market size of the global market from the revenue of the key players in the market.
- Overall market size values are finalized by triangulation with the supply side data which include the product developments, supply chain, and value chain of telecom cloud billing across the globe.
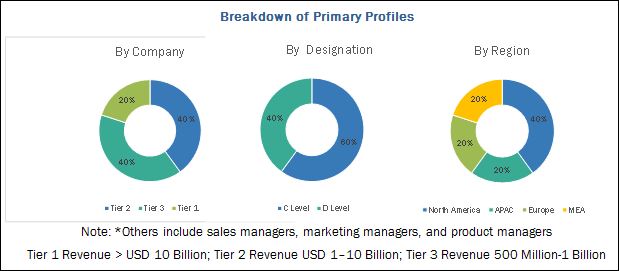
After arriving at the overall market size the total market has been split into several segments and sub segments. The figure below shows the break-down of the primaries on the basis of company, designation, and region, conducted during the research study.
The figure below shows the break-down of the primaries on the basis of company, designation, and region, conducted during the research study.
To know about the assumptions considered for the study, download the pdf brochure
The major vendors in the telecom cloud billing market are Amdocs (U.S.), Oracle Corporation (U.S.), CGI Group, Inc. (Canada), Ericsson (Sweden), Netcracker Technology (U.K.), Cerillion (U.K), AsiaInfo (China), Computer Science Corporation (U.S.), Redknee Solutions, Inc. (U.S.), Huawei Technologies (China), and Tech Mahindra (India). Further, the report also includes key innovators such as Zuora (U.S.), Mind CTI (Israel), Inc., and jBilling (Canada), who provide telecom cloud billing services and solutions to telecom operators to cater to their requirements and communications needs.
Key Target Audience
- Telecom Cloud Billing Vendors
- Content Providers
- Network Operators
- Communication Service Providers
- Mobile Virtual Network Operators (MVNOs)
- Mobile Virtual Network Enablers (MVNEs)
- Telecom Operators
- System Integrators
- Telecom Equipment Providers
Scope of the Report
The telecom cloud billing market report is broadly segmented into billing, application, cloud platform, deployment, services, end user, rate of charging mode, and region.
Telecom Cloud Billing Market, by Type of Billing
- Convergent
- Prepaid
- Postpaid
- Interconnect
- Roaming
- Others (Direct to Consumer (D2C) and Metered)
Telecom Cloud Billing Market, by Application
- Revenue Management
- Account Management
- Customer Management
Telecom Cloud Billing Market, by Cloud Platform
- SaaS
- Others (IaaS and PaaS)
Telecom Cloud Billing Market, by Deployment
- Public
- Private
- Hybrid
Telecom Cloud Billing Market, by Rate of Charging Mode
- Subscription-Based
- Usage-Based
Telecom Cloud Billing Market, by Service
- Professional
- Managed
Telecom Cloud Billing Market, by End User
- Individuals
- Enterprises
Telecom Cloud Billing Market, by Region
- North America
- Europe
- APAC
- MEA
- Latin America
Available Customization
With the given market data, MarketsandMarkets offers customizations based on company-specific needs. The following customization options are available for the report:
Geographic Analysis
- Further breakdown of the APAC market into countries contributing 75% to the regional market size
- Further breakdown of the North American market into countries contributing 75% to the regional market size
- Further breakdown of the Latin American market into countries contributing 75% to the regional market size
- Further breakdown of the MEA market into countries contributing 75% to the regional market size
- Further breakdown of the European market into countries contributing 75% to the regional market size
Company Information
- Detailed analysis and profiling of additional market players (Up to 5).
MarketsandMarkets forecasts the telecom cloud billing market size to grow from USD 2.49 Billion in 2016 to USD 8.22 Billion by 2021, at a Compound Annual Growth Rate (CAGR) of 27.0% from 2016 to 2021. Lower operational & administration costs, advancement & increase in adoption of cloud-based technologies, increasing mobile penetration and high subscriber growth, need for real-time billing, and increased demand for bundled services are some of the driving forces in the market.
The scope of this report covers the telecom cloud billing market by billing, application, cloud platform, deployment, services, end user, rate of charging mode, and region. Convergent billing is expected to hold the largest market share because telecom operators are looking at providing combined offerings for their services. Telecom operators offer different services such as voice, data, IPTV, VOIP, prepaid, and post-paid services with different payment models. The customers select one of above services from the operator. All of these offerings need to be served on a single system that can accommodate any line of business, any subscriber type, and any payment model.
Among applications, the customer management segment is expected to grow at the highest rate in the telecom cloud billing market during the forecast period. Customer management is the backbone of any business process. It encompasses many functionalities such as customer-interface management, order management, product catalogue, customer service offering, subscriber self-care management, sales & marketing, rate plans and rating, discounting, invoicing, problem handling, auditing and security. Customer management enables Cloud Service Providers (CSPs) to deliver a consistent user experience across the overall business system and to manage all aspects of their relationship with customers.
Among cloud platform, the Software as a Service (SaaS) platform is expected to dominate the telecom cloud billing market and hold the largest market share. SaaS model allows CSPs to quickly support new services for their customers and also enables converging of multiple billing systems like prepaid and postpaid onto a single platform. It brings new services to market more economically without installing the entire infrastructure and to support it. One of the major benefits of adopting cloud-based SaaS operations is reduce initial capital costs.
Among the end users, individual customers segment is expected to hold the largest market share during the forecast period. In the telecom industry,
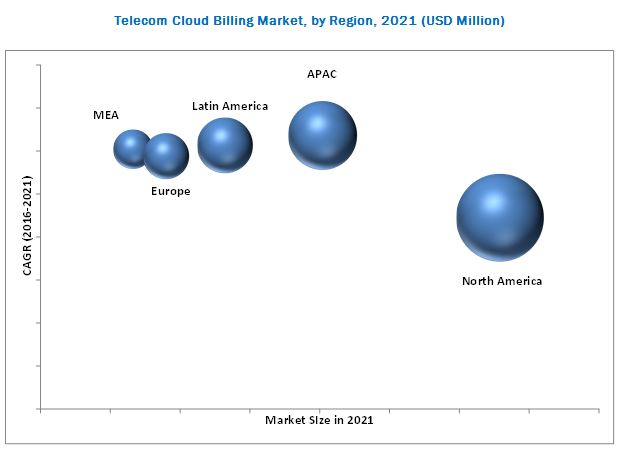
Asia-Pacific (APAC) is expected to grow at the highest growth rate in the telecom cloud billing market during the forecast period. The enormous population in the region has led to an extensive pool of subscriber base for telecom companies. There are several factors driving the impressive growth in APAC such as rapid economic development, globalization and foreign direct investment, increasing penetration of smartphones, and rapid internet adoption in individual�s customers.
However, telecom regulations and use of legacy systems would be the restraining factors for growth of the telecom cloud billing market.
The major vendors in the telecom cloud billing market include Amdocs (U.S.), Oracle Corporation (U.S.), CGI Group, Inc. (Canada), Ericsson (Sweden), Netcracker Technology (U.K.), Cerillion (U.K), AsiaInfo (China), Computer Science Corporation (U.S.), Redknee Solutions, Inc. (U.S.), Huawei Technologies (China), and Tech Mahindra (India). These players adopted various strategies such as new product launches, partnerships, agreements, collaborations, mergers & acquisitions, and business expansions to cater to the needs of their customers. The report also includes key innovators in the market, such as Zuora (U.S.), Mind CTI (Israel), Inc. and jBilling (Canada).
To speak to our analyst for a discussion on the above findings, click Speak to Analyst
 Exclusive indicates content/data unique to MarketsandMarkets and not available with any competitors.
Table of Contents
1 Introduction (Page No. - 15)
1.1 Objectives of the Report
1.2 Market Definition
1.3 Market Scope
1.3.1 Markets Covered
1.3.2 Years Considered for the Report
1.4 Currency
1.5 Limitations
1.6 Stakeholders
2 Research Methodology (Page No. - 19)
2.1 Introduction
2.1.1 Secondary Data
2.1.1.1 Key Data From Secondary Sources
2.1.2 Primary Data
2.1.2.1 Key Data From Primary Sources
2.1.2.2 Key Industry Insights
2.1.2.3 Breakdown of Primaries
2.2 Market Size Estimation
2.2.1 Bottom-Up Approach
2.2.2 Top-Down Approach
2.3 Market Breakdown and Data Triangulation
2.4 Vendor Dive Analysis
2.5 Research Assumptions
3 Executive Summary (Page No. - 29)
4 Premium Insights (Page No. - 33)
4.1 Attractive Market Opportunities in the Market
4.2 Market By Region, 2016 vs 2021
4.3 Market By Type of Billing, 2016�2021
4.4 Lifecycle Analysis, By Region, 2016�2021
5 Market Overview (Page No. - 37)
5.1 Introduction
5.2 Evolution
5.3 Market Segmentation
5.3.1 By Billing
5.3.2 By Application
5.3.3 By Rate of Charging Mode
5.3.4 By End User
5.3.5 By Deployment Type
5.3.6 By Service
5.3.7 By Cloud Platform
5.3.8 By Region
5.4 Market Dynamics
5.4.1 Drivers
5.4.1.1 Lower Operational and Administration Cost
5.4.1.2 Advancement and Increase in the Adoption of Cloud-Based Technologies
5.4.1.3 Increasing Mobile Penetration and High Subscriber Growth
5.4.1.4 Need for Real-Time Billing and Increased Demand for Bundled Services
5.4.2 Restraints
5.4.2.1 Telecom Regulations
5.4.2.2 Legacy Systems
5.4.3 Opportunities
5.4.3.1 Increasing Demand for Data and Vas Services
5.4.4 Challenges
5.4.4.1 High Volume of Customer Transactions and Continued Change in Network Technologies
5.4.4.2 Multiple Rating Parameters
6 Industry Trends (Page No. - 47)
6.1 Introduction
6.2 Value Chain Analysis
6.3 Strategic Benchmarking
7 Telecom Cloud Billing Market Analysis, By Type of Billing (Page No. - 50)
7.1 Introduction
7.2 Convergent
7.3 Prepaid
7.4 Postpaid
7.5 Interconnect
7.6 Roaming
7.7 Others
8 Telecom Cloud Billing Market Analysis, By Application (Page No. - 57)
8.1 Introduction
8.2 Revenue Management
8.3 Account Management
8.4 Customer Management
9 Telecom Cloud Billing Market Analysis, By Cloud Platform (Page No. - 62)
9.1 Introduction
9.2 Software as A Service
9.3 Infrastructure as A Service and Platform as A Service
10 Telecom Cloud Billing Market Analysis, By Deployment (Page No. - 66)
10.1 Introduction
10.2 Public
10.3 Private
10.4 Hybrid
11 Telecom Cloud Billing Market Analysis, By Rate of Charging Mode (Page No. - 71)
11.1 Introduction
11.2 Subscription Based
11.3 Usage Based
12 Telecom Cloud Billing Market Analysis, By Service (Page No. - 75)
12.1 Introduction
12.2 Professional
12.3 Managed
13 Telecom Cloud Billing Market Analysis, By End User (Page No. - 79)
13.1 Introduction
13.2 Individuals
13.3 Enterprises
14 Geographic Analysis (Page No. - 83)
14.1 Introduction
14.2 North America
14.3 Europe
14.4 Asia-Pacific
14.5 Middle East and Africa
14.6 Latin America
15 Competitive Landscape (Page No. - 105)
15.1 Overview
15.2 Telecom Cloud Billing: Vendor Analysis
15.3 Introduction
15.4 Telecom Cloud Billing: Product Portfolio Comparison
15.5 Portfolio Comparison
15.6 Competitive Situations and Trends
15.6.1 Agreements, Partnerships, and Collaborations
15.6.2 New Product/Service Developments
15.6.3 Mergers and Acquisitions
16 Company Profiles (Page No. - 113)
(Company at A Glance, Recent Financials, Products & Services, Strategies & Insights, & Recent Developments)*
16.1 Introduction
16.2 Amdocs, Inc.
16.3 Oracle Corporation
16.4 CGI Group, Inc.
16.5 Ericsson
16.6 Netcracker Technology (NEC Corporation)
16.7 Computer Sciences Corporation
16.8 Huawei Technologies
16.9 Redknee Solutions Inc.
16.10 Asiainfo, Inc.
16.11 Cerillion PLC
16.12 Tech Mahindra Limited
*Details on Company at A Glance, Recent Financials, Products & Services, Strategies & Insights, & Recent Developments Might Not Be Captured in Case of Unlisted Companies.
17 Key Innovators (Page No. - 143)
17.1 Zuora, Inc.
17.1.1 Business Overview
17.2 Mind CTI, Ltd.
17.2.1 Business Overview
17.3 Jbilling
17.3.1 Business Overview
18 Appendix (Page No. - 146)
18.1 Key Insights
18.2 Other Developments
18.3 Discussion Guide
18.4 Knowledge Store: Marketsandmarkets� Subscription Portal
18.5 Introducing RT: Real-Time Market Intelligence
18.6 Available Customizations
18.7 Related Reports
18.8 Author Details
List of Tables (75 Tables)
Table 1 Global Telecom Cloud Billing Market Size and Growth, 2014�2021 (USD Billion, Y-O-Y %)
Table 2 Market Size, By Type of Billing, 2014�2021 (USD Million)
Table 3 Convergent: Market Size, By Region, 2014�2021 (USD Million)
Table 4 Prepaid: Market Size, By Region, 2014�2021 (USD Million)
Table 5 Postpaid: Market Size, By Region, 2014�2021 (USD Million)
Table 6 Interconnect: Market Size, By Region, 2014�2021 (USD Million)
Table 7 Roaming: Market Size, By Region, 2014�2021 (USD Million)
Table 8 Others: Market Size, By Region, 2014�2021 (USD Million)
Table 9 Telecom Cloud Billing Market Size, By Application, 2014�2021 (USD Million)
Table 10 Revenue Management : Market Size, By Region, 2014�2021 (USD Million)
Table 11 Account Management: Market Size, By Region, 2014�2021 (USD Million)
Table 12 Customer Management: Market Size, By Region, 2014�2021 (USD Million)
Table 13 Market Size, By Cloud Platform, 2014�2021 (USD Million)
Table 14 Software as A Service: Market Size, By Region, 2014�2021 (USD Million)
Table 15 IaaS and PaaS: Market Size, By Region, 2014�2021 (USD Million)
Table 16 Market Size, By Deployment, 2014�2021 (USD Million)
Table 17 Public: Market Size, By Region, 2014�2021 (USD Million)
Table 18 Private: Market Size, By Region, 2014�2021 (USD Million)
Table 19 Hybrid: Market Size, By Region, 2014�2021 (USD Million)
Table 20 Market Size, By Rate of Charging Mode, 2014�2021 (USD Million)
Table 21 Subscription Based: Market Size, By Region, 2014�2021 (USD Million)
Table 22 Usage Based: Market Size, By Region, 2014�2021 (USD Million)
Table 23 Market Size, By Service, 2014�2021 (USD Million)
Table 24 Professional: Market Size, By Region, 2014�2021 (USD Million)
Table 25 Managed: Market Size, By Region, 2014�2021 (USD Million)
Table 26 Market Size, By End User, 2014�2021 (USD Million)
Table 27 Individuals: Market Size, By Region, 2014�2021 (USD Million)
Table 28 Enterprises: Market Size, By Region, 2014�2021 (USD Million)
Table 29 Telecom Cloud Billing Market Size, By Region, 2014�2021 (USD Million)
Table 30 North America: Market Size, By Country, 2014�2021 (USD Million)
Table 31 North America: Market Size, By Type of Billing, 2014�2021 (USD Million)
Table 32 North America: Market Size, By Application, 2014�2021 (USD Million)
Table 33 North America: Market Size, By Cloud Platform, 2014�2021 (USD Million)
Table 34 North America: Market Size, By Deployment, 2014�2021 (USD Million)
Table 35 North America: Market Size, By Rate of Charging Mode, 2014�2021 (USD Million)
Table 36 North America: Market Size, By Service, 2014�2021 (USD Million)
Table 37 North America: Market Size, By End User, 2014�2021 (USD Million)
Table 38 Europe: Telecom Cloud Billing Market Size, By Country, 2014�2021 (USD Million)
Table 39 Europe: Market Size, By Type of Billing, 2014�2021(USD Million)
Table 40 Europe: Market Size, By Application, 2014�2021 (USD Million)
Table 41 Europe: Market Size, By Cloud Platform, 2014�2021 (USD Million)
Table 42 Europe: Market Size, By Deployment, 2014�2021 (USD Million)
Table 43 Europe: Market Size, By Rate of Charging Mode, 2014�2021 (USD Million)
Table 44 Europe: Market Size, By Service, 2014�2021 (USD Million)
Table 45 Europe: Market Size, By End User, 2014�2021 (USD Million)
Table 46 Asia-Pacific: Telecom Cloud Billing Market Size, By Country, 2014�2021 (USD Million)
Table 47 Asia-Pacific: Market Size, By Type of Billing, 2014�2021(USD Million)
Table 48 Asia-Pacific: Market Size, By Application, 2014�2021 (USD Million)
Table 49 Asia-Pacific: Market Size, By Cloud Platform, 2014�2021 (USD Million)
Table 50 Asia-Pacific: Market Size, By Deployment, 2014�2021 (USD Million)
Table 51 Asia-Pacific: Market Size, By Rate of Charging Mode, 2014�2021 (USD Million)
Table 52 Asia-Pacific: Market Size, By Service, 2014�2021 (USD Million)
Table 53 Asia-Pacific: Market Size, By End User, 2014�2021 (USD Million)
Table 54 Middle East and Africa: Market Size, By Sub-Region, 2014�2021 (USD Million)
Table 55 Middle East and Africa: Market Size, By Type of Billing, 2014�2021(USD Million)
Table 56 Middle East and Africa: Market Size, By Application, 2014�2021 (USD Million)
Table 57 Middle East and Africa: Market Size, By Cloud Platform, 2014�2021 (USD Million)
Table 58 Middle East and Africa: Market Size, By Deployment, 2014�2021 (USD Million)
Table 59 Middle East and Africa: Market Size, By Rate of Charging Mode, 2014�2021 (USD Million)
Table 60 Middle East and Africa: Market Size, By Service, 2014�2021 (USD Million)
Table 61 Middle East and Africa: Market Size, By End User, 2014�2021 (USD Million)
Table 62 Latin America: Telecom Cloud Billing Market Size, By Country, 2014�2021 (USD Million)
Table 63 Latin America: Market Size, By Type of Billing, 2014�2021(USD Million)
Table 64 Latin America: Market Size, By Application, 2014�2021 (USD Million)
Table 65 Latin America: Market Size, By Cloud Platform, 2014�2021 (USD Million)
Table 66 Latin America: Market Size, By Deployment, 2014�2021 (USD Million)
Table 67 Latin America: Market Size, By Rate of Charging Mode, 2014�2021 (USD Million)
Table 68 Latin America: Market Size, By Service, 2014�2021 (USD Million)
Table 69 Latin America: Market Size, By End User, 2014�2021 (USD Million)
Table 70 Agreements, Partnerships, and Collaborations, 2016
Table 71 New Product/Service Developments, 2016
Table 72 Mergers and Acquisitions, 2016
Table 73 Agreements, Partnerships, and Collaborations, 2013�2016
Table 74 New Product Developments, 2013�2016
Table 75 Mergers and Acquisitions, 2013�2015
List of Figures (59 Figures)
Figure 1 Telecom Cloud Billing Market: Research Design
Figure 2 Market Size Estimation Methodology: Bottom-Up Approach
Figure 3 Market Size Estimation Methodology: Top-Down Approach
Figure 4 Market Breakdown and Data Triangulation
Figure 5 Vendor Analysis: Criteria Weightage
Figure 6 Market Size, By Type of Billing Snapshot: Convergent Billing is Expected to Grow at the Highest CAGR During the Forecast Period
Figure 7 Market Size, By Type of Application: Customer Management Category is Expected to Grow at the Highest CAGR During the Forecast Period
Figure 8 Market Size, By Deployment Type Snapshot: Deployment on Public Cloud is Expected to Grow at the Highest CAGR During the Forecast Period
Figure 9 Global Telecom Cloud Billing Market Share: North America is Estimated to Hold the Largest Market Share in 2016
Figure 10 Increasing Demand Among Telcos for Low-Cost Cloud-Based Solutions is Driving the Overall Growth of the Market
Figure 11 Asia-Pacific is Expected to Witness the Highest Growth Rate During the Forecast Period
Figure 12 Convergent Billing is Expected to Have the Largest Market Size in the Telecom Cloud Billing Market During the Forecast Period
Figure 13 Telecom Cloud Billing Regional Lifecycle: Asia-Pacific Exhibits the Highest Growth Potential During the Forecast Period
Figure 14 Market Investment Scenario
Figure 15 Telecom Cloud Billing Market Evolution
Figure 16 Market Segmentation: By Type of Billing
Figure 17 Market Segmentation: By Application
Figure 18 Market Segmentation: By Rate of Charging Mode
Figure 19 Market Segmentation: By End User
Figure 20 Market Segmentation: By Deployment Type
Figure 21 Market Segmentation: By Service
Figure 22 Market Segmentation: By Cloud Platform
Figure 23 Market Segmentation: By Region
Figure 24 Market Drivers, Restraints, Opportunities, and Challenges
Figure 25 Market Value Chain
Figure 26 Companies Adopted Different Strategies to Gain Competitive Advantage
Figure 27 Convergent Billing Expected to Account for the Largest Market Size in the Telecom Cloud Billing Market During the Forecast Period
Figure 28 Customer Management Application Exhibits the Highest Growth Rate in the Market During the Forecast Period
Figure 29 SaaS Cloud Exhibits A Higher Growth Rate in the Market, 2016�2021
Figure 30 Public Deployment Segment is Estimated to Have the Highest Growth During the Forecast Period
Figure 31 Usage Based Segment is Estimated to Have A Larger Market Size During the Forecast Period
Figure 32 Professional Services Segment is Estimated to Have A Largest Market Size During the Forecast Period
Figure 33 Individuals End User Segment is Estimated to Have the Largest Market Size During the Forecast Period
Figure 34 Asia-Pacific is Expected to Exhibit the Highest Growth Rate in the Market
Figure 35 North America: Market Snapshot
Figure 36 Asia-Pacific Market Snapshot
Figure 37 Companies Adopted Agreements, Partnerships, and Collaborations as the Key Growth Strategy During the Period 2014�2016
Figure 38 Evaluation Overview Table: Product Offerings
Figure 39 Evaluation Overview Table: Business Strategy
Figure 40 Telecom Cloud Billing Market: Portfolio Comparison
Figure 41 Market Evaluation Framework, 2013�2016
Figure 42 Battle for Market Share: Agreements, Partnerships, and Collaborations has Been the Key Strategy for Growth in the Forecast Period
Figure 43 Geographic Revenue Mix of Top 5 Market Players
Figure 44 Amdocs, Inc.: Company Snapshot
Figure 45 Amdocs, Inc.: SWOT Analysis
Figure 46 Oracle Corporation: Company Snapshot
Figure 47 Oracle Corporation: SWOT Analysis
Figure 48 CGI Group, Inc.: Company Snapshot
Figure 49 CGI Group, Inc.: SWOT Analysis
Figure 50 Ericsson: Company Snapshot
Figure 51 Ericsson: SWOT Analysis
Figure 52 Netcraker Technology (NEC Corporation): Company Snapshot
Figure 53 Netcraker Technology (NEC Corporation): SWOT Analysis
Figure 54 CSC: Company Snapshot
Figure 55 Huawei Technologies: Company Snapshot
Figure 56 Redknee Solutions Inc.: Company Snapshot
Figure 57 Cerillion, PLC.: Company Snapshot
Figure 58 Tech Mahindra Limited: Company Snapshot
Figure 59 Mind CTI, Ltd.: Company Snapshot


Growth opportunities and latent adjacency in Telecom Cloud Billing Market