Video Streaming Software Market

Video Streaming Software Market by Component (Solutions, Services), Streaming Type, Deployment Mode, Delivery Channel (Pay-Tv, Internet Protocol Tv, Over-The-Top), Monetization Model, Vertical and Region - Global Forecast to 2028

Report Code: TC 4278 May, 2023, by marketsandmarkets.com

[351 Pages Report] The video streaming software market size is expected to grow from USD 11.0 billion in 2023 to USD 25.5 billion by 2028 at a Compound Annual Growth Rate (CAGR) of 18.3% during the forecast period. In recent years, video streaming software has evolved to support advanced features such as virtual reality (VR) and 360-degree video streaming. These technologies have revolutionized the way we consume and interact with video content, opening new possibilities for entertainment, education, and even virtual tourism. The video streaming software market is sure to evolve even further, with new advancements in artificial intelligence (AI), machine learning (ML), and blockchain technology expected to enhance the user experience further.  The global recession caused by the COVID-19 pandemic has had a mixed impact on the video streaming software market. The pandemic has increased demand for video streaming services, as people spent more time at home and looked for entertainment options. Streaming services like Netflix, Amazon Prime, and Disney+ have reported significant increases in subscribers during the pandemic. This trend is expected to continue even as the pandemic subsides, as consumers have become accustomed to the convenience and flexibility of streaming services.

Video Streaming Software Market

To know about the assumptions considered for the study, Request for Free Sample Report

Video Streaming Software Market

To know about the assumptions considered for the study, download the pdf brochure

Recession Impact on the Video Streaming Software Market

The global recession caused by the COVID-19 pandemic has had a mixed impact on the video streaming software market. The pandemic has increased demand for video streaming services, as people spent more time at home and looked for entertainment options. Streaming services like Netflix, Amazon Prime, and Disney+ have reported significant increases in subscribers during the pandemic. This trend is expected to continue even as the pandemic subsides, as consumers have become accustomed to the convenience and flexibility of streaming services. However, the recession has also had a negative impact on the video streaming software market. Many businesses have had to cut costs and reduce their budgets, leading to a slowdown in investment in new technologies and services. The recession has also led to a decline in advertising revenue for streaming services, as companies cut back on their marketing budgets. Furthermore, the pandemic has disrupted the production of new content, which has impacted the availability of new releases on streaming platforms. This has resulted in a reduced demand for subscriptions to certain services.

While the recession has had a mixed impact on the video streaming software market, the long-term prospects for the industry remain positive. The continued growth in internet penetration, the increasing popularity of mobile devices, and the convenience and flexibility of streaming services are likely to drive continued growth in the market. However, the impact of the recession on the market is likely to be felt for some time, particularly in terms of investment and advertising revenue.

Video Streaming Software Market Dynamics

Driver:  Advancement in AI  drives the demand for video streaming software

Artificial intelligence (AI) plays an important role in the growth of the video streaming software market. Its AI-powered solutions can help video streaming software providers deliver more personalized content recommendations, improve video quality, optimize video delivery, and enhance the overall user experience. One of the main benefits of AI in video streaming software is the ability to analyze large amounts of data in real-time. This enables providers better to understand user behavior, preferences, and interests, and to offer more relevant and personalized content recommendations. AI algorithms can also analyze video content to optimize encoding and compression, improving video quality while reducing bandwidth usage. AI-powered solutions can also help video streaming software providers improve video content delivery such as, machine learning algorithms can analyze network performance and make real-time adjustments to video quality to ensure smooth and uninterrupted playback. In addition, AI can help video streaming software providers detect and prevent content piracy, a major concern for the industry. AI algorithms can analyze user behavior and identify suspicious patterns indicating piracy, allowing providers to act before the content is widely distributed. Overall, advancements in AI are expected to drive the growth of the video streaming software market by improving the user experience, reducing costs, and enabling new services and solutions.

Restraint: High content creation cost and threat of content piracy

The demand for unique content is continuously rising, but as the content production costs rise, streaming services are under pressure to show a profit. Thus, companies tend to invest more than required for video creation due to unawareness of the various phases of video content delivery. The problems such as duplication of video content for content creation across regions and verticals has become a common trend, which in turn increases the overall cost structure as well. Video content piracy is at an all-time high and the professional digital pirates pose a major risk to all media companies. They can hack into computer systems and post the content online for free before the set release date of the content. The internet structure further makes it difficult to track pirated content as the servers that leak the content are spread worldwide and can be hosted in several countries under different jurisdictions.

Opportunity: Optimization of network bandwidth

The videos are extensively used by large enterprises and educational institutions for tasks such as corporate training, executive communication, event streaming, and knowledge sharing. Video Content Management (VCM) solutions provide a cost-effective infrastructure to mitigate video-buffering problems. VCMs often deliver streamed videos in chunks which helps the video content to sync well with caching proxies deployed across the WANs. Thus, WAN caching framework enables minimizing the overall bandwidth consumption. VCM can also use adaptive bitrate streaming to deliver on-demand and live videos. The adaptive bitrate analyzes the viewers’ bandwidth in real-time and adjusts the video quality accordingly which thus, enables viewers to watch buffer-free videos.

Challenge:Poor internet speed reduces quality of service

The lack of an efficient communication tools limits employee productivity as the noise during video or low-quality video can create misunderstandings or consume their time more. Low-quality of video streaming and disturbances limits effective data transfer among workers, especially in the COVID-19 situation. According to a Cisco global survey focused on the future of work, 98% of workers stated that they experienced frustration from the inability to grasp information during live video streams, especially from broadcasters.

Based on Solution, video analytics segment is estimated to account for the highest CAGR during the forecast period

Based on the Solution, the video analytics segment is estimated to account for the highest CAGR during the forecast period. Video analytics refers to the use of algorithms and artificial intelligence (AI) technologies to analyze video content in real-time. Video analytics helps to monitor and analyze video streams, providing valuable insights into viewer behavior and engagement. Video analytics is even used to track various metrics such as the number of viewers, duration of views, geographic location of viewers, and even the emotions of viewers. This information can be used by content creators and marketers to optimize video content, improve engagement, and increase revenue.

Based on services, the managed services is projected to witness the highest CAGR during the forecast period.

Managing and maintaining video streaming software in-house can be expensive, particularly for businesses that lack the expertise and resources to do so effectively. Managed services providers can help businesses save money by offering scalable solutions that are tailored to their needs, allowing them to pay only for the services they need. These services are built on a global infrastructure with integrated security services, security patching, hardened Operating System (OS) build, data isolation, and incident response. Managed security services provide real-time monitoring, compliance auditing and reporting, and proactive mitigation of security threats.

Based on vertical, the Healthcare vertical is projected to witness the highest CAGR during the forecast period.

Video streaming in the healthcare sector has become a critical enabler for quick and efficient communication of frequent policy changes or compliance and regulatory mandates required for timely dissemination and enforcement in highly regulated healthcare services. Some surgeries are now required for live broadcasting to a wider staff and students as a means for highly engaged learning in real-time. Live streaming can deliver high-quality video streaming in healthcare to any number of users and devices. Video streaming in healthcare surgeries carries a great variety of benefits, both for doctors and patients. Not only do recorded procedures create an opportunity for training, learning, and self-improvement of surgical teams, but they also enhance the overall treatment quality through accountability deterring malpractice, unprofessional behavior, or mere carelessness.

The US market is projected to contribute the largest share for the video streaming software market in North America.

North America is expected to lead the video streaming software market in 2023. The US is estimated to account for the largest market share in North America in 2023 in the video streaming software market, and the trend is expected to continue until 2028. Due to a number of factors, including advanced IT infrastructure, the existence of numerous businesses, and the availability of technical skills, it is the most developed market in terms of the adoption of video streaming software. Legal requirements, such as FedRAMP, a standardized approach to security assessment, authorization, and continuous monitoring for cloud products and services, also influence the adoption of video streaming software. One of the main forces behind the expansion of the video streaming software industry in the US is the presence of a number of small and large video streaming software providers in the country, including IBM, Kaltura, Brightcove, Panopto, Haivision, Vimeo, VBrick, Qumu, Akamai, and more.

Video Streaming Software Market Size, and Share

Key Market Players

The video streaming software market is dominated by a few globally established players such as IBM (US), Kaltura (US), Brightcove (US), Agile Content (Spain), and  Haivision (US), among others, are the key vendors that secured video streaming software contracts in last few years. These vendors can bring global processes and execution expertise to the table, the local players only have local expertise. Driven by increased disposable incomes, easy access to knowledge, and fast adoption of technological products, buyers are more willing to experiment/test new things in the video streaming software market.

Get online access to the report on the World's First Market Intelligence Cloud

  • Easy to Download Historical Data & Forecast Numbers
  • Company Analysis Dashboard for high growth potential opportunities
  • Research Analyst Access for customization & queries
  • Competitor Analysis with Interactive dashboard
  • Latest News, Updates & Trend analysis
Request Sample

Scope of the Report

Report Metrics

Details

Market size available for years

2019–2028

Base year considered

2022

Forecast period

2023–2028

Forecast units

Million/Billion(USD)

Segments Covered

Component, Deployment Mode, Streaming Type, Monetization Model, Delivery Channel, and Vertical

Geographies Covered

North America, Europe, Asia Pacific, Middle East & Africa, and Latin America

Companies Covered

Some of the major vendors offering video streaming software across the globe include IBM (US), Kaltura (US), Brightcove, (US), Agile Content (Spain), Haivision (US), Vimeo (US), Panopto (US), VBrick (US), Edgio (US),  Akamai (US), Sonic Foundry (US),  Qumu(US) and more.

This research report categorizes the video streaming software market based on component, streaming type, deployment mode, monetization model, delivery channel, verticals, and regions.

Based on the Component:
  • Solutions
    • Transcoding & Processing
    • Video Management Software
    • Video Distribution
    • Video Analytics
    • Video Security
    • Other Solutions
  • Services
    • Managed Services
    • Professional Services
      • Consulting
      • Integration & Implementation
      • Support & Maintenance
Based on the Deployment Mode:
  • On-Premises
  • Cloud
Based on the Streaming Type:
  • Live Streaming
  • Video-on-Demand (VoD) Streaming
Based on the Delivery Channel:
  • Pay-Tv
  • Internet Protocol TV (IPTV)
  • Over-The-Top (OTT)
Based on the Monetization Model:
  • Subscription-Based
  • Advertising-Based
  • Transaction-Based
Based on the Vertical:
  • Media and Entertainment
  • BFSI
  • Academia and Education
  • Healthcare
  • Government
  • Other Verticals
Based on the Region:
  • North America
    • United States
    • Canada
  • Europe
    • Germany
    • UK
    • France
    • Italy
    • Spain
    • Rest of Europe
  • Asia Pacific
    • Japan
    • China
    • India
    • Rest of Asia Pacific
  • Middle East & Africa
    • UAE
    • KSA
    • South Africa
    • Rest of Middle East & Africa
  • Latin America
    • Brazil
    • Mexico
    • Argentina
    • Rest of Latin America

Recent Developments:

  • In April 2023, Akamai Technologies has announced new cloud computing capabilities for streaming video at the 2023 NAB Show. The capabilities are designed to help OTT operators deliver higher quality and more personalized video experiences to viewers. They can also help operators realize lower, more predictable operational costs and improve efforts to monetize content. Additionally, Akamai has also announced enhancements to its support of the Common Media Client Data (CMCD) specification and highlighted the latest members of its Qualified Computing Partner program.
  • In March 2023, Brightcove has expanded its E-Commerce capabilities with new platform integrations with Shopify, Instagram, and Salesforce Sales Cloud to its video cloud platform. The integrations are designed to enable companies to reach, engage and activate audiences with immersive, interactive, and live and on-demand video content.
  • In January 2023, IBM Watson Media has announced new event registration features added to IBM enterprise video streaming. These virtual event enhancements for registration form logic and improved editing make it easier and more efficient for users to manage their digital events. The enhancements include advanced form logic to control what fields are displayed for specific attendees as well as increased flexibility for editing a form once it’s been published and there are active registrations.
  • In December 2022, Vbrick has acquired Ramp Holdings, Inc., an enterprise content delivery network (eCDN) provider. Vbrick and Ramp are among the industry’s leading eCDN providers, each offering multiple video distribution modalities to support a variety of network configurations, giving customers flexible options to meet any enterprise use case. The acquisition creates an unparalleled solution for delivering flawless live and on-demand video.
  • In November 2022, Sonic Foundry has announced the launch of Video Solutions, a new business unit providing comprehensive video services to enterprise and events customers. Video Solutions incorporates many of the services previously offered under the umbrella of Sonic Foundry’s Mediasite Events brand with a variety of additional enterprise-facing services.
  • In June 2022, Haivision Systems Inc. and CarteNav have announced the implementation of Haivision video technology, including the Haivision Media Platform for live streaming over IP networks and the Kraken low latency transcoder, to power real-time full-motion video (FMV) within CarteNav’s AIMS-C4 Common Operating Picture (COP) solution.
  • In March 2022, K16 Solutions, an EdTech company for learning management system (LMS) course migration, student data archiving, and content replacement, has partnered with Panopto for higher education. This partnership will streamline the migration process for customers moving to Panopto’s video platform from their legacy provider.
  • In March 2022, Panopto has announced the integration with Microsoft Teams. Teams users can now use core Panopto functionality and workflows without ever leaving Teams. Panopto’s robust video search capabilities are also integrated with Microsoft 365 applications via Microsoft Graph. Teams users see federated search results for Panopto videos in Microsoft 365. Users can search every word spoken within every video, and their videos become discoverable alongside Word documents, Excel spreadsheets, and other important digital assets.
  • In November 2021, Agile Content has announced two innovations that are available for a virtual demonstration. The Agile Cloud Production and FAST & VoD2Livesolutions will enable broadcasters and TV providers to revolutionize how live content is produced and how linear channels can be created costefficiently and with a higher degree of personalization.
  •  In July 2021, Agile Content has announced the acquisition of WeTek, the Portuguese company dedicated to the R&D of the Android ecosystem. The addition of WeTek’s line of products to the Agile Content offering furthers its range of innovative end-to-end services, brings multiple benefits to new and existing customers and end users, and strengthens Agile’s market position in Portugal.

Frequently Asked Questions (FAQ):

To speak to our analyst for a discussion on the above findings, click Speak to Analyst

TABLE OF CONTENTS
 
1 INTRODUCTION (Page No. - 49)
    1.1 STUDY OBJECTIVES 
    1.2 MARKET DEFINITION 
           1.2.1 INCLUSIONS AND EXCLUSIONS
    1.3 MARKET SCOPE 
           1.3.1 MARKET SEGMENTATION
           1.3.2 REGIONS COVERED
           1.3.3 YEARS CONSIDERED
    1.4 CURRENCY 
           TABLE 1 USD EXCHANGE RATE, 2019–2022
    1.5 STAKEHOLDERS 
    1.6 SUMMARY OF CHANGES 
 
2 RESEARCH METHODOLOGY (Page No. - 55)
    2.1 RESEARCH DATA 
           FIGURE 1 VIDEO STREAMING SOFTWARE MARKET: RESEARCH DESIGN
           2.1.1 SECONDARY DATA
           2.1.2 PRIMARY DATA
                    2.1.2.1 Breakup of primary profiles
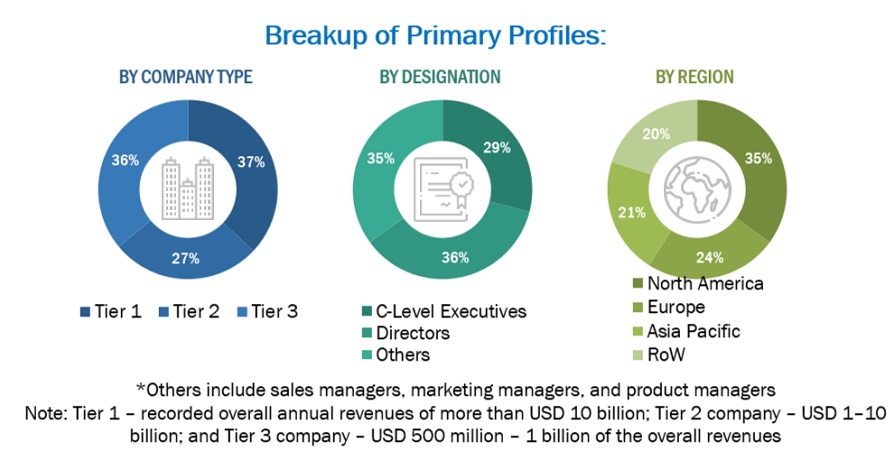
                               FIGURE 2 BREAKUP OF PRIMARY INTERVIEWS: BY COMPANY TYPE, DESIGNATION,  AND REGION
                               TABLE 2 PRIMARY RESPONDENTS
                    2.1.2.2 Key industry insights
    2.2 DATA TRIANGULATION 
    2.3 MARKET SIZE ESTIMATION 
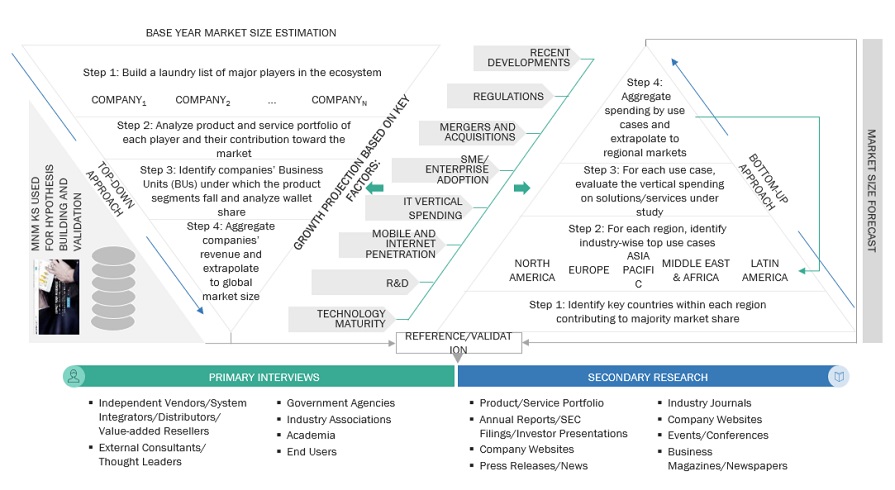
           FIGURE 3 VIDEO STREAMING SOFTWARE MARKET: TOP-DOWN AND  BOTTOM-UP APPROACHES
           FIGURE 4 MARKETT SIZE ESTIMATION METHODOLOGY – APPROACH 1 (SUPPLY SIDE): REVENUE OF SOLUTIONS AND SERVICES FROM VIDEO STREAMING SOFTWARE VENDORS
           FIGURE 5 MARKET SIZE ESTIMATION METHODOLOGY: BOTTOM-UP APPROACH (SUPPLY SIDE): COLLECTIVE REVENUE OF VIDEO STREAMING SOFTWARE VENDORS
           FIGURE 6 MARKET SIZE ESTIMATION METHODOLOGY – (SUPPLY SIDE):  CAGR PROJECTIONS FROM SUPPLY SIDE
           FIGURE 7 MARKET SIZE ESTIMATION METHODOLOGY ? BOTTOM-UP: REVENUE GENERATED BY VIDEO STREAMING SOFTWARE VENDORS FROM EACH COMPONENT
           FIGURE 8 MARKET SIZE ESTIMATION METHODOLOGY–APPROACH 2 (DEMAND SIDE): REVENUE GENERATED FROM DIFFERENT VIDEO STREAMING SOFTWARE SOLUTIONS
    2.4 MARKET FORECAST 
           TABLE 3 FACTOR ANALYSIS
    2.5 RESEARCH ASSUMPTIONS 
    2.6 LIMITATIONS 
 
3 EXECUTIVE SUMMARY (Page No. - 69)
    FIGURE 9 GLOBAL VIDEO STREAMING SOFTWARE MARKET, 2019–2028 (USD MILLION) 
    FIGURE 10 FASTEST-GROWING SEGMENTS IN MARKET, 2023–2028 
    FIGURE 11 SOLUTIONS SEGMENT TO HOLD LARGER MARKET SIZE DURING FORECAST PERIOD 
    FIGURE 12 TRANSCODING & PROCESSING SEGMENT TO HOLD LARGEST MARKET SIZE DURING FORECAST PERIOD 
    FIGURE 13 VIDEO-ON-DEMAND STREAMING SEGMENT TO HOLD LARGER MARKET SIZE DURING FORECAST PERIOD 
    FIGURE 14 CLOUD SEGMENT TO GROW AT HIGHER CAGR DURING FORECAST PERIOD 
    FIGURE 15 OVER-THE-TOP DELIVERY CHANNEL TO ACCOUNT FOR LARGEST MARKET SIZE DURING FORECAST PERIOD 
    FIGURE 16 SUBSCRIPTION-BASED MONETIZATION MODEL TO HOLD LARGEST MARKET SHARE DURING FORECAST PERIOD 
    FIGURE 17 TOP VERTICALS IN MARKET 
    FIGURE 18 MARKET: REGIONAL SNAPSHOT 
 
4 PREMIUM INSIGHTS (Page No. - 77)
    4.1 OVERVIEW OF VIDEO STREAMING SOFTWARE MARKET 
           FIGURE 19 INCREASING DEMAND FOR VIDEO STREAMING SERVICES  TO DRIVE MARKET GROWTH
    4.2 MARKET,  BY COMPONENT, 2023 VS. 2028 
           FIGURE 20 SOLUTIONS SEGMENT TO ACCOUNT FOR LARGER MARKET SHARE DURING FORECAST PERIOD
    4.3 MARKET, BY STREAMING TYPE, 2023 VS. 2028 
           FIGURE 21 VIDEO-ON-DEMAND STREAMING TYPE SEGMENT TO ACCOUNT FOR LARGER MARKET SHARE DURING FORECAST PERIOD
    4.4 MARKET, BY DEPLOYMENT MODE, 2023 VS. 2028 
           FIGURE 22 CLOUD SEGMENT TO ACCOUNT FOR LARGER MARKET SHARE DURING FORECAST PERIOD
    4.5 MARKET,  BY DELIVERY CHANNEL, 2023 VS. 2028 
           FIGURE 23 OTT SEGMENT TO ACCOUNT FOR LARGEST MARKET SHARE DURING FORECAST PERIOD
    4.6 MARKET, BY MONETIZATION MODEL, 2023 VS. 2028 
           FIGURE 24 SUBSCRIPTION-BASED SEGMENT TO ACCOUNT FOR LARGEST MARKET SHARE DURING FORECAST PERIOD
    4.7 MARKET,  BY VERTICAL, 2023–2028 
           FIGURE 25 MEDIA & ENTERTAINMENT SEGMENT TO ACCOUNT FOR LARGEST MARKET SHARE DURING FORECAST PERIOD
    4.8 MARKET:  REGIONAL SCENARIO, 2023–2028 
           FIGURE 26 ASIA PACIFIC TO EMERGE AS BEST MARKET FOR INVESTMENT IN NEXT FIVE YEARS
 
5 MARKET OVERVIEW AND INDUSTRY TRENDS (Page No. - 82)
    5.1 INTRODUCTION 
    5.2 MARKET DYNAMICS 
           FIGURE 27 MARKET DYNAMICS: VIDEO STREAMING SOFTWARE MARKET
           5.2.1 DRIVERS
                    5.2.1.1 Increasing penetration of mobile devices and internet users
                               FIGURE 28 NUMBER OF INTERNET USERS, 2018-2022 (MILLION)
                    5.2.1.2 Growing demand for VoD streaming
                               FIGURE 29 AVERAGE REVENUE PER USER, BY SEGMENT, 2018-2022
                    5.2.1.3 Technological advancements in digital media industry
                    5.2.1.4 Growing need for transcoding to deliver videos to maximum end users
                               FIGURE 30 CODECS USED BY DEVELOPERS
                    5.2.1.5 Increase in demand for high-quality videos
                    5.2.1.6 Advancement in AI to foster demand for video streaming software
           5.2.2 RESTRAINTS
                    5.2.2.1 High content creation cost and threat of content piracy
                               FIGURE 31 ESTIMATED REVENUE LOSS FOR US PAY-TV INDUSTRY FROM PIRACY AND ACCOUNT SHARING
                    5.2.2.2 Network connectivity and infrastructure issues
           5.2.3 OPPORTUNITIES
                    5.2.3.1 Growing preference for online streaming services over traditional TV
                               FIGURE 32 STREAMING VIEWERSHIP SURPASSES CABLE TV IN US
                    5.2.3.2 Optimization of network bandwidth
                    5.2.3.3 Growth in demand for real-time video services
                               FIGURE 33 GAMING DRIVES LIVE STREAMING
                    5.2.3.4 Emergence of 6G technology to boost video streaming software growth
           5.2.4 CHALLENGES
                    5.2.4.1 Growing threat of video content security and privacy
                    5.2.4.2 Poor internet speed to reduce quality of service
                               FIGURE 34 BUFFERING EVENT DECREASES HAPPINESS AND FOCUS
                    5.2.4.3 Concerns related to compatibility
    5.3 CASE STUDY ANALYSIS 
           5.3.1 CASE STUDY 1: APPLICATION WITH DIRECT ACCESS TO DIFFERENT WEB-BASED SERVICES
           5.3.2 CASE STUDY 2: UNITEN CHOSE PANOPTO’S VIDEO PLATFORM FOR ITS EASY RECORDING, STABLE LIVE STREAMING, AND ABILITY TO INTEGRATE WITH MOODLE
           5.3.3 CASE STUDY 3: CONVEYING UNIQUE TOPGOLF EXPERIENCE THROUGH VIDEO
           5.3.4 CASE STUDY 4: ENGAGING AUDIENCE WORLDWIDE
           5.3.5 CASE STUDY 5: HIGH-QUALITY VIEWING EXPERIENCE
    5.4 SUPPLY CHAIN ANALYSIS 
           FIGURE 35 VIDEO STREAMING SOFTWARE MARKET: SUPPLY CHAIN
    5.5 ECOSYSTEM ANALYSIS 
           FIGURE 36 MARKET: ECOSYSTEM ANALYSIS
    5.6 TECHNOLOGICAL ANALYSIS 
           5.6.1 MACHINE LEARNING
           5.6.2 ARTIFICIAL INTELLIGENCE
           5.6.3 VIDEO COMPRESSION
           5.6.4 ADAPTIVE BITRATE STREAMING
           5.6.5 CONTENT DELIVERY NETWORKS (CDNS)
           5.6.6 DIGITAL RIGHTS MANAGEMENT (DRM)
           5.6.7 STREAMING PROTOCOLS
    5.7 PRICING ANALYSIS 
           5.7.1 AVERAGE SELLING PRICE TRENDS OF KEY PLAYERS
                    TABLE 4 VIDEO STREAMING SOFTWARE MARKET: PRICING ANALYSIS, BY VENDOR
                    TABLE 5 MARKET: AVERAGE SELLING PRICING ANALYSIS, BY TYPE
    5.8 PATENT ANALYSIS 
           FIGURE 37 NUMBER OF PATENTS PUBLISHED, 2012–2022
           FIGURE 38 TOP FIVE PATENT OWNERS (GLOBAL)
           TABLE 6 TOP 10 PATENT APPLICANTS (US)
           TABLE 7 MARKET: PATENTS
    5.9 PORTER’S FIVE FORCES ANALYSIS 
           FIGURE 39 MARKET: PORTER’S FIVE FORCES ANALYSIS
           TABLE 8 VIDEO STREAMING SOFTWARE MARKET: PORTER’S FIVE FORCES ANALYSIS
           5.9.1 THREAT OF NEW ENTRANTS
           5.9.2 THREAT OF SUBSTITUTES
           5.9.3 BARGAINING POWER OF SUPPLIERS
           5.9.4 BARGAINING POWER OF BUYERS
           5.9.5 INTENSITY OF COMPETITIVE RIVALRY
    5.10 TARIFF AND REGULATORY LANDSCAPE 
           5.10.1 NORTH AMERICA
           5.10.2 EUROPE
           5.10.3 ASIA PACIFIC
           5.10.4 MIDDLE EAST AND SOUTH AFRICA
           5.10.5 LATIN AMERICA
    5.11 KEY CONFERENCES AND EVENTS IN 2023 & 2024 
                    TABLE 9 VIDEO STREAMING SOFTWARE MARKET: KEY CONFERENCES AND EVENTS IN  2023 & 2024
    5.12 TRENDS/DISRUPTIONS IMPACTING BUYERS 
                    FIGURE 40 MARKET: TRENDS/DISRUPTIONS IMPACTING BUYERS
    5.13 KEY STAKEHOLDERS & BUYING CRITERIA 
           5.13.1 KEY STAKEHOLDERS IN BUYING PROCESS
                    FIGURE 41 INFLUENCE OF STAKEHOLDERS ON BUYING PROCESS FOR END USERS
                    TABLE 10 INFLUENCE OF STAKEHOLDERS ON BUYING PROCESS FOR END USERS (%)
           5.13.2 BUYING CRITERIA
                    FIGURE 42 KEY BUYING CRITERIA FOR END USERS
                    TABLE 11 KEY BUYING CRITERIA FOR END USERS
 
6 VIDEO STREAMING SOFTWARE MARKET, BY COMPONENT (Page No. - 108)
    6.1 INTRODUCTION 
           FIGURE 43 SERVICES SEGMENT TO GROW AT HIGHER CAGR DURING FORECAST PERIOD
           6.1.1 COMPONENT: MARKET DRIVERS
                    TABLE 12 MARKET, BY COMPONENT, 2019–2022 (USD MILLION)
                    TABLE 13 MARKET, BY COMPONENT, 2023–2028 (USD MILLION)
                    TABLE 14 COMPONENT: MARKET, BY REGION,  2019–2022 (USD MILLION)
                    TABLE 15 COMPONENT: MARKET, BY REGION,  2023–2028 (USD MILLION)
    6.2 SOLUTIONS 
           6.2.1 VIDEO STREAMING SOLUTIONS TO MANAGE ALL ACTIVITIES, FROM CAPTURING TO INGESTION AND FINAL DELIVERY
                    FIGURE 44 VIDEO ANALYTICS SEGMENT TO RECORD HIGHEST CAGR DURING FORECAST PERIOD
                    TABLE 16 VIDEO STREAMING SOFTWARE MARKET, BY SOLUTION, 2019–2022 (USD MILLION)
                    TABLE 17 MARKET, BY SOLUTION, 2023–2028 (USD MILLION)
                    TABLE 18 SOLUTIONS: MARKET, BY REGION,  2019–2022 (USD MILLION)
                    TABLE 19 SOLUTIONS: MARKET, BY REGION,  2023–2028 (USD MILLION)
           6.2.2 TRANSCODING & PROCESSING
                    6.2.2.1 Transcoding & processing to enable delivery of high-quality video content to viewers
                               TABLE 20 TRANSCODING & PROCESSING: MARKET, BY REGION, 2019–2022 (USD MILLION)
                               TABLE 21 TRANSCODING & PROCESSING: MARKET, BY REGION, 2023–2028 (USD MILLION)
           6.2.3 VIDEO MANAGEMENT SOFTWARE
                    6.2.3.1 Video management software to enable users to manage video content
                               TABLE 22 VIDEO MANAGEMENT SOFTWARE: MARKET, BY REGION, 2019–2022 (USD MILLION)
                               TABLE 23 VIDEO MANAGEMENT SOFTWARE: MARKET, BY REGION, 2023–2028 (USD MILLION)
           6.2.4 VIDEO DISTRIBUTION
                    6.2.4.1 Organizations to deliver high-quality video content to large audience in real-time
                               TABLE 24 VIDEO DISTRIBUTION: MARKET, BY REGION,  2019–2022 (USD MILLION)
                               TABLE 25 VIDEO DISTRIBUTION: MARKET, BY REGION,  2023–2028 (USD MILLION)
           6.2.5 VIDEO ANALYTICS
                    6.2.5.1 Video analytics to optimize video content and delivery
                               TABLE 26 VIDEO ANALYTICS: VIDEO STREAMING SOFTWARE MARKET, BY REGION,  2019–2022 (USD MILLION)
                               TABLE 27 VIDEO ANALYTICS: MARKET, BY REGION,  2023–2028 (USD MILLION)
           6.2.6 VIDEO SECURITY
                    6.2.6.1 Video security measures to protect against theft, piracy, and unauthorized access
                               TABLE 28 VIDEO SECURITY: MARKET, BY REGION,  2019–2022 (USD MILLION)
                               TABLE 29 VIDEO SECURITY: MARKET, BY REGION,  2023–2028 (USD MILLION)
           6.2.7 OTHER SOLUTIONS
                    TABLE 30 OTHER SOLUTIONS: MARKET, BY REGION,  2019–2022 (USD MILLION)
                    TABLE 31 OTHER SOLUTIONS: MARKET, BY REGION,  2023–2028 (USD MILLION)
    6.3 SERVICES 
           6.3.1 VIDEO STREAMING SOFTWARE SERVICES TO PROVIDE USERS WITH TOOLS AND FEATURES TO DELIVER HIGH-QUALITY VIDEO CONTENT
                    FIGURE 45 MANAGED SERVICES SEGMENT TO GROW AT HIGHER CAGR DURING FORECAST PERIOD
                    TABLE 32 MARKET, BY SERVICE, 2019–2022 (USD MILLION)
                    TABLE 33 MARKET, BY SERVICE, 2023–2028 (USD MILLION)
                    TABLE 34 SERVICES: MARKET, BY REGION,  2019–2022 (USD MILLION)
                    TABLE 35 SERVICES: MARKET, BY REGION,  2023–2028 (USD MILLION)
           6.3.2 PROFESSIONAL SERVICES
                    6.3.2.1 Professional services to enable businesses to integrate their video streaming software with other systems
                               TABLE 36 PROFESSIONAL SERVICES MARKET, BY TYPE, 2019–2022 (USD MILLION)
                               TABLE 37 PROFESSIONAL SERVICES MARKET, BY TYPE, 2023–2028 (USD MILLION)
                               TABLE 38 PROFESSIONAL SERVICES: MARKET, BY REGION,  2019–2022 (USD MILLION)
                               TABLE 39 PROFESSIONAL SERVICES: MARKET, BY REGION,  2023–2028 (USD MILLION)
                    6.3.2.2 Integration & implementation
                               6.3.2.2.1 Integration & implementation services to help users maximize value of video streaming software investment
                               TABLE 40 INTEGRATION & IMPLEMENTATION: VIDEO STREAMING SOFTWARE MARKET,  BY REGION, 2019–2022 (USD MILLION)
                               TABLE 41 INTEGRATION & IMPLEMENTATION: MARKET,  BY REGION, 2023–2028 (USD MILLION)
                    6.3.2.3 Consulting
                               6.3.2.3.1 Consulting services to help businesses in video streaming software industry to stay competitive
                               TABLE 42 CONSULTING SERVICES: MARKET, BY REGION,  2019–2022 (USD MILLION
                               TABLE 43 CONSULTING SERVICES: MARKET, BY REGION,  2023–2028 (USD MILLION)
                    6.3.2.4 Support & maintenance
                               6.3.2.4.1 Support & maintenance services to ensure reliable and secure operation of video streaming software
                               TABLE 44 SUPPORT & MAINTENANCE: MARKET, BY REGION,  2019–2022 (USD MILLION)
                               TABLE 45 SUPPORT & MAINTENANCE: MARKET, BY REGION,  2023–2028 (USD MILLION)
           6.3.3 MANAGED SERVICES
                    6.3.3.1 Managed services providers to monitor and optimize system performance
                               TABLE 46 MANAGED SERVICES: MARKET, BY REGION,  2019–2022 (USD MILLION)
                               TABLE 47 MANAGED SERVICES: MARKET, BY REGION, 2023–2028 (USD MILLION)
 
7 VIDEO STREAMING SOFTWARE MARKET, BY STREAMING TYPE (Page No. - 128)
    7.1 INTRODUCTION 
           FIGURE 46 LIVE STREAMING SEGMENT TO GROW AT HIGHER RATE DURING FORECAST PERIOD
           7.1.1 STREAMING TYPE: MARKET DRIVERS
                    TABLE 48 STREAMING TYPE: MARKET, 2019–2022 (USD MILLION)
                    TABLE 49 STREAMING TYPE: MARKET, 2023–2028 (USD MILLION)
                    TABLE 50 STREAMING TYPE: MARKET, BY REGION, 2019–2022 (USD MILLION)
                    TABLE 51 STREAMING TYPE: MARKET, BY REGION,  2023–2028 (USD MILLION)
    7.2 LIVE STREAMING 
           7.2.1 LIVE STREAMING TO PROVIDE UNIQUE OPPORTUNITY FOR VIEWERS AND CONTENT CREATORS
                    TABLE 52 LIVE STREAMING: MARKET, BY REGION,  2019–2022 (USD MILLION)
                    TABLE 53 LIVE STREAMING: MARKET, BY REGION,  2023–2028 (USD MILLION)
    7.3 VIDEO-ON-DEMAND STREAMING 
           7.3.1 INCREASING NEED FOR VIDEO STREAMING TO BOOST GROWTH OF VIDEO-ON-DEMAND SOLUTION
                    TABLE 54 VIDEO-ON-DEMAND STREAMING: MARKET, BY REGION, 2019–2022 (USD MILLION)
                    TABLE 55 VIDEO-ON-DEMAND STREAMING: MARKET, BY REGION, 2023–2028 (USD MILLION)
 
8 VIDEO STREAMING SOFTWARE MARKET, BY DEPLOYMENT MODE (Page No. - 134)
    8.1 INTRODUCTION 
           FIGURE 47 CLOUD DEPLOYMENT MODE TO GROW AT HIGHER CAGR DURING FORECAST PERIOD
           8.1.1 DEPLOYMENT MODE: MARKET DRIVERS
                    TABLE 56 MARKET, BY DEPLOYMENT MODE,  2019–2022 (USD MILLION)
                    TABLE 57 MARKET, BY DEPLOYMENT MODE,  2023–2028 (USD MILLION)
                    TABLE 58 DEPLOYMENT MODE: MARKET, BY REGION,  2019–2022 (USD MILLION)
                    TABLE 59 DEPLOYMENT MODE: MARKET, BY REGION,  2023–2028 (USD MILLION)
    8.2 ON-PREMISES 
           8.2.1 ON-PREMISES DEPLOYMENT TO BE COST-EFFECTIVE THAN CLOUD-BASED SOLUTIONS
                    TABLE 60 ON-PREMISES: MARKET, BY REGION,  2019–2022 (USD MILLION)
                    TABLE 61 ON-PREMISES: MARKET, BY REGION,  2023–2028 (USD MILLION)
    8.3 CLOUD 
           8.3.1 CLOUD DEPLOYMENT MODE TO DELIVER HIGH-QUALITY VIDEO STREAMING SERVICES TO USERS
                    TABLE 62 CLOUD: MARKET, BY REGION, 2019–2022 (USD MILLION)
                    TABLE 63 CLOUD: MARKET, BY REGION, 2023–2028 (USD MILLION)
 
9 VIDEO STREAMING SOFTWARE MARKET, BY DELIVERY CHANNEL (Page No. - 140)
    9.1 INTRODUCTION 
           FIGURE 48 OVER-THE-TOP (OTT) SEGMENT TO GROW AT HIGHEST RATE DURING FORECAST PERIOD
           9.1.1 DELIVERY CHANNEL: MARKET DRIVERS
                    TABLE 64 MARKET, BY DELIVERY CHANNEL,  2019–2022 (USD MILLION)
                    TABLE 65 MARKET, BY DELIVERY CHANNEL,  2023–2028 (USD MILLION)
                    TABLE 66 DELIVERY CHANNEL: MARKET, BY REGION,  2019–2022 (USD MILLION)
                    TABLE 67 DELIVERY CHANNEL: MARKET, 2023–2028 (USD MILLION)
    9.2 PAY-TV 
           9.2.1 DELIVERY OF PAY-TV THROUGH VIDEO STREAMING TO ENABLE GREATER FLEXIBILITY AND CONVENIENCE FOR VIEWERS
                    TABLE 68 PAY-TV: MARKET, BY REGION, 2019–2022 (USD MILLION)
                    TABLE 69 PAY-TV: MARKET, 2023–2028 (USD MILLION)
    9.3 INTERNET PROTOCOL TV (IPTV) 
           9.3.1 COST-EFFECTIVENESS AND CUSTOMIZATION OPTIONS BY IPTV TO DRIVE DEMAND
                    TABLE 70 INTERNET PROTOCOL TV (IPTV): MARKET, BY REGION, 2019–2022 (USD MILLION)
                    TABLE 71 INTERNET PROTOCOL TV (IPTV): MARKET, BY REGION, 2023–2028 (USD MILLION)
    9.4 OVER-THE-TOP (OTT) 
           9.4.1 OTT ENSURES A HIGH-QUALITY VIEWING EXPERIENCE FOR USERS
                    TABLE 72 OVER-THE-TOP (OTT): MARKET, BY REGION,  2019–2022 (USD MILLION)
                    TABLE 73 OVER-THE-TOP (OTT): MARKET, BY REGION,  2023–2028 (USD MILLION)
 
10 VIDEO STREAMING SOFTWARE MARKET, BY MONETIZATION MODEL (Page No. - 147)
     10.1 INTRODUCTION 
               FIGURE 49 SUBSCRIPTION-BASED SEGMENT TO GROW AT HIGHEST RATE DURING FORECAST PERIOD
             10.1.1 MONETIZATION MODEL: MARKET DRIVERS
                       TABLE 74 MARKET, BY MONETIZATION MODEL,  2019–2022 (USD MILLION)
                       TABLE 75 MARKET, BY MONETIZATION MODEL,  2023–2028 (USD MILLION)
                       TABLE 76 MONETIZATION MODEL: MARKET, BY REGION,  2019–2022 (USD MILLION)
                       TABLE 77 MONETIZATION MODEL: MARKET,  2023–2028 (USD MILLION)
     10.2 SUBSCRIPTION-BASED 
             10.2.1 DELIVERENCE OF ENHANCED CUSTOMER EXPERIENCE TO FUEL DEMAND FOR SUBSCRIPTION-BASED MONETIZATION MODEL
                       TABLE 78 SUBSCRIPTION-BASED: MARKET, BY REGION,  2019–2022 (USD MILLION)
                       TABLE 79 SUBSCRIPTION-BASED: MARKET,  2023–2028 (USD MILLION)
     10.3 ADVERTISING-BASED 
             10.3.1 HIGHER PENETRATION OF INTERNET AND USE OF MOBILE DEVICES TO DRIVE DEMAND FOR ADVERTISING-BASED MONETIZATION MODEL
                       TABLE 80 ADVERTISING-BASED: MARKET, BY REGION,  2019–2022 (USD MILLION)
                       TABLE 81 ADVERTISING-BASED: MARKET, BY REGION,  2023–2028 (USD MILLION)
     10.4 TRANSACTION-BASED 
             10.4.1 ATTRACTIVE VIDEO PACKAGES TO BOOST DEMAND FOR TRANSACTION-BASED MONETIZATION MODEL
                       TABLE 82 TRANSACTION-BASED: MARKET, BY REGION,  2019–2022 (USD MILLION)
                       TABLE 83 TRANSACTION-BASED: MARKET, BY REGION,  2023–2028 (USD MILLION)
 
11 VIDEO STREAMING SOFTWARE MARKET, BY VERTICAL (Page No. - 155)
     11.1 INTRODUCTION 
               FIGURE 50 MEDIA & ENTERTAINMENT VERTICAL TO DOMINATE MARKET DURING FORECAST PERIOD
             11.1.1 VERTICALS: MARKET DRIVERS
                       TABLE 84 MARKET, BY VERTICAL, 2019–2022 (USD MILLION)
                       TABLE 85 MARKET, BY VERTICAL, 2023–2028 (USD MILLION)
                       TABLE 86 VERTICAL: MARKET, BY REGION,  2019–2022 (USD MILLION)
                       TABLE 87 VERTICAL: MARKET, BY REGION, 2023–2028 (USD MILLION)
     11.2 MEDIA & ENTERTAINMENT 
             11.2.1 ABILITY TO SELECT CONTENT AS PER ONE’S INTEREST TO DRIVE GROWTH
                       TABLE 88 MEDIA & ENTERTAINMENT: MARKET, BY REGION,  2019–2022 (USD MILLION)
                       TABLE 89 MEDIA & ENTERTAINMENT: MARKET, BY REGION,  2023–2028 (USD MILLION)
     11.3 BFSI 
             11.3.1 VIDEO STREAMING SOFTWARE TO ENABLE BETTER CUSTOMER SERVICE, AND REACH WIDER AUDIENCE THROUGH MARKETING EFFORTS
                       TABLE 90 BFSI: VIDEO STREAMING SOFTWARE MARKET, BY REGION, 2019–2022 (USD MILLION)
                       TABLE 91 BFSI: MARKET, BY REGION, 2023–2028 (USD MILLION)
     11.4 ACADEMIA & EDUCATION 
             11.4.1 PROLIFERATION OF ELEARNING AND SMART EDUCATION SYSTEM TO DRIVE GROWTH
                       TABLE 92 ACADEMIA & EDUCATION: MARKET, BY REGION,  2019–2022 (USD MILLION)
                       TABLE 93 ACADEMIA & EDUCATION: MARKET, BY REGION,  2023–2028 (USD MILLION)
     11.5 HEALTHCARE 
             11.5.1 HEALTHCARE INDUSTRY TO ADOPT VIDEO STREAMING SERVICES TO IMPROVE PATIENT CARE, INCREASE EFFICIENCY, AND REDUCE COSTS
                       TABLE 94 HEALTHCARE: MARKET, BY REGION,  2019–2022 (USD MILLION)
                       TABLE 95 HEALTHCARE: MARKET, BY REGION,  2023–2028 (USD MILLION)
     11.6 GOVERNMENT 
             11.6.1 USE OF VIDEO STREAMING SERVICES IN LIVE EVENTS, CONFERENCES, AND PUBLIC EDUCATION
                       TABLE 96 GOVERNMENT: MARKET, BY REGION,  2019–2022 (USD MILLION)
                       TABLE 97 GOVERNMENT: MARKET, BY REGION, 2023–2028 (USD MILLION)
     11.7 OTHER VERTICALS 
               TABLE 98 OTHER VERTICALS: MARKET, BY REGION,  2019–2022 (USD MILLION)
               TABLE 99 OTHER VERTICALS: MARKET, BY REGION,  2023–2028 (USD MILLION)
 
12 VIDEO STREAMING SOFTWARE MARKET, BY REGION (Page No. - 168)
     12.1 INTRODUCTION 
               FIGURE 51 NORTH AMERICA TO ACCOUNT FOR LARGEST MARKET SHARE DURING FORECAST PERIOD
               TABLE 100 MARKET, BY REGION, 2019–2022 (USD MILLION)
               TABLE 101 MARKET, BY REGION, 2023–2028 (USD MILLION)
     12.2 NORTH AMERICA 
             12.2.1 NORTH AMERICA: MARKET DRIVERS
             12.2.2 NORTH AMERICA: RECESSION IMPACT
                       FIGURE 52 NORTH AMERICA: MARKET SNAPSHOT
                       TABLE 102 NORTH AMERICA: VIDEO STREAMING SOFTWARE MARKET, BY COMPONENT,  2019–2022 (USD MILLION)
                       TABLE 103 NORTH AMERICA: MARKET, BY COMPONENT,  2023–2028 (USD MILLION)
                       TABLE 104 NORTH AMERICA: MARKET, BY SOLUTION,  2019–2022 (USD MILLION)
                       TABLE 105 NORTH AMERICA: MARKET, BY SOLUTION,  2023–2028 (USD MILLION)
                       TABLE 106 NORTH AMERICA: MARKET, BY SERVICE,  2019–2022 (USD MILLION)
                       TABLE 107 NORTH AMERICA: MARKET, BY SERVICE,  2023–2028 (USD MILLION)
                       TABLE 108 NORTH AMERICA: MARKET, BY PROFESSIONAL SERVICE, 2019–2022 (USD MILLION)
                       TABLE 109 NORTH AMERICA: MARKET, BY PROFESSIONAL SERVICE, 2023–2028 (USD MILLION)
                       TABLE 110 NORTH AMERICA: MARKET, BY STREAMING TYPE,  2019–2022 (USD MILLION)
                       TABLE 111 NORTH AMERICA: MARKET, BY STREAMING TYPE,  2023–2028 (USD MILLION)
                       TABLE 112 NORTH AMERICA: MARKET, BY DEPLOYMENT MODE, 2019–2022 (USD MILLION)
                       TABLE 113 NORTH AMERICA: MARKET, BY DEPLOYMENT MODE, 2023–2028 (USD MILLION)
                       TABLE 114 NORTH AMERICA: MARKET, BY DELIVERY CHANNEL, 2019–2022 (USD MILLION)
                       TABLE 115 NORTH AMERICA: MARKET, BY DELIVERY CHANNEL, 2023–2028 (USD MILLION)
                       TABLE 116 NORTH AMERICA: MARKET, BY MONETIZATION MODEL, 2019–2022 (USD MILLION)
                       TABLE 117 NORTH AMERICA: MARKET, BY MONETIZATION MODEL, 2023–2028 (USD MILLION)
                       TABLE 118 NORTH AMERICA: MARKET, BY VERTICAL,  2019–2022 (USD MILLION)
                       TABLE 119 NORTH AMERICA: MARKET, BY VERTICAL,  2023–2028 (USD MILLION)
                       TABLE 120 NORTH AMERICA: MARKET, BY COUNTRY,  2019–2022 (USD MILLION)
                       TABLE 121 NORTH AMERICA: MARKET, BY COUNTRY,  2023–2028 (USD MILLION)
             12.2.3 US
                       12.2.3.1 Presence of several video streaming software providers to drive market
                                   TABLE 122 US: VIDEO STREAMING SOFTWARE MARKET, BY COMPONENT,  2019–2022 (USD MILLION)
                                   TABLE 123 US: MARKET, BY COMPONENT,  2023–2028 (USD MILLION)
                                   TABLE 124 US: MARKET, BY DEPLOYMENT MODE, 2019–2022 (USD MILLION)
                                   TABLE 125 US: MARKET, BY DEPLOYMENT MODE,  2023–2028 (USD MILLION)
             12.2.4 CANADA
                       12.2.4.1 Government initiatives and security advancements to fuel adoption of video streaming software services
                                   TABLE 126 CANADA: MARKET, BY COMPONENT,  2019–2022 (USD MILLION)
                                   TABLE 127 CANADA: MARKET, BY COMPONENT,  2023–2028 (USD MILLION)
                                   TABLE 128 CANADA: MARKET, BY DEPLOYMENT MODE,  2019–2022 (USD MILLION)
                                   TABLE 129 CANADA: MARKET, BY DEPLOYMENT MODE,  2023–2028 (USD MILLION)
     12.3 EUROPE 
             12.3.1 EUROPE: MARKET DRIVERS
             12.3.2 EUROPE: RECESSION IMPACT
                       TABLE 130 EUROPE: VIDEO STREAMING SOFTWARE MARKET, BY COMPONENT,  2019–2022 (USD MILLION)
                       TABLE 131 EUROPE: MARKET, BY COMPONENT,  2023–2028 (USD MILLION)
                       TABLE 132 EUROPE: MARKET, BY SOLUTION,  2019–2022 (USD MILLION)
                       TABLE 133 EUROPE: MARKET, BY SOLUTION,  2023–2028 (USD MILLION)
                       TABLE 134 EUROPE: MARKET, BY SERVICE,  2019–2022 (USD MILLION)
                       TABLE 135 EUROPE: MARKET, BY SERVICE,  2023–2028 (USD MILLION)
                       TABLE 136 EUROPE: MARKET, BY PROFESSIONAL SERVICE,  2019–2022 (USD MILLION)
                       TABLE 137 EUROPE: MARKET, BY PROFESSIONAL SERVICE,  2023–2028 (USD MILLION)
                       TABLE 138 EUROPE: MARKET, BY STREAMING TYPE,  2019–2022 (USD MILLION)
                       TABLE 139 EUROPE: MARKET, BY STREAMING TYPE, 2023–2028 (USD MILLION)
                       TABLE 140 EUROPE: MARKET, BY DEPLOYMENT MODE,  2019–2022 (USD MILLION)
                       TABLE 141 EUROPE: MARKET, BY DEPLOYMENT MODE,  2023–2028 (USD MILLION)
                       TABLE 142 EUROPE: MARKET, BY DELIVERY CHANNEL,  2019–2022 (USD MILLION)
                       TABLE 143 EUROPE: MARKET, BY DELIVERY CHANNEL,  2023–2028 (USD MILLION)
                       TABLE 144 EUROPE: MARKET, BY MONETIZATION MODEL,  2019–2022 (USD MILLION)
                       TABLE 145 EUROPE: MARKET, BY MONETIZATION MODEL,  2023–2028 (USD MILLION)
                       TABLE 146 EUROPE: MARKET, BY VERTICAL,  2019–2022 (USD MILLION)
                       TABLE 147 EUROPE: MARKET, BY VERTICAL,  2023–2028 (USD MILLION)
                       TABLE 148 EUROPE: MARKET, BY COUNTRY,  2019–2022 (USD MILLION)
                       TABLE 149 EUROPE: MARKET, BY COUNTRY,  2023–2028 (USD MILLION)
             12.3.3 UK
                       12.3.3.1 Changing content consumption behavior to drive demand for OTT services segment
                                   TABLE 150 UK: VIDEO STREAMING SOFTWARE MARKET, BY COMPONENT, 2019–2022 (USD MILLION)
                                   TABLE 151 UK: MARKET, BY COMPONENT, 2023–2028 (USD MILLION)
                                   TABLE 152 UK: MARKET, BY DEPLOYMENT MODE,  2019–2022 (USD MILLION)
                                   TABLE 153 UK: MARKET, BY DEPLOYMENT MODE,  2023–2028 (USD MILLION)
             12.3.4 GERMANY
                       12.3.4.1 Increasing digitalization to fuel growth of video streaming software services
                                   TABLE 154 GERMANY: MARKET, BY COMPONENT,  2019–2022 (USD MILLION)
                                   TABLE 155 GERMANY: MARKET, BY COMPONENT,  2023–2028 (USD MILLION)
                                   TABLE 156 GERMANY: MARKET, BY DEPLOYMENT MODE,  2019–2022 (USD MILLION)
                                   TABLE 157 GERMANY: MARKET, BY DEPLOYMENT MODE,  2023–2028 (USD MILLION)
             12.3.5 FRANCE
                       12.3.5.1 Government initiatives to support adoption of cloud technologies
                                   TABLE 158 FRANCE: VIDEO STREAMING SOFTWARE MARKET, BY COMPONENT,  2019–2022 (USD MILLION)
                                   TABLE 159 FRANCE: MARKET, BY COMPONENT, 2023–2028 (USD MILLION)
                                   TABLE 160 FRANCE: MARKET, BY DEPLOYMENT MODE,  2019–2022 (USD MILLION)
                                   TABLE 161 FRANCE: MARKET, BY DEPLOYMENT MODE, 2023–2028 (USD MILLION)
             12.3.6 ITALY
                       12.3.6.1 Companies to provide variety of services to attract and retain subscribers
                                   TABLE 162 ITALY: MARKET, BY COMPONENT,  2019–2022 (USD MILLION)
                                   TABLE 163 ITALY: MARKET, BY COMPONENT,  2023–2028 (USD MILLION)
                                   TABLE 164 ITALY: MARKET, BY DEPLOYMENT MODE,  2019–2022 (USD MILLION)
                                   TABLE 165 ITALY: MARKET, BY DEPLOYMENT MODE,  2023–2028 (USD MILLION)
             12.3.7 SPAIN
                       12.3.7.1 Increasing technological advancements and digitalization to drive market growth
                                   TABLE 166 SPAIN: MARKET, BY COMPONENT,  2019–2022 (USD MILLION)
                                   TABLE 167 SPAIN: MARKET, BY COMPONENT,  2023–2028 (USD MILLION)
                                   TABLE 168 SPAIN: MARKET, BY DEPLOYMENT MODE,  2019–2022 (USD MILLION)
                                   TABLE 169 SPAIN: MARKET, BY DEPLOYMENT MODE,  2023–2028 (USD MILLION)
             12.3.8 REST OF EUROPE
                       TABLE 170 REST OF EUROPE: MARKET, BY COMPONENT,  2019–2022 (USD MILLION)
                       TABLE 171 REST OF EUROPE: MARKET, BY COMPONENT,  2023–2028 (USD MILLION)
                       TABLE 172 REST OF EUROPE: MARKET, BY DEPLOYMENT MODE, 2019–2022 (USD MILLION)
                       TABLE 173 REST OF EUROPE: MARKET, BY DEPLOYMENT MODE, 2023–2028 (USD MILLION)
     12.4 ASIA PACIFIC 
             12.4.1 ASIA PACIFIC: MARKET DRIVERS
             12.4.2 ASIA PACIFIC: RECESSION IMPACT
                       FIGURE 53 ASIA PACIFIC: REGIONAL SNAPSHOT
                       TABLE 174 ASIA PACIFIC: VIDEO STREAMING SOFTWARE MARKET, BY COMPONENT,  2019–2022 (USD MILLION)
                       TABLE 175 ASIA PACIFIC: MARKET, BY COMPONENT,  2023–2028 (USD MILLION)
                       TABLE 176 ASIA PACIFIC: MARKET, BY SOLUTION,  2019–2022 (USD MILLION)
                       TABLE 177 ASIA PACIFIC: MARKET, BY SOLUTION, 2023–2028 (USD MILLION)
                       TABLE 178 ASIA PACIFIC: MARKET, BY SERVICE, 2019–2022 (USD MILLION)
                       TABLE 179 ASIA PACIFIC: MARKET, BY SERVICE,  2023–2028 (USD MILLION)
                       TABLE 180 ASIA PACIFIC: MARKET, BY PROFESSIONAL SERVICE, 2019–2022 (USD MILLION)
                       TABLE 181 ASIA PACIFIC: MARKET, BY PROFESSIONAL SERVICE, 2023–2028 (USD MILLION)
                       TABLE 182 ASIA PACIFIC: MARKET, BY STREAMING TYPE,  2019–2022 (USD MILLION)
                       TABLE 183 ASIA PACIFIC: MARKET, BY STREAMING TYPE,  2023–2028 (USD MILLION)
                       TABLE 184 ASIA PACIFIC: MARKET, BY DEPLOYMENT MODE, 2019–2022 (USD MILLION)
                       TABLE 185 ASIA PACIFIC: MARKET, BY DEPLOYMENT MODE,  2023–2028 (USD MILLION)
                       TABLE 186 ASIA PACIFIC: MARKET, BY DELIVERY CHANNEL,  2019–2022 (USD MILLION)
                       TABLE 187 ASIA PACIFIC: MARKET, BY DELIVERY CHANNEL, 2023–2028 (USD MILLION)
                       TABLE 188 ASIA PACIFIC: MARKET, BY MONETIZATION MODEL,  2019–2022 (USD MILLION)
                       TABLE 189 ASIA PACIFIC: MARKET, BY MONETIZATION MODEL,  2023–2028 (USD MILLION)
                       TABLE 190 ASIA PACIFIC: MARKET, BY VERTICAL,  2019–2022 (USD MILLION)
                       TABLE 191 ASIA PACIFIC: MARKET, BY VERTICAL,  2023–2028 (USD MILLION)
                       TABLE 192 ASIA PACIFIC: MARKET, BY COUNTRY,  2019–2022 (USD MILLION)
                       TABLE 193 ASIA PACIFIC: MARKET, BY COUNTRY,  2023–2028 (USD MILLION)
             12.4.3 CHINA
                       12.4.3.1 Increasing digital transformation to fuel market growth
                                   TABLE 194 CHINA: VIDEO STREAMING SOFTWARE MARKET, BY COMPONENT,  2019–2022 (USD MILLION)
                                   TABLE 195 CHINA: MARKET, BY COMPONENT,  2023–2028 (USD MILLION)
                                   TABLE 196 CHINA: MARKET, BY DEPLOYMENT MODE,  2019–2022 (USD MILLION)
                                   TABLE 197 CHINA: MARKET, BY DEPLOYMENT MODE,  2023–2028 (USD MILLION)
             12.4.4 JAPAN
                       12.4.4.1 Rising demand for video streaming services to drive market
                                   TABLE 198 JAPAN: MARKET, BY COMPONENT,  2019–2022 (USD MILLION)
                                   TABLE 199 JAPAN: MARKET, BY COMPONENT,  2023–2028 (USD MILLION)
                                   TABLE 200 JAPAN: MARKET, BY DEPLOYMENT MODE,  2019–2022 (USD MILLION)
                                   TABLE 201 JAPAN: MARKET, BY DEPLOYMENT MODE,  2023–2028 (USD MILLION)
             12.4.5 INDIA
                       12.4.5.1 Growing usage of OTT to drive demand for video streaming software
                                   TABLE 202 INDIA: MARKET, BY COMPONENT,  2019–2022 (USD MILLION)
                                   TABLE 203 INDIA: MARKET, BY COMPONENT,  2023–2028 (USD MILLION)
                                   TABLE 204 INDIA: MARKET, BY DEPLOYMENT MODE,  2019–2022 (USD MILLION)
                                   TABLE 205 INDIA: MARKET, BY DEPLOYMENT MODE,  2023–2028 (USD MILLION)
             12.4.6 REST OF ASIA PACIFIC
                       TABLE 206 REST OF ASIA PACIFIC: MARKET, BY COMPONENT,  2019–2022 (USD MILLION)
                       TABLE 207 REST OF ASIA PACIFIC: MARKET, BY COMPONENT,  2023–2028 (USD MILLION)
                       TABLE 208 REST OF ASIA PACIFIC: MARKET, BY DEPLOYMENT MODE, 2019–2022 (USD MILLION)
                       TABLE 209 REST OF ASIA PACIFIC: MARKET, BY DEPLOYMENT MODE, 2023–2028 (USD MILLION)
     12.5 MIDDLE EAST & AFRICA 
             12.5.1 MIDDLE EAST & AFRICA: MARKET DRIVERS
             12.5.2 MIDDLE EAST & AFRICA: RECESSION IMPACT
                       TABLE 210 MIDDLE EAST & AFRICA: VIDEO STREAMING SOFTWARE MARKET, BY COMPONENT, 2019–2022 (USD MILLION)
                       TABLE 211 MIDDLE EAST & AFRICA: MARKET, BY COMPONENT, 2023–2028 (USD MILLION)
                       TABLE 212 MIDDLE EAST & AFRICA: MARKET, BY SOLUTION,  2019–2022 (USD MILLION)
                       TABLE 213 MIDDLE EAST & AFRICA: MARKET, BY SOLUTION,  2023–2028 (USD MILLION)
                       TABLE 214 MIDDLE EAST & AFRICA: MARKET, BY SERVICE,  2019–2022 (USD MILLION)
                       TABLE 215 MIDDLE EAST & AFRICA: MARKET, BY SERVICE,  2023–2028 (USD MILLION)
                       TABLE 216 MIDDLE EAST & AFRICA: MARKET, BY PROFESSIONAL SERVICE, 2019–2022 (USD MILLION)
                       TABLE 217 MIDDLE EAST & AFRICA: MARKET, BY PROFESSIONAL SERVICE, 2023–2028 (USD MILLION)
                       TABLE 218 MIDDLE EAST & AFRICA: MARKET, BY STREAMING TYPE, 2019–2022 (USD MILLION)
                       TABLE 219 MIDDLE EAST & AFRICA: MARKET, BY STREAMING TYPE, 2023–2028 (USD MILLION)
                       TABLE 220 MIDDLE EAST & AFRICA: MARKET, BY DEPLOYMENT MODE, 2019–2022 (USD MILLION)
                       TABLE 221 MIDDLE EAST & AFRICA: MARKET, BY DEPLOYMENT MODE, 2023–2028 (USD MILLION)
                       TABLE 222 MIDDLE EAST & AFRICA: MARKET, BY DELIVERY CHANNEL, 2019–2022 (USD MILLION)
                       TABLE 223 MIDDLE EAST & AFRICA: MARKET, BY DELIVERY CHANNEL, 2023–2028 (USD MILLION)
                       TABLE 224 MIDDLE EAST & AFRICA: MARKET, BY MONETIZATION MODEL, 2019–2022 (USD MILLION)
                       TABLE 225 MIDDLE EAST & AFRICA: MARKET, BY MONETIZATION MODEL, 2023–2028 (USD MILLION)
                       TABLE 226 MIDDLE EAST & AFRICA: MARKET, BY VERTICAL, 2019–2022 (USD MILLION)
                       TABLE 227 MIDDLE EAST & AFRICA: MARKET, BY VERTICAL,  2023–2028 (USD MILLION)
                       TABLE 228 MIDDLE EAST & AFRICA: MARKET, BY COUNTRY,  2019–2022 (USD MILLION)
                       TABLE 229 MIDDLE EAST & AFRICA: MARKET, BY COUNTRY,  2023–2028 (USD MILLION)
             12.5.3 KSA
                       12.5.3.1 Use of internet to watch TV and video content to propel growth of video streaming solutions and services
                                   TABLE 230 KSA: VIDEO STREAMING SOFTWARE MARKET, BY COMPONENT,  2019–2022 (USD MILLION)
                                   TABLE 231 KSA: MARKET, BY COMPONENT,  2023–2028 (USD MILLION)
                                   TABLE 232 KSA: MARKET, BY DEPLOYMENT MODE,  2019–2022 (USD MILLION)
                                   TABLE 233 KSA: MARKET, BY DEPLOYMENT MODE,  2023–2028 (USD MILLION)
             12.5.4 UAE
                       12.5.4.1 Government initiatives to offer opportunities for adoption of video streaming software solutions
                                   TABLE 234 UAE: MARKET, BY COMPONENT, 2019–2022 (USD MILLION)
                                   TABLE 235 UAE: MARKET, BY COMPONENT,  2023–2028 (USD MILLION)
                                   TABLE 236 UAE: MARKET, BY DEPLOYMENT MODE, 2019–2022 (USD MILLION)
                                   TABLE 237 UAE: MARKET, BY DEPLOYMENT MODE,  2023–2028 (USD MILLION)
             12.5.5 SOUTH AFRICA
                       12.5.5.1 High adoption of cloud services by startups to boost market
                                   TABLE 238 SOUTH AFRICA: MARKET, BY COMPONENT, 2019–2022 (USD MILLION)
                                   TABLE 239 SOUTH AFRICA: MARKET, BY COMPONENT, 2023–2028 (USD MILLION)
                                   TABLE 240 SOUTH AFRICA: MARKET, BY DEPLOYMENT MODE,  2019–2022 (USD MILLION)
                                   TABLE 241 SOUTH AFRICA: MARKET, BY DEPLOYMENT MODE, 2023–2028 (USD MILLION)
             12.5.6 REST OF MIDDLE EAST & AFRICA
                       TABLE 242 REST OF MIDDLE EAST & AFRICA: MARKET,  BY COMPONENT, 2019–2022 (USD MILLION)
                       TABLE 243 REST OF MIDDLE EAST & AFRICA: MARKET,  BY COMPONENT, 2023–2028 (USD MILLION)
                       TABLE 244 REST OF MIDDLE EAST & AFRICA: MARKET,  BY DEPLOYMENT MODE, 2019–2022 (USD MILLION)
                       TABLE 245 REST OF MIDDLE EAST & AFRICA: MARKET,  BY DEPLOYMENT MODE, 2023–2028 (USD MILLION)
     12.6 LATIN AMERICA 
             12.6.1 LATIN AMERICA: MARKET DRIVERS
             12.6.2 LATIN AMERICA: RECESSION IMPACT
                       TABLE 246 LATIN AMERICA: VIDEO STREAMING SOFTWARE MARKET, BY COMPONENT,  2019–2022 (USD MILLION)
                       TABLE 247 LATIN AMERICA: MARKET, BY COMPONENT,  2023–2028 (USD MILLION)
                       TABLE 248 LATIN AMERICA: MARKET, BY SOLUTION,  2019–2022 (USD MILLION)
                       TABLE 249 LATIN AMERICA: MARKET, BY SOLUTION,  2023–2028 (USD MILLION)
                       TABLE 250 LATIN AMERICA: MARKET, BY SERVICE,  2019–2022 (USD MILLION)
                       TABLE 251 LATIN AMERICA: MARKET, BY SERVICE,  2023–2028 (USD MILLION)
                       TABLE 252 LATIN AMERICA: MARKET, BY PROFESSIONAL SERVICE, 2019–2022 (USD MILLION)
                       TABLE 253 LATIN AMERICA: MARKET, BY PROFESSIONAL SERVICE, 2023–2028 (USD MILLION)
                       TABLE 254 LATIN AMERICA: MARKET, BY STREAMING TYPE,  2019–2022 (USD MILLION)
                       TABLE 255 LATIN AMERICA: MARKET, BY STREAMING TYPE,  2023–2028 (USD MILLION)
                       TABLE 256 LATIN AMERICA: MARKET, BY DEPLOYMENT MODE,  2019–2022 (USD MILLION)
                       TABLE 257 LATIN AMERICA: MARKET, BY DEPLOYMENT MODE,  2023–2028 (USD MILLION)
                       TABLE 258 LATIN AMERICA: MARKET, BY DELIVERY CHANNEL,  2019–2022 (USD MILLION)
                       TABLE 259 LATIN AMERICA: MARKET, BY DELIVERY CHANNEL,  2023–2028 (USD MILLION)
                       TABLE 260 LATIN AMERICA: MARKET, BY MONETIZATION MODEL, 2019–2022 (USD MILLION)
                       TABLE 261 LATIN AMERICA: MARKET, BY MONETIZATION MODEL, 2023–2028 (USD MILLION)
                       TABLE 262 LATIN AMERICA: MARKET, BY VERTICAL,  2019–2022 (USD MILLION)
                       TABLE 263 LATIN AMERICA: MARKET, BY VERTICAL,  2023–2028 (USD MILLION)
                       TABLE 264 LATIN AMERICA: MARKET, BY COUNTRY,  2019–2022 (USD MILLION)
                       TABLE 265 LATIN AMERICA: MARKET, BY COUNTRY,  2023–2028 (USD MILLION)
             12.6.3 BRAZIL
                       12.6.3.1 Presence of major video streaming players to accelerate market
                                   TABLE 266 BRAZIL: VIDEO STREAMING SOFTWARE MARKET, BY COMPONENT,  2019–2022 (USD MILLION)
                                   TABLE 267 BRAZIL: MARKET, BY COMPONENT,  2023–2028 (USD MILLION)
                                   TABLE 268 BRAZIL: MARKET, BY DEPLOYMENT MODE,  2019–2022 (USD MILLION)
                                   TABLE 269 BRAZIL: MARKET, BY DEPLOYMENT MODE,  2023–2028 (USD MILLION)
             12.6.4 MEXICO
                       12.6.4.1 Major digital transformation in mobile industry to drive market
                                   TABLE 270 MEXICO: MARKET, BY COMPONENT,  2019–2022 (USD MILLION)
                                   TABLE 271 MEXICO: MARKET, BY COMPONENT,  2023–2028 (USD MILLION)
                                   TABLE 272 MEXICO: MARKET, BY DEPLOYMENT MODE,  2019–2022 (USD MILLION)
                                   TABLE 273 MEXICO: MARKET, BY DEPLOYMENT MODE, 2023–2028 (USD MILLION)
             12.6.5 ARGENTINA
                       12.6.5.1 Rapid transformation from offline to online video content for entertainment and information to drive growth
                                   TABLE 274 ARGENTINA: MARKET, BY COMPONENT,  2019–2022 (USD MILLION)
                                   TABLE 275 ARGENTINA: MARKET, BY COMPONENT,  2023–2028 (USD MILLION)
                                   TABLE 276 ARGENTINA: MARKET, BY DEPLOYMENT MODE,  2019–2022 (USD MILLION)
                                   TABLE 277 ARGENTINA: MARKET, BY DEPLOYMENT MODE,  2023–2028 (USD MILLION)
             12.6.6 REST OF LATIN AMERICA
                       TABLE 278 REST OF LATIN AMERICA: VIDEO STREAMING SOFTWARE MARKET, BY COMPONENT, 2019–2022 (USD MILLION)
                       TABLE 279 REST OF LATIN AMERICA: MARKET, BY COMPONENT, 2023–2028 (USD MILLION)
                       TABLE 280 REST OF LATIN AMERICA: MARKET, BY DEPLOYMENT MODE, 2019–2022 (USD MILLION)
                       TABLE 281 REST OF LATIN AMERICA: MARKET, BY DEPLOYMENT MODE, 2023–2028 (USD MILLION)
 
13 COMPETITIVE LANDSCAPE (Page No. - 236)
     13.1 INTRODUCTION 
     13.2 STRATEGIES ADOPTED BY KEY PLAYERS 
     13.3 MARKET SHARE ANALYSIS 
               TABLE 282 MARKET SHARE OF KEY VENDORS IN 2022
               FIGURE 54 MARKET: MARKET SHARE ANALYSIS
     13.4 HISTORICAL REVENUE ANALYSIS OF TOP VENDORS 
               FIGURE 55 HISTORICAL REVENUE ANALYSIS, 2020–2022 (USD MILLION)
     13.5 COMPANY FINANCIAL METRICS 
               FIGURE 56 TRADING COMPARABLES (EV/ CY25E EBITDA)
     13.6 GLOBAL SNAPSHOT OF KEY MARKET PARTICIPANTS 
               FIGURE 57 VIDEO STREAMING SOFTWARE MARKET: GLOBAL SNAPSHOT OF KEY MARKET PARTICIPANTS, 2022
     13.7 KEY COMPANY EVALUATION QUADRANT 
               FIGURE 58 COMPANY EVALUATION MATRIX FOR KEY PLAYERS: CRITERIA WEIGHTAGE
             13.7.1 STARS
             13.7.2 EMERGING LEADERS
             13.7.3 PERVASIVE PLAYERS
             13.7.4 PARTICIPANTS
                       FIGURE 59 COMPANY EVALUATION QUADRANT FOR KEY PLAYERS
                       TABLE 283 OVERALL COMPANY FOOTPRINT FOR KEY PLAYERS
     13.8 EVALUATION QUADRANT FOR STARTUPS/SMES, 2022 
               FIGURE 60 EVALUATION MATRIX FOR STARTUPS/SMES: CRITERIA WEIGHTAGE
             13.8.1 RESPONSIVE COMPANIES
             13.8.2 PROGRESSIVE COMPANIES
             13.8.3 DYNAMIC COMPANIES
             13.8.4 STARTING BLOCKS
                       FIGURE 61 EVALUATION QUADRANT FOR STARTUPS/SMES
                       TABLE 284 OVERALL COMPANY FOOTPRINT FOR STARTUPS/SMES
             13.8.5 COMPETITIVE BENCHMARKING OF STARTUPS/SMES
                       TABLE 285 DETAILED LIST OF KEY STARTUPS/SMES
     13.9 KEY MARKET DEVELOPMENTS 
               TABLE 286 MARKET: PRODUCT LAUNCHES AND ENHANCEMENTS, 2019–2023
               TABLE 287 VIDEO STREAMING SOFTWARE MARKET: DEALS, 2018–2023
 
14 COMPANY PROFILES (Page No. - 253)
     14.1 INTRODUCTION 
     14.2 MAJOR PLAYERS 
Business overview, Products/Solutions/Services offered, Recent developments, MnM view, Key strengths, Strategic Choices, and Weaknesses and competitive threats
             14.2.1 IBM
                       TABLE 288 IBM: BUSINESS OVERVIEW
                       FIGURE 62 IBM: COMPANY SNAPSHOT
                       TABLE 289 IBM: PRODUCTS/SERVICES OFFERED
                       TABLE 290 IBM: PRODUCT LAUNCHES AND ENHANCEMENTS
                       TABLE 291 IBM: DEALS
             14.2.2 BRIGHTCOVE
                       TABLE 292 BRIGHTCOVE: BUSINESS OVERVIEW
                       FIGURE 63 BRIGHTCOVE: COMPANY SNAPSHOT
                       TABLE 293 BRIGHTCOVE: PRODUCTS/SERVICES OFFERED
                       TABLE 294 BRIGHTCOVE: PRODUCT LAUNCHES AND ENHANCEMENTS
                       TABLE 295 BRIGHTCOVE: DEALS
             14.2.3 KALTURA
                       TABLE 296 KALTURA: BUSINESS OVERVIEW
                       FIGURE 64 KALTURA: COMPANY SNAPSHOT
                       TABLE 297 KALTURA: PRODUCTS/SERVICES OFFERED
                       TABLE 298 KALTURA: PRODUCT LAUNCHES & ENHANCEMENTS
                       TABLE 299 KALTURA: DEALS
             14.2.4 AGILE CONTENT
                       TABLE 300 AGILE CONTENT: BUSINESS OVERVIEW
                       FIGURE 65 AGILE CONTENT: COMPANY SNAPSHOT
                       TABLE 301 AGILE CONTENT: PRODUCTS/SERVICES OFFERED
                       TABLE 302 AGILE CONTENT: PRODUCT LAUNCHES & ENHANCEMENTS
                       TABLE 303 AGILE CONTENT: DEALS
                       TABLE 304 AGILE CONTENT: OTHERS
             14.2.5 HAIVISION
                       TABLE 305 HAIVISION: BUSINESS OVERVIEW
                       FIGURE 66 HAIVISION: COMPANY SNAPSHOT
                       TABLE 306 HAIVISION: PRODUCTS/SERVICES OFFERED
                       TABLE 307 HAIVISION: PRODUCT LAUNCHES AND ENHANCEMENTS
                       TABLE 308 HAIVISION: DEALS
             14.2.6 VIMEO
                       TABLE 309 VIMEO: BUSINESS OVERVIEW
                       FIGURE 67 VIMEO: COMPANY SNAPSHOT
                       TABLE 310 VIMEO INC.: PRODUCTS/SERVICES OFFERED
                       TABLE 311 VIMEO: PRODUCT LAUNCHES & ENHANCEMENTS
                       TABLE 312 VIMEO: DEALS
             14.2.7 PANOPTO
                       TABLE 313 PANOPTO: BUSINESS OVERVIEW
                       TABLE 314 PANOPTO: PRODUCTS/SERVICES OFFERED
                       TABLE 315 PANOPTO: PRODUCT LAUNCHES AND ENHANCEMENTS
                       TABLE 316 PANOPTO: DEALS
             14.2.8 VBRICK
                       TABLE 317 VBRICK: BUSINESS OVERVIEW
                       TABLE 318 VBRICK: PRODUCTS/SERVICES OFFERED
                       TABLE 319 VBRICK: PRODUCT LAUNCHES & ENHANCEMENTS
                       TABLE 320 VBRICK: DEALS
             14.2.9 EDGIO
                       TABLE 321 EDGIO: BUSINESS OVERVIEW
                       FIGURE 68 EDGIO: COMPANY SNAPSHOT
                       TABLE 322 EDGIO: PRODUCTS/SERVICES OFFERED
                       TABLE 323 EDGIO: PRODUCT LAUNCHES AND ENHANCEMENTS
                       TABLE 324 EDGIO: DEALS
             14.2.10 AKAMAI
                       TABLE 325 AKAMAI: BUSINESS OVERVIEW
                       FIGURE 69 AKAMAI: COMPANY SNAPSHOT
                       TABLE 326 AKAMAI: PRODUCTS/SOLUTIONS OFFERED
                       TABLE 327 AKAMAI: PRODUCT LAUNCHES AND ENHANCEMENTS
                       TABLE 328 AKAMAI: DEALS
             14.2.11 SONIC FOUNDRY
                       TABLE 329 SONIC FOUNDRY: BUSINESS OVERVIEW
                       FIGURE 70 SONIC FOUNDRY: COMPANY SNAPSHOT
                       TABLE 330 SONIC FOUNDRY: PRODUCTS/SERVICES OFFERED
                       TABLE 331 SONIC FOUNDRY: PRODUCT LAUNCHES & ENHANCEMENTS
                       TABLE 332 SONIC FOUNDRY: DEALS
             14.2.12 QUMU
                       TABLE 333 QUMU: BUSINESS OVERVIEW
                       FIGURE 71 QUMU: COMPANY SNAPSHOT
                       TABLE 334 QUMU: PRODUCTS/SERVICES OFFERED
                       TABLE 335 QUMU: PRODUCT LAUNCHES & ENHANCEMENTS
                       TABLE 336 QUMU: DEALS
     14.3 OTHER PLAYERS 
             14.3.1 MEDIAPLATFORM
             14.3.2 DAILYMOTION
             14.3.3 NETGEM
             14.3.4 VIXY
             14.3.5 KINURA
             14.3.6 PIKSEL
             14.3.7 HIVE STREAMING
             14.3.9 BLUE BILLYWIG
     14.4 STARTUPS/SMES 
             14.4.1 SPROUTVIDEO
             14.4.2 WOWZA
             14.4.3 DACAST
             14.4.4 ZIXI
             14.4.5 KOLLECTIVE TECHNOLOGY
             14.4.6 MUVI
             14.4.7 MOVINGIMAGE
             14.4.8 VIDIZMO
             14.4.9 RAVNUR
             14.4.10 USTUDIO
             14.4.11 CONTUS TECH
             14.4.12 VIDYARD
*Details on Business overview, Products/Solutions/Services offered, Recent developments, MnM view, Key strengths, Strategic Choices, and Weaknesses and competitive threats might not be captured in case of unlisted companies.
 
15 ADJACENT/RELATED MARKETS (Page No. - 328)
     15.1 INTRODUCTION 
             15.1.1 RELATED MARKETS
             15.1.2 LIMITATIONS
     15.2 VIDEO PROCESSING PLATFORM MARKET 
               TABLE 337 VIDEO PROCESSING PLATFORM MARKET, BY VERTICAL, 2016–2020 (USD MILLION)
               TABLE 338 VIDEO PROCESSING PLATFORM MARKET, BY VERTICAL, 2021–2026 (USD MILLION)
               TABLE 339 BFSI: VIDEO PROCESSING PLATFORM MARKET, BY REGION,  2016–2020 (USD MILLION)
               TABLE 340 BFSI: VIDEO PROCESSING PLATFORM MARKET, BY REGION,  2021–2026 (USD MILLION)
               TABLE 341 EDUCATION: VIDEO PROCESSING PLATFORM MARKET, BY REGION,  2016–2020 (USD MILLION)
               TABLE 342 EDUCATION: VIDEO PROCESSING PLATFORM MARKET, BY REGION, 2021–2026 (USD MILLION)
               TABLE 343 GOVERNMENT: VIDEO PROCESSING PLATFORM MARKET, BY REGION,  2016–2020 (USD MILLION)
               TABLE 344 GOVERNMENT: VIDEO PROCESSING PLATFORM MARKET, BY REGION,  2021–2026 (USD MILLION)
               TABLE 345 HEALTHCARE AND LIFE SCIENCES: VIDEO PROCESSING PLATFORM MARKET,  BY REGION, 2016–2020 (USD MILLION)
               TABLE 346 HEALTHCARE AND LIFE SCIENCES: VIDEO PROCESSING PLATFORM MARKET, BY REGION, 2021–2026 (USD MILLION)
               TABLE 347 IT AND TELECOMMUNICATIONS: VIDEO PROCESSING PLATFORM MARKET,  BY REGION, 2016–2020 (USD MILLION)
               TABLE 348 IT AND TELECOMMUNICATIONS: VIDEO PROCESSING PLATFORM MARKET, BY REGION, 2021–2026 (USD MILLION)
               TABLE 349 MANUFACTURING: VIDEO PROCESSING PLATFORM MARKET, BY REGION,  2016–2020 (USD MILLION)
               TABLE 350 MANUFACTURING: VIDEO PROCESSING PLATFORM MARKET, BY REGION,  2021–2026 (USD MILLION)
               TABLE 351 MEDIA & ENTERTAINMENT: VIDEO PROCESSING PLATFORM MARKET,  BY REGION, 2016–2020 (USD MILLION)
               TABLE 352 MEDIA & ENTERTAINMENT: VIDEO PROCESSING PLATFORM MARKET,  BY REGION, 2021–2026 (USD MILLION)
               TABLE 353 RETAIL AND CONSUMER GOODS: VIDEO PROCESSING PLATFORM MARKET,  BY REGION, 2016–2020 (USD MILLION)
               TABLE 354 RETAIL AND CONSUMER GOODS: VIDEO PROCESSING PLATFORM MARKET,  BY REGION, 2021–2026 (USD MILLION)
               TABLE 355 OTHER VERTICALS: VIDEO PROCESSING PLATFORM MARKET, BY REGION,  2016–2020 (USD MILLION)
               TABLE 356 OTHER VERTICALS: VIDEO PROCESSING PLATFORM MARKET, BY REGION,  2021–2026 (USD MILLION)
     15.3 VIDEO CONTENT MANAGEMENT SYSTEM MARKET 
               TABLE 357 VIDEO CONTENT MANAGEMENT SYSTEM MARKET, BY INDUSTRY VERTICAL,  2019–2026 (USD MILLION)
               TABLE 358 BFSI: VIDEO CONTENT MANAGEMENT SYSTEM MARKET, BY REGION,  2019–2026 (USD MILLION)
               TABLE 359 IT AND TELECOM: VIDEO CONTENT MANAGEMENT SYSTEM MARKET, BY REGION,  2019–2026 (USD MILLION)
               TABLE 360 HEALTHCARE AND LIFE SCIENCES: VIDEO CONTENT MANAGEMENT SYSTEM MARKET,  BY REGION, 2019–2026 (USD MILLION)
               TABLE 361 EDUCATION: VIDEO CONTENT MANAGEMENT SYSTEM MARKET, BY REGION,  2019–2026 (USD MILLION)
               TABLE 362 MEDIA AND ENTERTAINMENT: VIDEO CONTENT MANAGEMENT SYSTEM MARKET, BY REGION, 2019–2026 (USD MILLION)
               TABLE 363 RETAIL AND E-COMMERCE: VIDEO CONTENT MANAGEMENT SYSTEM MARKET,  BY REGION, 2019–2026 (USD MILLION)
               TABLE 364 OTHER VERTICALS: VIDEO CONTENT MANAGEMENT SYSTEM MARKET, BY REGION,  2019–2026 (USD MILLION)
               TABLE 365 VIDEO CONTENT MANAGEMENT SYSTEM MARKET, BY REGION,  2019–2026 (USD MILLION)
               TABLE 366 NORTH AMERICA: VIDEO CONTENT MANAGEMENT SYSTEM MARKET, BY COMPONENT, 2019–2026 (USD MILLION)
               TABLE 367 NORTH AMERICA: VIDEO CONTENT MANAGEMENT SYSTEM MARKET, BY SERVICE,  2019–2026 (USD MILLION)
               TABLE 368 NORTH AMERICA: VIDEO CONTENT MANAGEMENT SYSTEM MARKET,  BY DEPLOYMENT MODE, 2019–2026 (USD MILLION)
               TABLE 369 NORTH AMERICA: VIDEO CONTENT MANAGEMENT SYSTEM MARKET,  BY APPLICATION, 2019–2026 (USD MILLION)
               TABLE 370 NORTH AMERICA: VIDEO CONTENT MANAGEMENT SYSTEM MARKET, BY INDUSTRY VERTICAL, 2019–2026 (USD MILLION)
               TABLE 371 NORTH AMERICA: VIDEO CONTENT MANAGEMENT SYSTEM MARKET, BY COUNTRY,  2019–2026 (USD MILLION)
               TABLE 372 US: VIDEO CONTENT MANAGEMENT SYSTEM MARKET, BY COMPONENT,  2019–2026 (USD MILLION)
               TABLE 373 US: VIDEO CONTENT MANAGEMENT SYSTEM MARKET, BY SERVICE,  2019–2026 (USD MILLION)
               TABLE 374 US: VIDEO CONTENT MANAGEMENT SYSTEM MARKET, BY DEPLOYMENT MODE,  2019–2026 (USD MILLION)
               TABLE 375 CANADA: VIDEO CONTENT MANAGEMENT SYSTEM MARKET, BY COMPONENT,  2019–2026 (USD MILLION)
               TABLE 376 CANADA: VIDEO CONTENT MANAGEMENT SYSTEM MARKET, BY SERVICE,  2019–2026 (USD MILLION)
               TABLE 377 CANADA: VIDEO CONTENT MANAGEMENT SYSTEM MARKET SIZE, BY DEPLOYMENT MODE, 2019–2026 (USD MILLION)
 
16 APPENDIX (Page No. - 343)
     16.1 DISCUSSION GUIDE 
     16.2 KNOWLEDGESTORE: MARKETSANDMARKETS’  SUBSCRIPTION PORTAL 
     16.3 CUSTOMIZATION OPTIONS 
     16.4 RELATED REPORTS 
     16.5 AUTHOR DETAILS 

The study involved four major activities in estimating the size of the video streaming software market. Exhaustive secondary research was done to collect information on the market, peer market, and parent market. The next step was to validate these findings, assumptions, and sizing with industry experts across value chains through primary research. The bottom-up approach was employed to estimate the overall market size. After that, market breakdown and data triangulation were used to estimate the market size of segments and subsegments.

Secondary Research

The market size of companies offering video streaming software solutions and services was derived on the basis of the secondary data available through paid and unpaid sources and by analyzing the product portfolios of major companies in the ecosystem and rating the companies based on their product capabilities and business strategies. In the secondary research process, various sources were referred to for identifying and collecting information for the study. Secondary sources included annual reports, press releases, and investor presentations of companies and product data sheets; white papers; journals; certified publications; and articles from recognized authors, government websites, directories, and databases.

Secondary research was majorly used to obtain the key information related to the industry’s supply chain, the total pool of key players, market classification, and segmentation according to industry trends to the bottom-most level, regional markets, and key developments from both market and technology-oriented perspectives; all of which were further validated by primary sources.

Primary Research

In the primary research process, various primary sources from both the supply and demand sides were interviewed to obtain qualitative and quantitative information on the market. The primary sources from the supply side included various industry experts, including Chief Experience Officers (CXOs); Vice Presidents (VPs); directors from business development, marketing, and product development/innovation teams; related key executives from video streaming software vendors, industry associations, and independent consultants; and key opinion leaders.

Primary interviews were conducted to gather insights, such as market statistics, the latest trends disrupting the market, new use cases implemented, data on revenue collected from products and services, market breakups, market size estimations, market forecasts, and data triangulation. Primary research also helped in understanding various trends related to technology, component, deployment, and region. Demand-side stakeholders, such as Chief Information Officers (CIOs), Chief Technology Officers (CTOs), Chief Security Officers (CSOs), the installation teams of governments/end users using video streaming software solutions, and digital initiatives project teams, were interviewed to understand the buyer’s perspective on suppliers, products, service providers, and their current use, which would affect the overall video streaming software market.
Video Streaming Software Market Size, and Share

To know about the assumptions considered for the study, download the pdf brochure

Market Size Estimation

Both top-down and bottom-up approaches were used to estimate and forecast the video streaming software market and other dependent submarkets. The bottom-up procedure was deployed to arrive at the overall market size using the revenues and offerings of key companies in the market. With data triangulation methods and validation through primary interviews, the exact value of the overall parent market size was determined and confirmed using this study. The overall market size was then used in the top-down procedure to estimate the size of other individual markets via percentage splits of the market segments.

Data Triangulation

After arriving at the overall market size—using the market size estimation processes as explained above—the market was split into several segments and subsegments. Data triangulation and market breakdown procedures were employed, wherever applicable, to complete the overall market engineering process and arrive at the exact statistics of each market segment and subsegment. The data was triangulated by studying various factors and trends from the demand and supply sides in media & entertainment, BFSI, academia & education, healthcare, government, and other verticals (manufacturing, retail & eCommerce, and telecommunications).

Market Definition

Video streaming enables enterprises to continuously deliver video data over a network or the internet to a remote user. A streaming provider offers various hosting options, such as on-premises and cloud-based, to meet users' needs. Video content such as TV shows, movies, and live streams is delivered on-demand or via live broadcast, usually from a cloud-based network. The video streaming software empowers enterprises to create, store, manage, monitor, and share video content across their systems for internal communication purposes or to present the information externally to a live audience. With different streaming types such as on-demand or live stream videos, customers can select and watch content with the help of different delivery channels. These channels include Pay-Television (TV), Internet Protocol TV (IPTV), and Over-The-Top (OTT) services. The video streaming software offers solutions, such as on-demand or live streaming, video delivery, transcoding & processing, video management, distribution, video analytics, and security, to help minimize upfront investment and ongoing maintenance costs. The video content is generally delivered through an enterprise Content Delivery Network (eCDN) that leverages private networks, including LANs and Wide Area Networks (WANs), for delivering content.

Key Stakeholders

  • Video streaming software vendors
  • Technology partners
  • Consulting firms
  • Resellers and distributors
  • Enterprise users
  • Technology providers
  • Value-Added Resellers (VARs)
  • End users
  • System integrators

Report Objectives

  • To define, describe, and forecast the global video streaming software market based on component (solutions and services), streaming types, deployment modes, monetization models, delivery channels, verticals, and regions
  • To forecast the market size of the five major regional segments: North America, Europe, Asia Pacific, Middle East & Africa, and Latin America
  • To strategically analyze the market subsegments with respect to individual growth trends, prospects, and contributions to the total market
  • To provide detailed information related to the major factors influencing the growth of the market (drivers, restraints, opportunities, and challenges)
  • To strategically analyze macro and micromarkets1 with respect to growth trends, prospects, and their contributions to the overall market
  • To analyze industry trends, patents and innovations, and pricing data related to the video streaming software market
  • To analyze the opportunities in the market for stakeholders and provide details of the competitive landscape for major players
  • To profile key players in the market and comprehensively analyze their market share/ranking and core competencies.
  • To track and analyze competitive developments, such as mergers and acquisitions, new product developments, and partnerships and collaborations in the market.

Available Customizations

With the given market data, MarketsandMarkets offers customizations as per the company’s specific needs. The following customization options are available for the report:

Product Analysis

  • Product matrix provides a detailed comparison of the product portfolio of each company

Geographic Analysis

  • Further breakup of the Asia Pacific market into countries contributing 75% to the regional market size
  • Further breakup of the North American market into countries contributing 75% to the regional market size
  • Further breakup of the Latin American market into countries contributing 75% to the regional market size
  • Further breakup of the Middle Eastern & African market into countries contributing 75% to the regional market size
  • Further breakup of the European market into countries contributing 75% to the regional market size

Company Information

  • Detailed analysis and profiling of additional market players (up to 5)
Custom Market Research Services

We will customize the research for you, in case the report listed above does not meet with your exact requirements. Our custom research will comprehensively cover the business information you require to help you arrive at strategic and profitable business decisions.

Request Customization

Instant Answers with GPT - Ask Now!

Ask real questions. Get complete answers !
Report Code
TC 4278
Published ON
May, 2023
Choose License Type
BUY NOW
  • SHARE
X
Request Customization
Speak to Analyst
Speak to Analyst
OR FACE-TO-FACE MEETING
PERSONALIZE THIS RESEARCH
  • Triangulate with your Own Data
  • Get Data as per your Format and Definition
  • Gain a Deeper Dive on a Specific Application, Geography, Customer or Competitor
  • Any level of Personalization
REQUEST A FREE CUSTOMIZATION
LET US HELP YOU!
  • What are the Known and Unknown Adjacencies Impacting the Video Streaming Software Market
  • What will your New Revenue Sources be?
  • Who will be your Top Customer; what will make them switch?
  • Defend your Market Share or Win Competitors
  • Get a Scorecard for Target Partners
CUSTOMIZED WORKSHOP REQUEST
+1-888-600-6441
  • Call Us
  • +1-888-600-6441 (Corporate office hours)
  • +1-888-600-6441 (US/Can toll free)
  • +44-800-368-9399 (UK office hours)
CONNECT WITH US
ABOUT TRUST ONLINE
©2024 MarketsandMarkets Research Private Ltd. All rights reserved
DMCA.com Protection Status Website Feedback