
Bioplastics & Biopolymers Market
Bioplastics & Biopolymers Market by Product Type (Biodegradable, Non-biodegradable), End-use Industry (Packaging, Automotive, Textile, Consumer Goods, Agriculture), Raw Material (Sugarcane, Wheat, Corn Starch), & Region - Global Forecast to 2030


OVERVIEW
Source: Secondary Research, Interviews with Experts, MarketsandMarkets Analysis
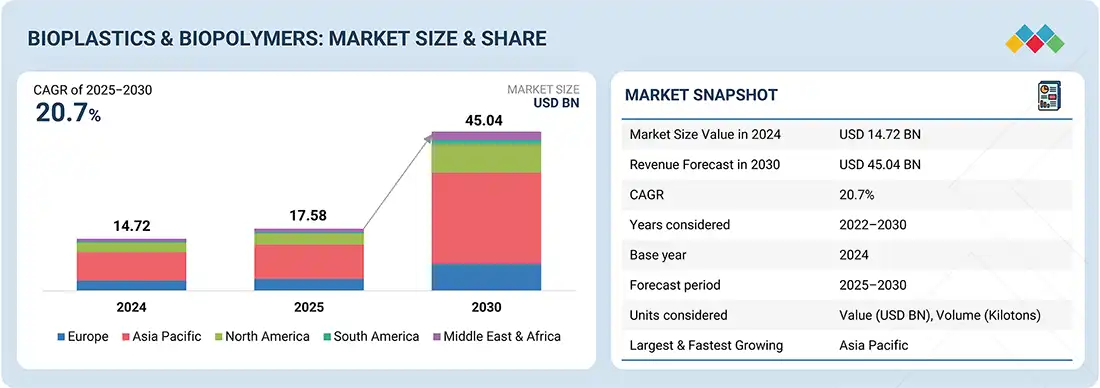
The bioplastics & biopolymers market is projected to reach USD 45.04 billion by 2030 from USD 17.58 billion in 2025, at a CAGR of 20.7% from 2025 to 2030. The market for bioplastics & biopolymers is growing rapidly. It is being fuelled primarily by the stringent environmental regulations
KEY TAKEAWAYS
-
BY PRODUCT TYPEIncreasing demand for environmentally friendly materials is propelling the growth. PHA is experiencing huge growth due to its fully biodegradable nature and expanding applications
-
BY RAW MATERIAL TYPEBioplastics & biopolymer market is heavily relying renewable raw materials such as sugarcane, starch and agricultural residues—to reduce dependence on fossil fuels, lower carbon footprint.
-
BY END-USE INDUSTRYKey trends for bioplastics & biopolymers end-use industries include growth in sustainable packaging, consumer goods, electronics, automotive, agriculture, and others.
-
BY REGIONAsia Pacific is expected to grow fastest, with a CAGR of 21.6%, driven by stringent environmental regulations and strong adoption in the packaging and agriculture & consumer goods industries
-
COMPETITIVE LANDSCAPEThe market is driven by strategic collaborations, capacity expansions, and technological innovations from leading players such as NatureWorks LLC (US), Braskem (Brazil), BASF SE (Germany), TotalEnergies Corbion (Netherlands), Versalis S.P.A (Italy), Biome Bioplastics Limited (UK), Mitsubishi Chemical Group Corporation (Japan). These companies are heavily investing in new technologies.
Thebioplastics & biopolymers market experiencing strong growth due to stringent environmental regulations, technological advancments and growing consumer awareness. Also it is being fulled by massive growth of packaging, automotive, agriculture, building & construction and others with the requirement for lightweight durable, and transparent alternatives with good performance. Rising industrialization in the rising economies like China, India, and Brazil, and the state-of-the-art manufacturing technologies are driving the growth
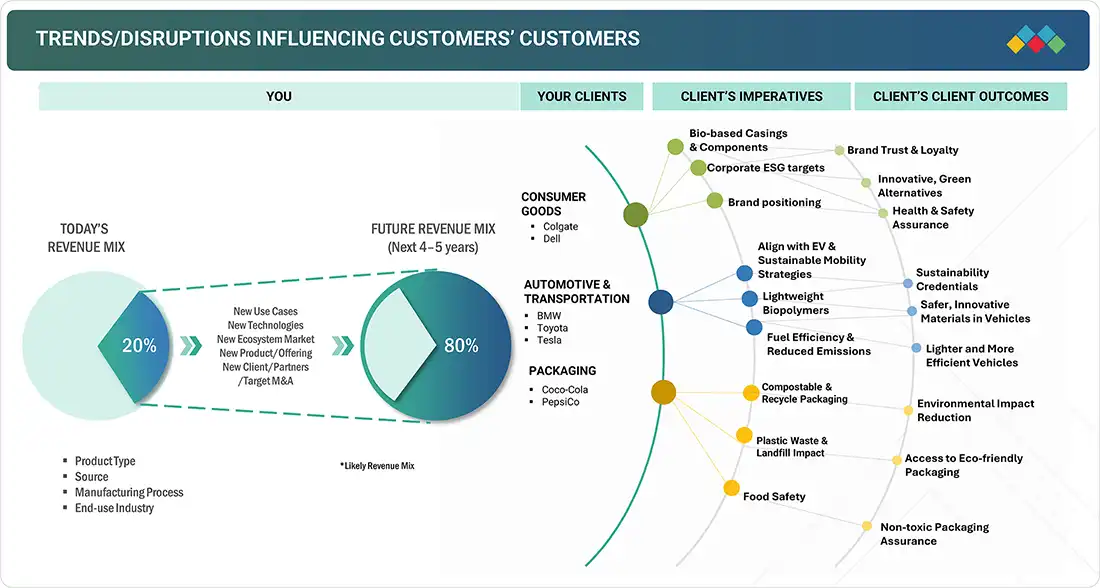
TRENDS & DISRUPTIONS IMPACTING CUSTOMERS' CUSTOMERS
Changes in customer trends or disruptions impact consumers’ businesses. These shifts impact the revenues of end users. Consequently, the revenue impact on end users is expected to affect the revenues of bioplastics & biopolymers suppliers, which, in turn, impacts the revenues of bioplastics & biopolymers manufacturers
Source: Secondary Research, Interviews with Experts, MarketsandMarkets Analysis
MARKET DYNAMICS
Level
-
Increasing use in packaging and compostable applications.

-
Shift in consumer preference in bio-plastics

Level
-
Performance issues in bioplastics

-
Higher prices of biodegradable plastics than that of alternatives

Level
-
Growth in emerging markets.

-
Development of new applications

Level
-
Expansive & complex production process.

-
Segregation & processing of bioplastics

Source: Secondary Research, Interviews with Experts, MarketsandMarkets Analysis
Driver: Increasing use in packaging and compostable applications
Among the strongest drivers of the increasing use of bioplastics in packaging and compostable applications is the trend towards sustainability, stringent regulations and reducing plastic waste. Traditional fossil fuel-derived plastics have the largest market share the packaging market because they are highly durable, flexible, and cheap, but the major concern of conventional bioplastic is harmful environmental impact such as permanence in landfills and the oceans, which created growing concern for governments, businesses, and consumers. Stringent regulations and government policies of various countries across EU, North America, and Asia Pacific are propelling the bioplastic market. Bioplastics such as PLA, PBAT, and starch blends qualify because they disintegrate under industrial composting conditions, allowing for less waste to build up and helping circular economic goals. In packaging end-use industry, bioplastics are mostly used for food and beverage packaging containers, bags, and disposable cutlery. Their properties such as lightweight, biodegradability, transparency, making them favourable compare to conventional plastics with an environmentally friendly profile. . Growing customers’ preference for the green and alternative options, coupled with corporate commitments to reduce carbon emissions and adopt sustainable packaging objectives, also drives demand. As the major brand and retailers turning to compostable and environmental friendly packaging, economies of scale are improving production costs, making bioplastics more accessible. Together, all these trends make packaging one of the most rapidly expanding segments in the global bioplastics and biopolymers market
Restraint: Performance issues in bioplastics.
One of the key restraining factor of the biopolymer and bioplastic market is performance limitation as compare to fossil based plastics which provide superior performance. While many bioplastics such as Polylactic Acid (PLA), Polybutylene Adipate Terephthalate (PBAT), starch plastics and others provides sustainability and biodegradability, but they lag behind in properties such resistance to heat, moisture and oxygen barrier qualities, mechanical strength, and durability. For instance, PLA becomes deformed at hot temperature conditions. It started deformation around 122-140 F, so it is not suitable for high temperature packaging applications or for long storage. Similarly, plastics made from starch blends have lower tensile strength, restraining their application in high strength packaging segment and for some industrial applications. All these factors are a cause of major concern for global bioplastic & biopolymer producers as well as consumers, especially in end-use industries such as food & beverages, and automotive, where product safety and durability are of utmost importance. In addition, performance deficiencies usually require the blending of bioplastics with fossil-based plastics or the use of costly additives, which will undermine their environmental benefit and cost competitiveness. Apart from material innovations, which overcome this deficiency, performance problems will remain a strong factor to large-scale adoption
Opportunity: Growth in emerging markets.
Growth of emerging markets is a opportunity for the bioplastics and biopolymer market, particularly in Asia-Pacific, Middle East & Africa, and South America, . These emerging markets are experiencing rapid industrialization, urbanization, coupled with rising disposable incomes, propelling demand for sustainable packaging, agricultural, and consumer products. Also governments of the APAC countries are banning single-use plastics and promoting the biodegradable substitutes, which directly stimulating the expansion of bioplastics & biopolymers in various application such as shopping bags, food packaging, biodegradable films and others. Food and beverages industry, retail expansion, and agricultural revolution are among the most influential forces behind such demand. Bioplastics have the dual benefit of usability and eco-compatibility that aligns with consumer awareness and business sustainability goals as well. In addition, emerging healthcare infrastructure in developing economies is creating possibilities for biopolymers for medical packaging and equipment. Another influential driver of opportunity is growth of local manufacturing capacities. India, China, Thailand, Brazil, and others are utilizing their agricultural crops such as sugarcane, corn, and cassava, to produce affordable bioplastics. This reduces the heavy reliance on imports and provides more export potential to developed nations. With international companies extending green initiatives to these fast-growing economies, it helps these countries positioned to become the backbone of future bioplastics demand, enabling large-scale adoption and long-term market growth
Challenge: Expensive & complex production processes.
Expensive & complex production process is the major challenge for the bioplastics & biopolymers market. In contrast to traditional plastics, which benefits from mature & advanced technologies and highly optimized world-wide supply chains, bioplastics are often more complex processes using fermentation, polymerization, and compounding of renewable resources like corn, sugarcane, or cassava and others. These operations entail huge capital investment in dedicated plants, higher energy usage, and well advanced technologies, all of which contribute to higher production expenses. Additionally, several biopolymers require expensive catalysts or additives in order to perform well, thus raising the overall cost.Another challenge is the narrow economies of scale. As demand increases, volumes of production of bioplastics continue to fall well behind those of fossil plastics, making it more difficult to achieve cost equivalence. The raw material supply chain is similarly less secure, as it is in competition with agricultural cycles and food production, making it prone to volatility in prices. Additionally, large-scale production involves technical challenges, including consistent product quality and compatibility with current plastic processing equipment. These parameters together drive bioplastics to be more costly in the market, thereby curtailing their usage within price-sensitive sectors. Unless there are technological breakthroughs and high-scale investments that reduce production costs, the high cost and intricacy of production will remain a dominant restraint for the sector.
Bioplastics & Biopolymers Market: COMMERCIAL USE CASES ACROSS INDUSTRIES
| COMPANY | USE CASE DESCRIPTION | BENEFITS |
|---|---|---|
 |
Biopolymer-based cartons using sugarcane-derived plastics) | Renewable sourcing, lower carbon footprint, recyclable, compliance with bans. |
 |
Compostable and recyclable bio-based food wrappers and bottles | Reduced landfill waste, eco-friendly branding, consumer trust. |
 |
Bio-based packaging for personal care & food products | Compliance with plastic regulations, brand sustainability, lower emissions. |
 |
Bioplastics in snack packaging, beverage bottles, and films | Lower plastic pollution, cost-efficient scaling, improved circular economy. |
Logos and trademarks shown above are the property of their respective owners. Their use here is for informational and illustrative purposes only.
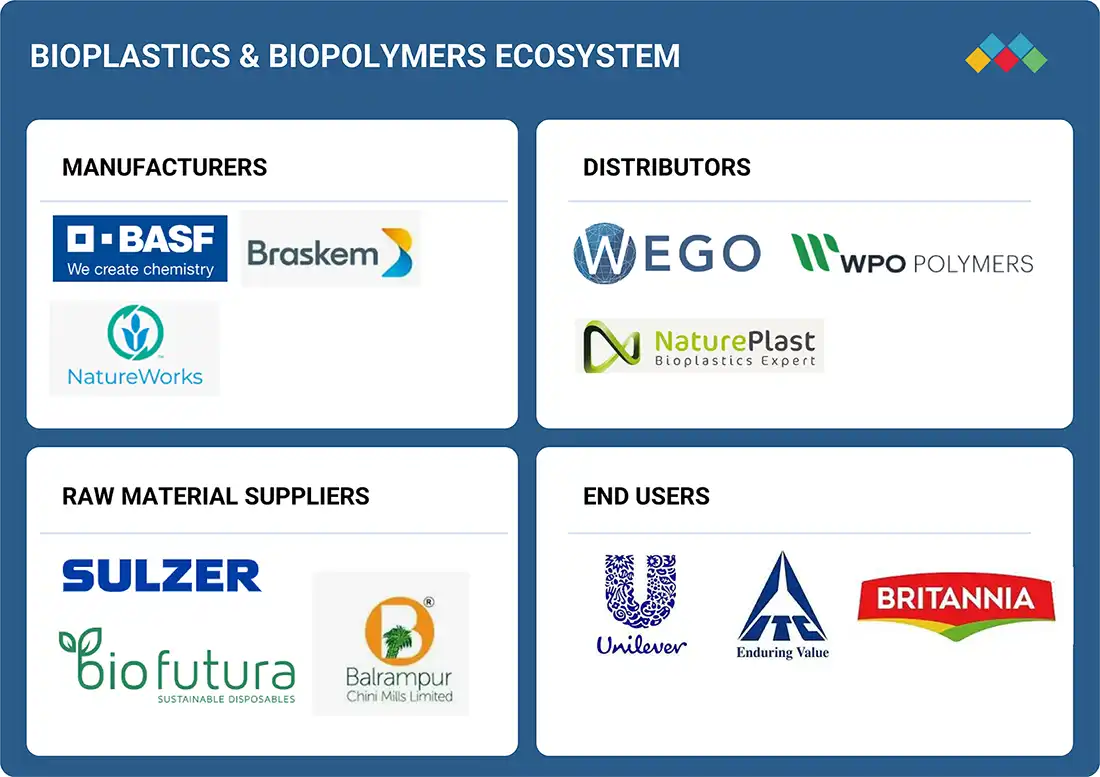
MARKET ECOSYSTEM
The bioplastics & biopolymers ecosystem analysis involves identifying and analyzing interconnected relationships among various stakeholders, including raw material suppliers, manufacturers, distributors, and end users. The raw material suppliers provide corn starch, cassava, sugarcane, starch to bioplastics & biopolymers manufacturers. The distributors and suppliers establish contact between the manufacturing companies and end users to streamline the supply chain, increasing operational efficiency and profitability
Logos and trademarks shown above are the property of their respective owners. Their use here is for informational and illustrative purposes only.
MARKET SEGMENTS
Source: Secondary Research, Interviews with Experts, MarketsandMarkets Analysis
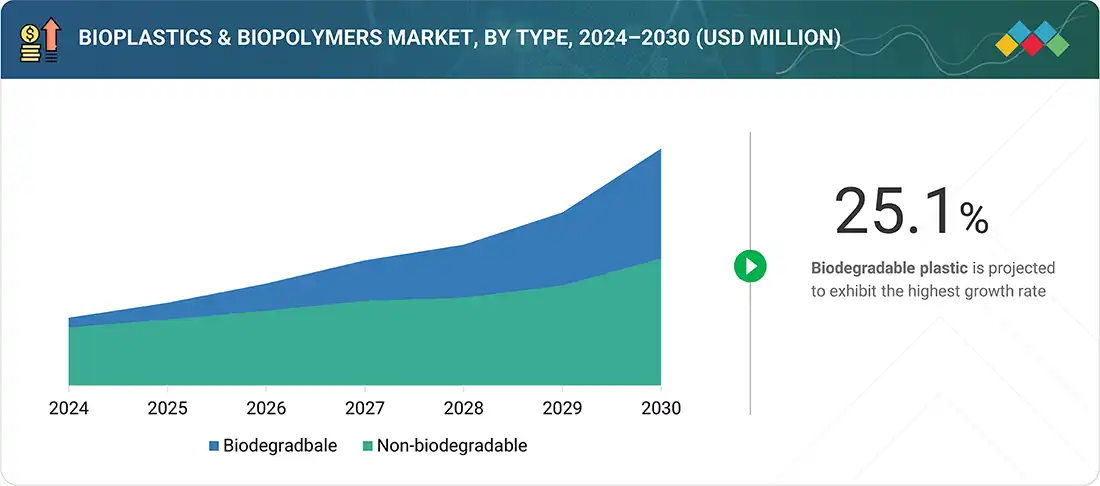
Bioplastics & Biopolymers Market, By Product Type
The biodegradable plastics segment to be the largest product type of the bioplastics and biopolymers market. It is due to its extensive application, stringent environmental regulations and favourable government policies. Polylactic acid (PLA), polybutylene adipate terephthalate (PBAT), starch blends , PHA are some of the examples of biodegradable plastics that find growing application in packaging, agriculture, textiles, consumer goods and others due to their properties such as transparency, biodegradability, and eco-friendly footprint. Government action and prohibition of single-use plastics are another major factor facilitating this segment. US government are providing funding for biomass research at the US department of agriculture. Also Some states in US have banned distribution, sale and offering of single-use plastics. In 2019, Mexico prohibited the marketing, and delivery of single-use plastics to the consumer at the point of sale. Germany have prohibited single-use plastic straws , from july 2021 aligning with the EU directives. Similarly many Asian and African countries also prohibited the use of single use plastics, thus fueling adoption.In addition, growing consumer awareness and the transition toward sustainable lifestyles have increased demand for biodegradable plastics
Bioplastics & Biopolymers Market, By End-use Industry
The packaging segment to be the largest end-use industry type of the biopolymers and bioplastics market. It is due to increased demand from food & beverage, retail and e-commerce demand. Bioplastics such as polylactic acid (PLA), Bio-PET, polybutylene adipate terephthalate (PBAT), and starch blends are used for the production of bags, bottles, films, food packages, and cutlery . Their characteristics, such as lightweight nature, good transparency, and sufficient barrier performance, positioned them as a favorable option. One of the propelling factor for this supremacy is the stringent environmental regulations and prohibition of single use plastics. Many Countries such as US, Canada, Mexico, India, Japan, New-Zealand, Australia, UK, France and others have prohibited the marketing and use of single-use plastics in packaging application
REGION
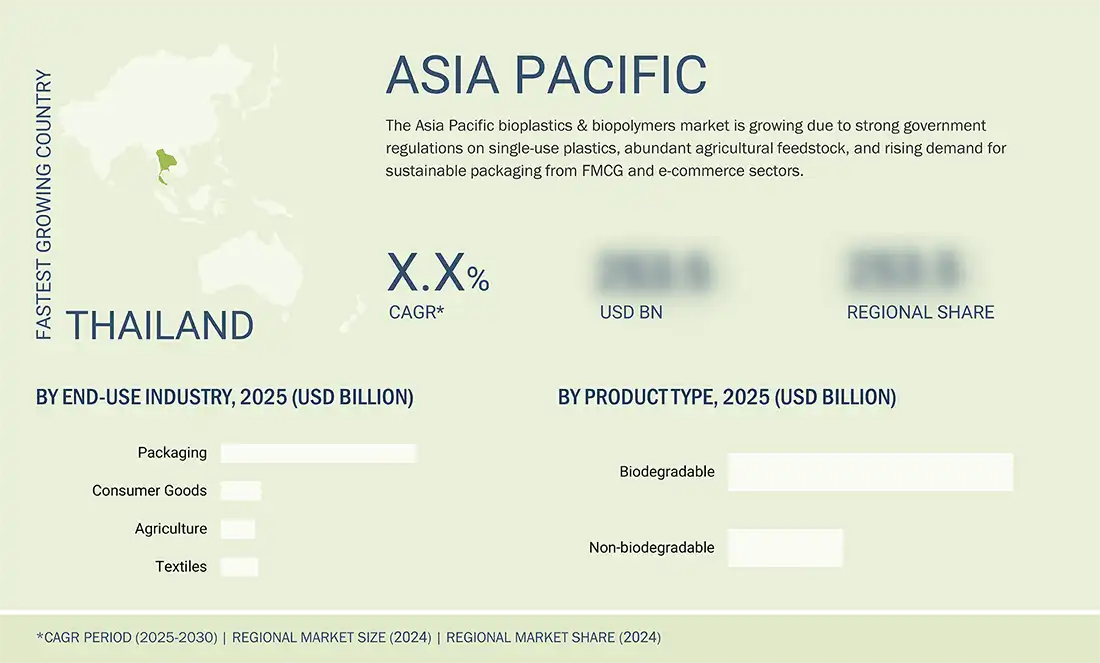
Asia Pacific to be fastest-growing region in global bioplastics & biopolymers market during forecast period
Asia Pacific dominates the world bioplastics & biopolymer market due to high-speed industrialization, urbanization, stringent environmental regulations and infrastructure growth in major economies like China, India, Japan, and Southeast Asian countries. The accelerating end-use industries, particularly packaging, consumer goods, textile, automotive , agriculture & horticulture , and others, have contributed considerable growth in demand for high-performance bioplastics. In India, packaging industry is growing rapidly, currently it is the 5th largest sector of Indian economy. It is projected to grow at a compound annual growth rate (CAGR) of almost 26%. It is driven by increasing investment, rise in demand from personal care, home care products and emergence of e-commerce. India’s packaging sector expected to reach USD 204 billion by 2025. Due to favourable policies, government support, and strong consumer base , many companies are expanding their capacities to cater the demand, subsequently, it propels the growth of bioplastic & biopolymers market. In the same way, Chinese government are heavily investing in bioplastic industry also availability of raw materials, cheap labour and favourable government policies fuelling the bioplastic & biopolymers market. Having a big consumer base, cost-competitive manufacturing, easy availability of raw material, and favourable regulation & policies provides Asia Pacific the position of being the major propelling factor for market
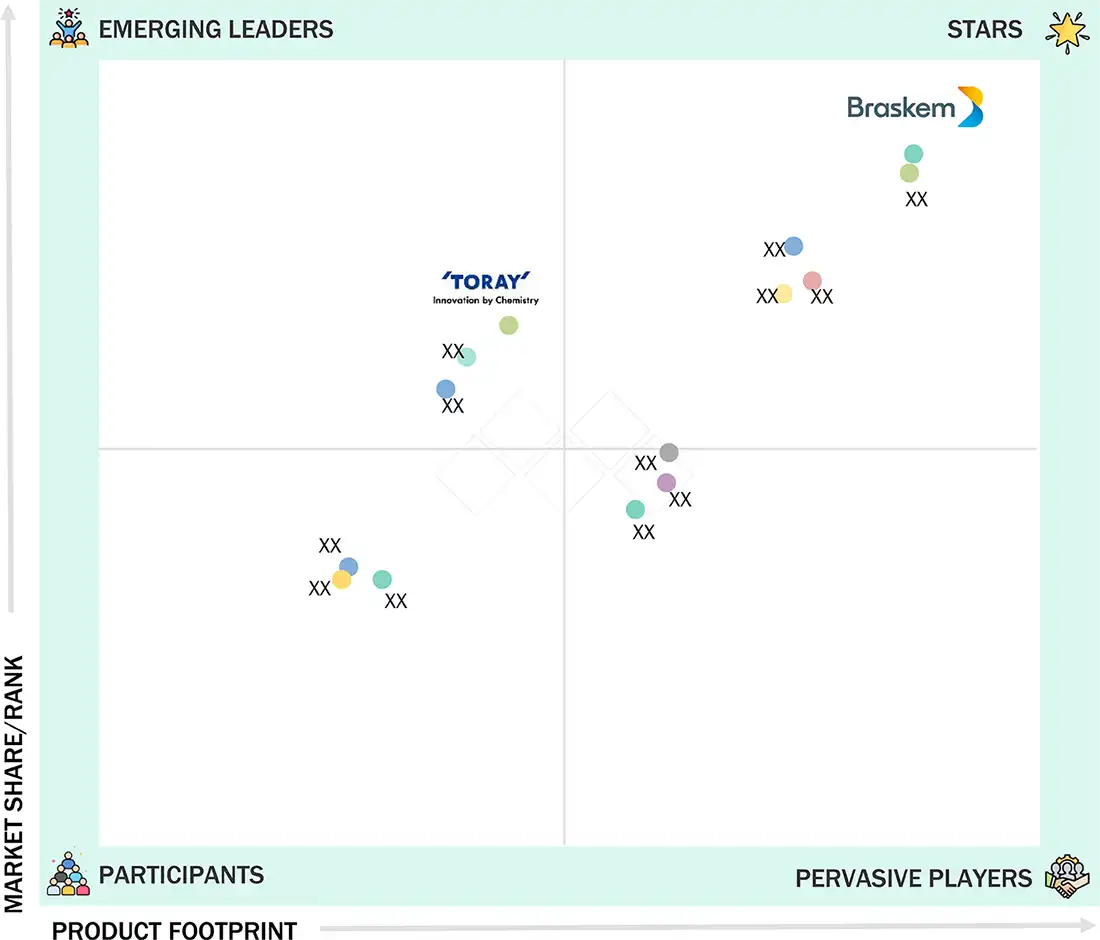
Bioplastics & Biopolymers Market: COMPANY EVALUATION MATRIX
In the bioplastics & biopolymers market matrix, Braskem (Star), a Brazil company, leads the market through its high-quality bioplastics & biopolymers products, which find extensive applications in packaging and other applications. Toray Industries (Emerging Leader) is gaining traction with its technological advancements in bioplastics & biopolymers
Source: Secondary Research, Interviews with Experts, MarketsandMarkets Analysis
KEY MARKET PLAYERS
MARKET SCOPE
| REPORT METRIC | DETAILS |
|---|---|
| Market Size Value in 2024 | USD 14.72 Billion |
| Revenue Forecast in 2030 | USD 45.04 Billion |
| Growth Rate | CAGR of 20.7% from 2025-2030 |
| Actual data | 2024–2030 |
| Base year | 2024 |
| Forecast period | 2025–2030 |
| Units considered | Value (USD Million), Volume (Kilotons) |
| Report Coverage | Revenue forecast, company ranking, competitive landscape, growth factors, and trends |
| Segments Covered | · By Product Type: Biodegradable, non-biodegradable |
| Regional Scope | Europe, North America, Asia Pacific, the Middle East & Africa, and South America |
WHAT IS IN IT FOR YOU: Bioplastics & Biopolymers Market REPORT CONTENT GUIDE
DELIVERED CUSTOMIZATIONS
We have successfully delivered the following deep-dive customizations:
| CLIENT REQUEST | CUSTOMIZATION DELIVERED | VALUE ADDS |
|---|---|---|
| APAC-based Bioplastics & Biopolymers Manufacturers | • Detailed company profiles of bioplastics & biopolymers competitors (financials, product portfolio) | • Identified & profiled 20+ bioplastics & biopolymers companies |
| Need Insights On Global Regulations Impacting Bioplastics Adoption | • Delivered a regulatory mapping report covering EU Green Deal, U.S. EPA guidelines, APAC single-use plastic bans, and extended producer responsibility (EPR) frameworks | • Helped client anticipate compliance costs, align product roadmap, and enter new geographies with regulatory clarity |
| Interest in future policy trends | • Provided scenario analysis on upcoming policies (plastic taxes, recycling targets, subsidies for bio-based materials) | • Supported long-term investment decisions and strategic positioning in sustainable materials |
RECENT DEVELOPMENTS
- April 2025 : TotalEnergies Corbion and Useon have entered into a strategic partnership to accelerate the development and worldwide commercialization of EPLA molded products — an innovative line of sustainable, high-performance foam materials made using Luminy PLA bioplastics. Under this collaboration, the two companies will work together to promote EPLA technology on a global scale, exchange application expertise and market knowledge, and jointly drive innovation in new product development
- November 2023 : Braskem announced a partnership with Oxiteno, one of the world's leading petrochemical producers. Through this partnership, the company focuses on providing sustainable solutions in the petrochemical sector and strengthening its geographical presence
- January 2023 : Braskem acquired taulman 3D, a leading 3D filament supplier of nylon, recycled PETG, and PET filaments to aerospace, automotive, healthcare, industrial, government, and higher education professionals worldwide. This acquisition has helped the company to strengthen its portfolio of (Polyethylene (PE), Polypropylene (PP), Carbon Fiber, Glass Fiber & Recycled Polymers), pellets, and powders designed specifically for 3D printing applications
- November 2022 : NatureWorks signed a collaboration agreement with CJ Biomaterials, a South Korea-based CJ CheilJedang division, and a leading polyhydroxyalkanoate (PHA) producer. The collaboration aims to develop sustainable material solutions based on CJ Biomaterials’ PHACT Biodegradable Polymers and NatureWorks’ Ingeo biopolymers. Both companies will develop high-performance biopolymer solutions that are an alternative to fossil-fuel-based plastics in applications ranging from compostable food packaging and food serviceware to personal care, films, and other end products
- June 2022 : Confoil, an Australian food packaging manufacturer, and BASF collaborated to develop certified compostable dual ovenable paper trays for packaging. These trays are made of lightweight paperboard and coated with BASF’s biopolymer Ecovio PS 1606.
Table of Contents
 Exclusive indicates content/data unique to MarketsandMarkets and not available with any competitors.
Methodology
The study involved four main activities to estimate the current size of the global bioplastics & biopolymers market. Extensive secondary research was performed to gather information on the market, related product markets, and the parent product group market. The next step was to validate these findings, assumptions, and market sizes with industry experts across the bioplastics & biopolymers value chain through primary research. Both top-down and bottom-up approaches were used to estimate the overall market size. Afterward, market segmentation and data triangulation procedures were applied to determine the sizes of various segments and sub-segments of the market.
Secondary Research
In the secondary research process, various sources such as Hoovers, Factiva, Bloomberg BusinessWeek, and Dun & Bradstreet were used to gather information for this study on the bioplastics & biopolymers market. These sources included annual reports, press releases, and investor presentations of companies, white papers, certified publications, articles by recognized authors, regulatory bodies, trade directories, and databases.
Primary Research
The bioplastics & biopolymers market includes several stakeholders in the supply chain, such as raw material suppliers, equipment providers, distributors, end-product manufacturers, buyers, and regulatory agencies. Various primary sources from both the supply and demand sides have been interviewed to gather both qualitative and quantitative data. On the demand side, key participants include opinion leaders, executives, vice presidents, and CEOs of companies in the bioplastics & biopolymers market. On the supply side, primary sources include associations and institutions involved in the market, as well as key opinion leaders and processing companies.
The following is the breakdown of primary respondents:

To know about the assumptions considered for the study, download the pdf brochure
Market Size Estimation
The bottom-up and top-down approaches have been used to estimate the bioplastics & biopolymers market by raw material, product type, end-use industry, and region. The research methodology used to calculate the market size includes the following steps:
- The key players in the industry and markets were identified through extensive secondary research.
- In terms of value, the industry’s supply chain and market size were determined through primary and secondary research processes.
- All percentage shares, splits, and breakdowns were determined using secondary sources and verified through primary sources.
- All possible parameters that affect the markets covered in this research study were accounted for, viewed in extensive detail, verified through primary research, and analyzed to obtain the final quantitative and qualitative data.
- The research included studying reports, reviews, and newsletters of top market players and extensive interviews with leaders, such as directors and marketing executives, to obtain opinions.
The following figure illustrates the overall market size estimation process employed for this study.

Data Triangulation
After estimating the overall size of the bioplastics & biopolymers market described above, the total market was divided into several segments and sub-segments. Data triangulation and market breakdown methods were used, where applicable, to complete the overall market analysis and determine precise statistics for all segments and subsegments. The data was triangulated by examining various factors and trends from both the demand and supply sides. Additionally, the market size was validated using both top-down and bottom-up approaches.
Market Definition
Bioplastics & biopolymers are made from renewable resources like corn, sugarcane, cassava, and other plant-based sources, making them an environmentally friendly alternative to petroleum plastics. These materials are lightweight, strong, and versatile, with properties that can be customized for specific uses such as packaging, agriculture, automotive, and consumer products.
Stakeholders
- Bioplastics & Biopolymers Manufacturers
- Raw Material Suppliers
- Equipment suppliers
- Regulatory Bodies and Government Agencies
- Distributors and Suppliers
- End-Use Industries
- Associations and Industrial Bodies
Report Objectives
- To define, describe, and forecast the size of the bioplastics & biopolymers market in terms of value and volume
- To provide detailed information regarding the key factors influencing the growth of the market (drivers, restraints, opportunities, and challenges)
- To forecast the market size based on product type, raw material, end-use industry, and region
- To forecast the market size for the five main regions—North America, Europe, the Asia Pacific, South America, and the Middle East & Africa—along with their key countries.
- To strategically analyze micro markets with respect to individual growth trends, prospects, and contributions to the total market.
- To analyze the opportunities in the market for stakeholders and provide details of the competitive landscape for the market leaders.
- To strategically profile leading players and comprehensively analyze their key developments, such as new product launches, expansions, and deals in the bioplastics & biopolymers market.
- To strategically profile key players and comprehensively analyze their market shares and core competencies.
- To study the impact of AI/Gen AI on the market under study, along with the macroeconomic outlook.
Key Questions Addressed by the Report
Which are the major companies in the bioplastics & biopolymers market? What key strategies have market players adopted to strengthen their market presence?
Major players include NatureWorks LLC (US), Braskem (Brazil), BASF SE (Germany), TotalEnergies Corbion (Netherlands), Versalis S.P.A (Italy), Biome Bioplastics Limited (UK), Mitsubishi Chemical Group Corporation (Japan), Biotec Biologische Naturverpackungen GmbH & Co. (Germany), Plantic Technologies Limited (Australia), and Toray Industries, Inc. (Japan). Key strategies adopted include product launches, acquisitions, and expansions.
What are the drivers and opportunities for the bioplastics & biopolymers market?
Stringent environmental regulations are the main driver, creating strong demand for sustainable alternatives to conventional plastics.
Which region is expected to hold the largest market share?
The Asia Pacific region holds the largest market share due to high demand and rapid industrial growth.
What is the projected growth rate of the bioplastics & biopolymers market over the next five years?
The market is projected to register a CAGR of 20.7% during the forecast period.
How is the bioplastics & biopolymers market aligned for future growth?
The market is aligned for future growth due to advancements in bio-based feedstock technologies, sustainable packaging trends, favorable legislation, and expanding applications in textiles, automotive, and other sectors.
Need a Tailored Report?
Customize this report to your needs
Get 10% FREE Customization
Customize This ReportPersonalize This Research
- Triangulate with your Own Data
- Get Data as per your Format and Definition
- Gain a Deeper Dive on a Specific Application, Geography, Customer or Competitor
- Any level of Personalization
Let Us Help You
- What are the Known and Unknown Adjacencies Impacting the Bioplastics & Biopolymers Market
- What will your New Revenue Sources be?
- Who will be your Top Customer; what will make them switch?
- Defend your Market Share or Win Competitors
- Get a Scorecard for Target Partners

Custom Market Research Services
We Will Customise The Research For You, In Case The Report Listed Above Does Not Meet With Your Requirements
Get 10% Free CustomisationTESTIMONIALS

We at Nissan Chemicals Corporation have been clients of MarketsandMarkets for more than a year now. We recently consulted MarketsandMarkets for a study, the team at MarketsandMarkets was extremely professional and organized. The business insights were very detailed and aligned well with our expectations that really helped us formulate the Business Plans and device new strategies for development themes. MarketsandMarkets offers a unique combination of expertise and dedicated engagement model. Their research findings have helped us in designing our Pricing Strategy which will make it easier for us to predict the future sales and profits for the next ten years. We look forward to working with MarketsandMarkets in the future.
VP of Strategy & New Business Development
Leading Specialty Chemical Company
The MarketsandMarkets Engagement Model, composed of both the Knowledge Store and advisory custom research, has greatly helped us in understanding our markets and making strategic decisions. The Knowledge Store is a fast way to allow everyone in our organization to understand more about most any market they are interested in. The ability to then get custom research done and get answers to specific strategic questions and market insight has been spectacular. The Markets and Markets team feel more like colleagues than vendors and their services have helped us change our culture where statements of things like growth opportunities and competitive position are always backed by industry research.

Rich Gibson,
Director, Corporate Strategy
Milliken & Company,
Leading Industrial Manufacturer of specialty chemical, floor covering, performance and protective textile materials, and healthcaremilliken.com
MarketsandMarkets is a trusted resource that helps us to better understand markets that are near-adjacencies-whether its technology, value chain or geography. Their Knowledge Store platform provides a dashboard of markets and their characteristics which is easy to use and saves us time.
Adam Shaw,
Market Development and Strategy Manager
AdvanSix Inc. USA,
An American Leader in Chemicalswww.advansix.com
The Knowledge Store from MarketsandMarkets is a valuable tool which has helped my team acquire greater insight in to the end markets that our business serves. This has enabled us to help our company build stronger strategies throughout our planning process.
TOSHIO KINOSHITA
Senior Chif Consultion Research & Consulting Division
Mitsubishi Chemical Research Corporation,
Leading Manufacturer of Chemical Productswww.mitsubishichem-res.co.jp/en/

We recently engaged with MarketsandMarkets for a study, the team not only clearly understood our business objectives but was also extremely professional in the way they handled the entire project. The study was efficiently conducted in a phase-wise manner, and the engagement model furnished us with high-quality business insights that far exceeded our expectations at each phase. We were especially happy that MarketsandMarkets could provide us with both, an English as well as a Japanese version of the study. A special thanks to the Analyst Team and Client Services Team, whose fluency in Japanese enhanced our comfort level, as we could converse with them in our preferred language.
Independent entrepreneurs
Arrow Precision
We approached MarketsandMarkets for study on Proppants Market, and their work exceeded our expectations. The study conducted was comprehensive and enabled us to view the market through the various dimensions. In addition, the team was extraordinarily responsive throughout the process and resolved our queries on time. I strongly recommend MarketsandMarkets and will certainly consider them for additional market assessments we will need in the future.
Global engineering company, Japan
Deputy Manager,
Strategic Planning OfficeThe high-quality insights shared by the MarketsandMarkets team helped us understand the pharmaceutical plant designers in a specific geography. It also captured the risks that we may likely face in communicating with our potential partners. The study would enable us identify partners, which would impact our future growth.
Growth opportunities and latent adjacency in Bioplastics & Biopolymers Market


UNNIKRISHNAN
Nov, 2018
To understand the implementation of plastic waste management in India. .
Nicholas
Apr, 2019
Looking for information on Bioplastic market.
Josselin
Feb, 2019
Market information global bioplastics and compostable plastics market..
yash
Jul, 2016
Invitaion to participate in BioPlastics conference.
Tami
Jul, 2019
General information on Bioplastics and Biopolymers .
Julian
Jul, 2014
Looking for market of Bio-Resin in Automotive, Marine and Construction.
Rob
Oct, 2017
Specific information on current and forecast bioplastics production in US along with segmentation .
Krishna
Jun, 2019
Industrial Hemp Market.
Luc�a
Sep, 2019
Specific interest in the market share of Bio-based polymers in this market.
James
Nov, 2018
Incomplete .
Laila
Apr, 2020
What is the market share and growth rate for the Biopolymers industries.
Amir
Mar, 2015
Information on Bio PET, Bio PE, PLA, PHA, Bio PBS, Starch Blends, and Regenerated Cellulose * Application: Packaging, Bottles, Agriculture, Automotive.
Klaus
Dec, 2021
How do you reference this work? Author, publisher etc?.
Kallol
Oct, 2016
Want to understand world production of Bioplastic and future growth.
Shashikant
Sep, 2017
Manufacturers of bio-pesticides, bio-polymer coated bags for post harvest management, we are Interested in bio-plastic..
rittawee
May, 2015
Demand / supply outlook of BioPlastic industry including competitiveness, market pricing, suitable application and challenges..
Abhaysaxena
May, 2019
lookinf for part time association with markets and markets .
Mihaela
Mar, 2018
Require Bioplastics & Biopolymers Market study.