Botanical Extracts Market by Source (Spices, Herbs, Flowers, Tea leaves), Application (Food: Bakery & Confectionery and Sauces & Dressings, Beverages: Alcoholic Beverages, Carbonated Soft Drinks, Ice Tea), Form, and Region - Global Forecast to 2022


[129 Pages] The botanical extracts market was valued at USD 3.60 billion in 2016 and is projected to grow at a CAGR of 9.0% from 2017, to reach a value of USD 6.03 billion by 2022. The basic objective of the report is to define, segment, and project the global market size of the market on the basis of source, application, product form, and region. It will also help to understand the structure of the market by identifying its various segments. The other objectives include analyzing the opportunities in the market for the stakeholders, providing the competitive landscape of the market trends, and projecting the size of the botanical extracts market and its submarkets, in terms of value (USD Million) and volume (KT).
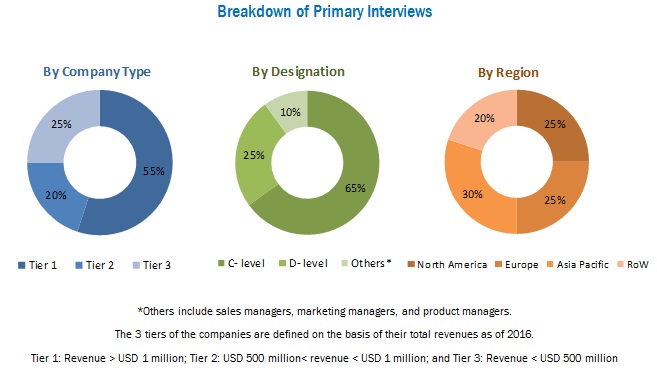
This research study involved extensive use of secondary sources: which included directories and databases, such as Hoovers, Forbes, Bloomberg Businessweek, and Factiva, to identify and collect information useful for a technical, market-oriented, and commercial study of the market. The primary sources that have been involved include industry experts from the core and related industries and preferred suppliers, dealers, manufacturers, alliances, standards & certification organizations from companies; and organizations related to all the segments of this industry’s value chain. In-depth interviews have been conducted with various primary respondents such as key industry participants, subject matter experts, C-level executives of the key market players, and industry consultants to obtain and verify critical qualitative and quantitative information as well as to assess future prospects. The following figure depicts the market research methodology applied in drafting this report on the botanical extracts market.
To know about the assumptions considered for the study, download the pdf brochure
Key participants in the botanical extracts market are the botanical extract manufacturers, suppliers, and regulatory bodies. The key players that are profiled in the report include Frutarom Ltd. (Israel), Kalsec Inc (U.S.), and Döhler GmbH (Germany), Nexira (France), Haldin Natural (Indonesia), Synthite Industries (India), MB-Holding GmbH & Co. KG (Germany), Synergy Flavors (U.S.), and Blue Sky Botanics (U.K.), Fytosan (France), and BI Nutraceuticals (U.S.).
This report is targeted at the existing industry players, which include the following:
- Botanical extract manufacturers
- Regulatory bodies
- Intermediary suppliers
- End users
“The study answers several questions for the stakeholders; primarily, which market segments to focus on in the next 2 to 5 years for prioritizing efforts and investments.”
Scope of the Report
On the basis of source, the market has been segmented as follows:
- Spices
- Herbs
- Flowers
- Tea leaves
On the basis of application, the market has been segmented as follows:
-
Food
- Bakery & confectionery
- Sauces and dressings
-
Beverages
- Alcoholic beverages
- Carbonated soft drinks
- Ice tea
- Flavored dairy products
On the basis of region, the market has been segmented as follows:
- North America
- Europe
- Asia Pacific
- RoW (South America and the Middle East & Africa)
Available Customization
With the given market data, MarketsandMarkets offers customizations according to company-specific needs.
The following customization options are available for the report:
Segment Analysis
- Product matrix, which gives a detailed comparison of the product portfolio of each company
Regional Analysis
- Further breakdown of the Rest of Asia Pacific botanical extracts market, by country
- Further breakdown of the Rest of Europe botanical extracts market, by country
Company Information
- Detailed analysis and profiling of additional market players (up to 5)
Rising demand for natural flavors in food applications to drive the global botanical extracts market size to USD 6032.5 million by 2022
Botanical extracts are used as ingredients in the food & beverage industry to modify flavor, aroma, or nutritive quality. Botanical extracts also impart properties such as enhanced flavor and extended shelf life and also reduce microbial spoilage. They are extracted from the tissue of a plant, usually by treating with a solvent such as alcohol or water. The global market was valued at USD 3.60 billion in 2016 and is projected to reach USD 6.0 million by 2022, at a CAGR of 9.0% during the forecast period.
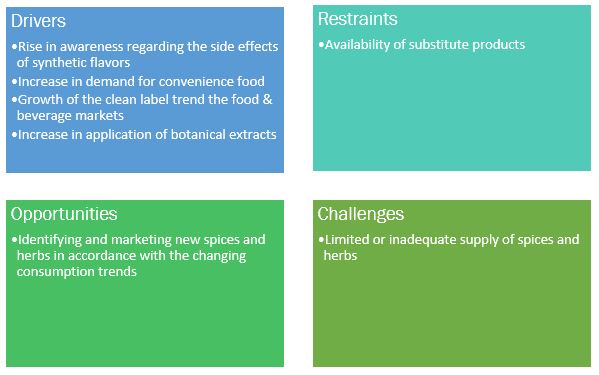
The growth in demand for convenience foods is projected to be one of the major drivers of botanical extracts such as spice extracts during the forecast period. This market is greatly influenced by the changes in consumption patterns of consumers who are seeking natural flavors in their food instead of synthetic ingredients due to the rising health awareness. The growing trend toward clean label products, which are slowly becoming mandatory across the globe, is also driving the market growth for botanical extracts and in turn compelling food manufacturers to develop new formulations and products to cater to the rising consumer demand for healthier food products. The increasing application of various botanical extracts such as spice & herb extracts, in combination with other ingredients, in various food products to enhance the flavor, is another factor expected to drive the botanical extracts market growth across the globe.
Availability of substitute products is the major restraint for the market
The availability of substitute products in the form of synthetic flavors is the main restraint for the market; this is largely due to the advantages associated with synthetic flavors such as lower prices compared to spices & herbs, uniform & consistent quality, and ease of use in contrast to natural products.
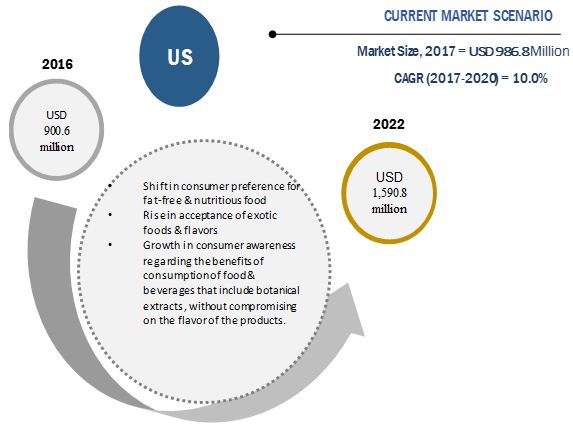
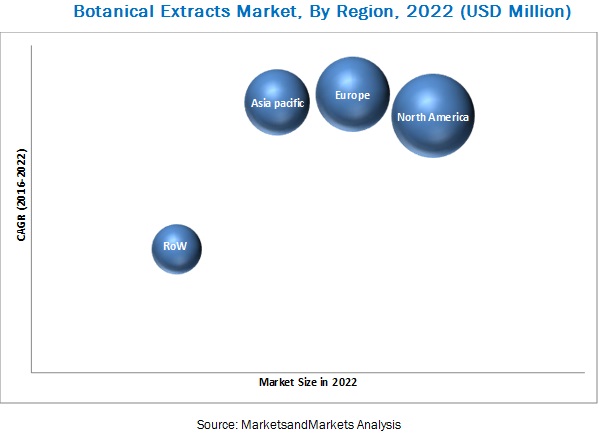
The North American market is primarily driven by the US which accounted for a share of about 35.3% in 2016. The US market is mainly driven by the growth in consumer awareness regarding the benefits of consumption of food & beverages that include botanical extracts, without compromising on the flavor of the products.
Market Dynamics
Botanical extracts in food: Demand is increasing due to healthy life choices
Botanical extracts are used as flavoring substances in fats, oils, and food emulsions. They produce a synergizing effect when added along with other natural food preservatives. This helps control the microbial growth, even if their antimicrobial effect is limited. The process used to derive such extracts is referred to as the food-grade liquid extraction process. Botanical extracts are standardized as water-soluble & oil-soluble liquids and powders with different strengths. Urbanization, high disposable income, and growing demand for healthy nutritional foods are key factors driving the natural extracts market.
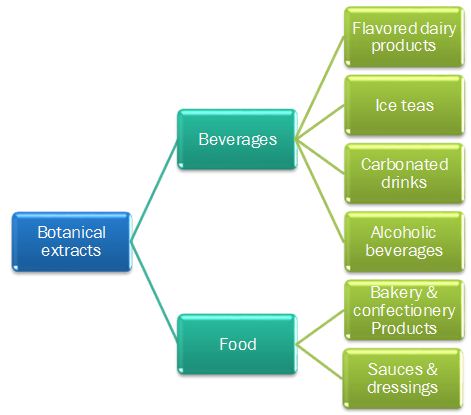
The food segment is further is subsegmented into bakery & confectionery products and sauces & dressings. The market in the food industry is dominated by the bakery & confectionery subsegment.
Bakery & confectionery products:
Bakery products include flour-based products such as bread, cakes, cookies, and pastries. Different kinds of flavors are used in bakery & confectionery products, varying according to the requirements of different regions. The demand for bakery products is increasing with the growth of the on-the-go consumption trend. With the high growth in demand for bakery & confectionery products, along with the increasing preference for natural flavoring agents, the market for botanical extracts in this industry is significant. Botanical extracts also play an essential role in improving the organoleptic characteristics and providing functional properties to the bakery product. This has further enhanced their demand in the industry.
Sauces & dressings:
Consumers demand fresh and authentic flavors, natural ingredients, and spices and expect high-quality soups, sauces, and dressings formulated for appealing taste, texture, and appearance. Manufacturers of ready-to-eat meal rely on sauces & seasonings to differentiate their products in the food service and retail industries. Developing traditional sauce profiles or creating new authentic regional sauces requires an optimal blend of botanical extracts and seasonings to match consumer tastes and preferences. Hence, manufacturers across the globe are importing various spices extracts, mostly from developing Asian countries, to create and maintain the required blend of spices & seasonings, in accordance with consumer demand.
Beverages: Clean label trend driving demand
With the rise in consumer demand for absolute transparency on product labels, manufacturers are replacing ingredients that consumers perceive to be “artificial,” “unhealthy,” or “processed.” As a result, the clean label trend has progressively become the new standard for many soft drink creators. Additionally, there has been a significant shift of consumers trying to find the right balance between healthy and tasty drinks. Extracts are used for flavoring. As consumers are seeking reduced sugar content in beverages without compromising on taste, manufacturers are focusing on using botanical extracts for taste and aroma. Consumers are also favoring beverages with added functional ingredients such as minerals and vitamins; botanical extracts are used to improve the nutritive value of these products while not compromising or enhancing the flavor profile.
The beverages segment is further is subsegmented into alcoholic beverages, carbonated soft drinks, iced teas, and flavored dairy products.
Alcoholic beverages
The most widely used spices in alcoholic drinks are cardamom, hot pepper, cinnamon, and ginger. These four ingredients could be used as extracts or, in the case of ginger, even in the juice form. Ginger and hot pepper are popular for their spice, while cinnamon and cardamom are mostly infused in drinks for sweetness and spice as well. Herbal extracts, on the other hand, are used for their distinctive properties, as well as for aromatic effects. Basil is the most widely used herb in most alcoholic and non-alcoholic beverages
Carbonated soft drinks
Carbonated drinks with natural ingredients, developed to offer a greater variety of tastes while providing functional properties, guarantee top line and innovative growth. Consumers prefer clean label and sustainably sourced products. The market for spice extracts in carbonated soft drinks is fairly well established, but brands are getting more innovative with their blends, as consumers become more familiar with spices in their beverages and are demanding greater variety. Using spices not only provides natural flavors but also help companies with product differentiation.
Iced tea:
The most popular flavors for ice tea are lemon, plain tea, and peach, though there have been launches of new flavors in recent years as well. An increase in unsweetened, organic, and diet variants has been observed in response to consumers opting for healthier alternatives to conventional beverages. Producers are adding to the “healthy” image of their products by adding herbal enhancements (often traditional to Asia) such as ginseng, matcha, and hibiscus, and bringing the antioxidant and cleansing properties of tea at the forefront of their brand imaging and marketing. For iced tea drinks, a stronger tea flavor becomes a high priority for beverage producers in order to provide a factor of difference between brands, to meet consumer demand, and to obtain higher levels of healthy ingredients found in tea.
Flavored dairy products:
Flavored dairy products include flavored milk, cheese, ice cream, and yogurt. Consumers are constantly looking for products with new flavors and health benefits. Dairy processors are now introducing spicy/savory dairy products containing various spice extracts, which gives a new flavor profile to these products, with additional health benefits. With newer flavors, the market for botanical extracts in this segment is projected to be promising.
Key Questions
- What are the upcoming technologies, substitutes, and trends that will have a significant impact on the market in the future?
- The spices segment is getting traction in the market, how will this impact the food industry in the next five years?
- What will the prominent revenue-generating pockets for the market in the next five years be?
- Most suppliers have opted for expansion & acquisition as the key strategies as could be seen from the recent developments. Where will it take the industry in the mid to long term?
The botanical extracts market was valued at USD 3.06 billion in 2016 and is projected to grow at a CAGR of 9.0% from 2017, to reach a value of 6.03 billion by 2022. Botanical extracts are widely used as ingredients in food & beverage applications, owing to their functional properties. Also, the growing demand for natural & nutritious products has increased the demand for botanical extracts in the food & beverage industry.
Based on source, the market has been segmented into spices, herbs, flowers, and tea leaves. The spice segment dominated the market in 2016. Changes in lifestyles and growth in the trend of exploring & experiencing new foods have led to the growth in the demand for spices. Developing new and diverse flavors in accordance with the changing consumer preferences is vital for spice extract manufacturers. Spices are the most widely used extracts among the other sources of botanical extracts.
Based on form, the market has been segmented into powder and liquid. The powdered form of botanical extracts is used in a wide range of applications such as meat, dairy, and bakery & confectionery to develop the desired aroma and taste and provide health benefits. These extracts are more stable than liquid botanical extracts and have increased shelf life. Due to the advantages associated with this form, such as convenience of use and easy dissolvability in water, this segment accounted for the largest market share of botanical extracts in 2016 and is expected to remain dominant during the forecast period.
In terms of application, the food segment dominated the market in 2016. Between the food & beverage sub-industries, the application of these extracts in food is estimated to account for a larger market share. The market in the food industry is dominated by the bakery & confectionery subsegment, while the market in the beverage industry is dominated by alcoholic beverages. The demand for bakery products is increasing with the growth of the on-the-go consumption trend. With high growth in demand for bakery and confectionery products, along with the increase in preferences for natural flavoring agents, the market for botanical extracts in this industry is significant. As botanical extracts are completely natural, their “clean label” allows greater preference by consumers who are slowly shifting toward natural, healthy, and organic products. The rising consumer demands for natural food ingredients is expected to increase the demand for botanical extracts across all applications.
Asia Pacific is projected to be the fastest-growing market for botanical extracts during the forecast period. The Asia-Pacific botanical extracts market is driven by shifting consumer preference toward natural products and increasing concerns about healthy lifestyles. The key market players in the Asia- Pacific market include P.T. Indesso Aroma (Indonesia) and Haldin Natural (Indonesia). The rapid economic growth in the region is expected to propel high demand for such ingredients, especially in China, India, and the Southeast Asian countries. India was the largest revenue contributor to the Asia-Pacific market in 2016. The region has a large number of small-scale farmers involved in the trading of spice and herb extracts due to suitable climatic conditions. The growing demand for organic processed food & beverages is expected to influence the Asia-Pacific market.
The challenges faced by the botanical extract manufacturers include the limited or inadequate supply and varying prices of herbs and spices. Many spices and herbs are available in specific seasons and are harvested annually. Lack of continuity in the supply of raw materials is one of the major challenges faced by the botanical extract market . In addition, the prices of herbs and spices may vary on the basis of availability and season.
The key participants in the botanical extracts market are the botanical extract manufacturers, suppliers, and regulatory bodies. The key players that are profiled in the report include Frutarom Ltd. (Israel), Kalsec Inc (U.S.), and Döhler GmbH (Germany), Nexira (France), Haldin Natural (Indonesia), Synthite Industries (India), MB-Holding GmbH & Co. KG (Germany), Synergy Flavors (U.S.), and Blue Sky Botanics (U.K.), Fytosan (France), BI Nutraceuticals (U.S.).
To speak to our analyst for a discussion on the above findings, click Speak to Analyst
 Exclusive indicates content/data unique to MarketsandMarkets and not available with any competitors.
Table of Contents
1 Introduction (Page No. - 13)
1.1 Objectives of the Study
1.2 Market Definition
1.3 Study Scope
1.3.1 Periodization Considered
1.4 Currency Considered
1.5 Units Considered
1.6 Stakeholders
2 Research Methodology (Page No. - 17)
2.1 Research Data
2.1.1 Secondary Data
2.1.2 Primary Data
2.2 Market Size Estimation
2.2.1 Bottom-Up Approach
2.2.2 Top-Down Approach
2.3 Market Breakdown & Data Triangulation
2.4 Research Assumptions & Limitations
2.4.1 Assumptions
2.4.2 Limitations
3 Executive Summary (Page No. - 25)
4 Premium Insights (Page No. - 29)
4.1 Market Opportunities for Botanical Extract Manufacturers
4.2 Botanical Extracts Market, By Region
4.3 Market, By Source & Region
4.4 Botanical Extracts Market Attractiveness
5 Market Overview (Page No. - 33)
5.1 Introduction
5.2 Market Dynamics
5.2.1 Drivers
5.2.1.1 Increase in the Demand for Convenience Food
5.2.1.2 Rise in Awareness Regarding the Side-Effects of Synthetic Flavors
5.2.1.3 Growth of the Clean Label Trend Across Food & Beverage Markets
5.2.1.4 Increase in Application of Botanical Extracts
5.2.2 Restraints
5.2.2.1 Availability of Substitutes
5.2.3 Opportunities
5.2.3.1 Identifying and Marketing New Spices and Herbs in Accordance With the Changing Consumption Trends
5.2.4 Challenges
5.2.4.1 Limited Or Inadequate Supply and Varying Prices of Herbs & Spices
5.3 Regulations and Standardization in Botanical Extract Market
5.3.1 Introduction
5.3.2 North America
5.3.2.1 U.S. Food and Drug Administration
5.3.3 Europe
5.3.3.1 European Food Safety Authority
5.3.4 Asia-Pacific
5.3.4.1 Food Standards Australia New Zealand
5.3.4.2 Food Safety and Standards Authority of India
6 Botanical Extracts Market, By Source (Page No. - 38)
6.1 Introduction
6.1.1 Spices
6.1.2 Herbs
6.1.3 Flowers
6.1.4 Tea Leaves
7 Botanical Extracts Market, By Form (Page No. - 42)
7.1 Introduction
7.1.1 Powder
7.1.2 Liquid
8 Botanical Extracts Market, By Application (Page No. - 45)
8.1 Introduction
8.1.1 Food
8.1.1.1 Bakery & Confectionery
8.1.1.2 Sauces & Dressings
8.1.2 Beverages
8.1.2.1 Alcoholic Beverages
8.1.2.2 Carbonated Soft Drinks
8.1.2.3 Ice Tea
8.1.2.4 Flavored Dairy Products
9 Botanical Extracts Market, By Region (Page No. - 51)
9.1 Introduction
9.2 North America
9.2.1 U.S.
9.2.2 Canada
9.2.3 Mexico
9.3 Europe
9.3.1 Germany
9.3.2 France
9.3.3 U.K.
9.3.4 Rest of Europe
9.4 Asia-Pacific
9.4.1 China
9.4.2 Japan
9.4.3 India
9.4.4 Australia & New Zealand
9.4.5 Rest of Asia-Pacific
9.5 Rest of the World (RoW)
9.5.1 South America
9.5.2 The Middle East
9.5.3 Africa
10 Competitive Landscape (Page No. - 80)
10.1 Introduction
10.2 Vendor Dive Analysis
10.2.1 Vanguard
10.2.2 Innovator
10.2.3 Dynamic
10.2.4 Emerging
10.3 Competitive Benchmarking
10.3.1 Product Offering Scorecard (For 25 Players)
10.3.2 Business Strategy Scorecard (For 25 Players)
*Top 25 Companies Analyzed for This Study are – Frutarom Ltd. (Israel), Blue Sky Botanics (U.K), Ransom Naturals Ltd (U.K), Prinova Group LLC, Pt. Indesso Aroma (Indonesia), Synergy Flavors (U.S.), Haldin Natural (Indonesia), Kalsec Inc (U.S.), Synthite Industries (India), Döhler GmbH (Germany), BI Nutraceuticals (U.S.), Nutra Green Biotechnology (China), Kuber Impex Ltd (India), Greenvit (Poland), Mb-Holding GmbH & Co. Kg (Germany), Inovia International (U.K), Green Source Organics (U.S.), Changsha Botaneix, Inc (China), Organic Herb Inc (China), Arjuna Natural Extracts Ltd (India), Nexira (France), Jairamdass Khushiram Impex Pvt. Ltd (India), Futureceuticals, Inc. (U.S.), Fytosan (France), Acumen Life Sciences (India)
11 Company Profiles (Page No. - 84)
(Business Overview, Products Offered & Services Strategies, Key Insights, Recent Developments, MnM View)*
11.1 Introduction
11.2 Frutarom Industries Ltd.
11.3 Blue Sky Botanics Ltd
11.4 Ransom Naturals Ltd
11.5 Prinova Group LLC.
11.6 Pt. Indesso Aroma
11.7 Synergy Flavors
11.8 Haldin Natural
11.9 Kalsec Inc.
11.10 Synthite Industries Ltd.
11.11 Döhler GmbH
11.12 BI Nutraceuticals
11.13 Nutra Green Biotechnology Co., Ltd
11.14 Kuber Impex Ltd.
11.15 Mb-Holding GmbH & Co. Kg
*Details on Business Overview, Products Offered & Services Strategies, Key Insights, Recent Developments, MnM View Might Not Be Captured in Case of Unlisted Companies.
12 Appendix (Page No. - 120)
12.1 Insights of Industry Experts
12.2 Discussion Guide
12.3 Knowledge Store: Marketsandmarkets’ Subscription Portal
12.4 Introducing RT: Real-Time Market Intelligence
12.5 Available Customizations
12.6 Related Reports
12.7 Author Details
List of Tables (60 Tables)
Table 1 Botanical Extracts Market Size, By Source, 2015–2022 (USD Million)
Table 2 Market Size, By Source, 2015–2022 (Tons)
Table 3 Market Size, By Form, 2015–2022 (USD Million)
Table 4 Market Size, By Form, 2015–2022 (Tons)
Table 5 Market Size, By Application, 2015–2022 (USD Million)
Table 6 Market Size, By Application, 2015–2022 (Tons)
Table 7 Market Size, By Food Sub-Application, 2015–2022 (USD Million)
Table 8 Market Size, By Food Sub-Application, 2015–2022 (Tons)
Table 9 Market Size, By Beverage Sub-Application, 2015–2022 (USD Million)
Table 10 Market Size, By Beverage Sub-Application, 2015–2022 (Tons)
Table 11 Botanical Extracts Market Size, By Region, 2015–2022 (USD Million)
Table 12 Market Size, By Region, 2015–2022 (Tons)
Table 13 North America: Market Size, By Country, 2015–2022 (USD Million)
Table 14 North America: Market Size, By Country, 2015–2022 (Tons)
Table 15 North America: Market Size, By Source, 2015–2022 (USD Million)
Table 16 North America: Market Size, By Source, 2015–2022 (Tons)
Table 17 North America: Market Size, By Application, 2015–2022 (USD Million)
Table 18 North America: Botanical Extracts Market Size, By Application, 2015–2022 (Tons)
Table 19 North America: Market Size, By Food Sub-Application, 2015–2022 (USD Million)
Table 20 North America: Market Size, By Food Sub-Application, 2015–2022 (Tons)
Table 21 North America: Market Size, By Beverage Sub-Application, 2015–2022 (USD Million)
Table 22 North America: Market Size, By Beverage Sub-Application, 2015–2022 (Tons)
Table 23 North America: Market Size, By Form, 2015–2022 (USD Million)
Table 24 North America: Market Size, By Form, 2015–2022 (Tons)
Table 25 Europe: Botanical Extracts Market Size, By Country, 2015–2022 (USD Million)
Table 26 Europe: Market Size, By Country, 2015–2022 (Tons)
Table 27 Europe: Market Size, By Source, 2015–2022 (USD Million)
Table 28 Europe: Market Size, By Source, 2015–2022 (Tons)
Table 29 Europe: Market Size, By Application, 2015–2022 (USD Million)
Table 30 Europe: Market Size, By Application, 2015–2022 (Tons)
Table 31 Europe: Market Size, By Food Sub-Application, 2015–2022 (USD Million)
Table 32 Europe: Market Size, By Food Sub-Application, 2015–2022 (Tons)
Table 33 Europe: Botanical Extracts Market Size, By Beverage Sub-Application, 2015–2022 (USD Million)
Table 34 Europe: Market Size, By Beverage Sub-Application, 2015–2022 (Tons)
Table 35 Europe: Botanical Extracts Market Size, By Form, 2015–2022 (USD Million)
Table 36 Europe: Market Size, By Form, 2015–2022 (Tons)
Table 37 Asia-Pacific: Market Size, By Country, 2015–2022 (USD Million)
Table 38 Asia-Pacific: Market Size, By Country, 2015–2022 (Tons)
Table 39 Asia-Pacific: Market Size, By Source, 2015–2022 (USD Million)
Table 40 Asia-Pacific: Market Size, By Source, 2015–2022 (Tons)
Table 41 Asia-Pacific: Market Size, By Application, 2015–2022 (USD Million)
Table 42 Asia-Pacific: Botanical Extracts Market Size, By Application, 2015–2022 (Tons)
Table 43 Asia-Pacific: Market Size, By Food Sub-Application, 2015–2022 (USD Million)
Table 44 Asia-Pacific: Market Size, By Food Sub-Application, 2015–2022 (Tons)
Table 45 Asia-Pacific: Market Size, By Beverage Sub-Application, 2015–2022 (USD Million)
Table 46 Asia-Pacific: Market Size, By Beverage Sub-Application, 2015–2022 (Tons)
Table 47 Asia-Pacific: Market Size, By Form, 2015–2022 (USD Million)
Table 48 Asia-Pacific: Market Size, By Form, 2015–2022 (Tons)
Table 49 RoW: Market Size, By Region, 2015–2022 (USD Million)
Table 50 RoW: Market Size, By Region, 2015–2022 (Tons)
Table 51 RoW: Market Size, By Source, 2015–2022 (USD Million)
Table 52 RoW: Market Size, By Source, 2015–2022 (Tons)
Table 53 RoW: Market Size, By Application, 2015–2022 (USD Million)
Table 54 RoW: Market Size, By Application, 2015–2022 (Tons)
Table 55 RoW: Market Size, By Food Sub-Application, 2015–2022 (USD Million)
Table 56 RoW: Market Size, By Food Sub-Application, 2015–2022 (Tons)
Table 57 RoW: Botanical Extracts Market Size, By Beverage Sub-Application, 2015–2022 (USD Million)
Table 58 RoW: Market Size, By Beverage Sub-Application, 2015–2022 (Tons)
Table 59 RoW: Botanical Extracts Market Size, By Form, 2015–2022 (USD Million)
Table 60 RoW: Market Size For Botanical Extracts, By Form, 2015–2022 (Tons)
List of Figures (24 Figures)
Figure 1 Market Segmentation
Figure 2 Botanical Extracts Market: Regional Segmentation
Figure 3 Botanical Extracts Market: Research Design
Figure 4 Breakdown of Primaries, By Company Type, Designation, and Region
Figure 5 Market Size Estimation Methodology: Bottom-Up Approach
Figure 6 Market Size Estimation Methodology: Top-Down Approach
Figure 7 Data Triangulation & Methodology
Figure 8 Beverages Segment Projected to Be the Fastest-Growing
Figure 9 Botanical Extracts Snapshot (2017 vs 2022): Spices Segment, By Source, Projected to Be the Largest During the Forecast Period
Figure 10 Botanical Extracts Snapshot (2017 vs 2022): Powder Segment Projected to Be Relatively Larger
Figure 11 North America Dominated the Botanical Extracts Market in 2016
Figure 12 Attractive Growth Opportunities in the Botanical Extracts Market for Manufacturers Between 2017 & 2022
Figure 13 Botanical Extracts Market: Europe to Grow at the Highest Rate From 2017 to 2022
Figure 14 Spice Extracts Segment Dominated the Botanical Extracts Market Across All Regions in 2017, in Terms of Value
Figure 15 Japan is Projected to Be the Fastest-Growing Country-Level Market
Figure 16 Market: Drivers, Restraints, Opportunities, and Challenges
Figure 17 Market Size, By Source, 2017–2022 (USD Million)
Figure 18 Market Size For Botanical Extracts, By Form, 2017–2022 (USD Million)
Figure 19 Market Size For Botanical Extracts, By Application, 2017–2022 (USD Million)
Figure 20 Geographic Snapshot: U.K. Projected to Grow at the Highest Rate in the European Botanical Extracts Market, 2017–2022
Figure 21 North American Botanical Extracts Market Snapshot: U.S. Accounted for the Largest Market Share
Figure 22 European Botanical Extracts Market Snapshot: Germany Accounted for the Largest Share
Figure 23 Dive Chart
Figure 24 Frutarom Industries Ltd.: Company Snapshot


Growth opportunities and latent adjacency in Botanical Extracts Market